
Technical data


Web Tools Administrator’s Guide 14-9
Publication Number: 53-0000522-09
Creating Advanced Performance Monitoring Graphs
14
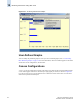
Figure 14-5 Creating an SID/DID Performance Graph
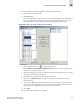
3. Click a port from the Slot/Port or Sid/Did Selection List.
a. Drag the selected port into the Enter/drag port number field.
b. Click Retrieve preset EE monitors.
The current end-to-end monitors for that port are displayed in the “Current EE monitors set for
selected port” table.
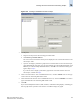
c. Optional: To display a performance graph for the current EE monitors set for the selected port,
click a SID-DID pair in the table. You can select multiple source ID and Destination IDs. Click
Select. If you selected multiple SID/DID monitors, click OK in the confirmation dialog that
appears. Skip to step 6.
If you do not want to display a performance graph for the current EE monitors set for the
selected port, continue with step 4.
4. Click a source ID from the “Port or Sid/Did Selection List,” and click Add Sid. You can also type
a source ID in the “Enter/drag SID number” field.
5. Click a destination ID from the “Port or Sid/Did Selection List,” and click Add Did. You can also
type a destination ID in the “Enter/drag DID number” field.
6. Click OK.
If you selected multiple EE monitors, SIDs, or PIDs, a confirmation dialog displays, reminding you
that one graph will be opened for each selection. Click Yes to display the graphs.