
Technical data


Web Tools Administrator’s Guide 14-11
Publication Number: 53-0000522-09
Creating Advanced Performance Monitoring Graphs
14
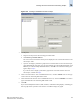
Figure 14-6 Creating a SCSI Command Graph
3. Navigate to a switch > slot > port in the Slot/Port Selection List.
4. Click the port from the Slot/Port Selection List and drag it into the Enter/drag slot,port field.
5. Optional: For the LUN per port graphs, type a LUN number, in hexadecimal.
For the SilkWorm 4012 and 4100 switches, you can enter up to eight LUN masks.
For the SilkWorm 48000 director, you can enter up to four LUN masks.
For all other switches running Fabric OS v4.x or v5.x, you can enter up to two LUN masks.
For switches running Fabric OS v3.x, you can enter up to three LUN masks.
6. Click OK.
The selected graph is displayed in the canvas.
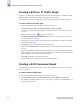
Creating an AL_PA Error Graph
The AL_PA Error graph displays CRC errors for a given port and a given AL_PA. The AL_PA Error
graph is not supported on the SilkWorm 4012 and 4100 switches.
To create an AL_PA error graph
1. Launch the Performance Monitor module as described on page 14-5.
2. Click Performance Graphs > Advanced Monitoring > ALPA Error.
The ALPA Error Setup dialog displays (see Figure 14-7 on page 14-12).
3. Navigate to a switch > slot > port in the Slot/Port or Alpa Selection List.
4. Click the port from the Slot/Port Selection List or an AL_PA from the Slot/Port Selection List, and
drag it into the “Enter/drag slot,port” field. You can also manually type the slot and port number, in
the format slot,port.
5. Click OK.
The AL_PA Error graph displays on the canvas.