
Technical data


14-12 Web Tools Administrator’s Guide
Publication Number: 53-0000522-09
Managing Performance Graphs
14
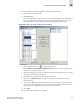
Figure 14-7 Creating an ALPA Error Graph
Managing Performance Graphs
This section provides the following procedures for managing performance graphs:
• Saving Graphs to a Canvas
• Adding a Graph to an Existing Canvas
• Printing Graphs
• Modifying an Existing Graph
Saving Graphs to a Canvas
Saving graphs is especially useful when you create customized graphs and do not want to re-create them
every time you access the Performance Monitor module.
When you save graphs, you must save them to a canvas. The following procedure describes how to save
graphs to a new canvas.
To save graphs
1. Launch the Performance Monitor module as described on page 14-5.
2. Create basic or advanced Performance Monitor graphs, as described in “Creating a Basic
Performance Monitor Graph” on page 14-5 and “Creating Advanced Performance Monitoring
Graphs” on page 14-8.
The graphs are displayed in the in the Performance Monitor window.
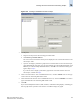
3. Click File > Save Current Canvas Configuration.
The Save Canvas Configuration dialog displays.
4. Type a name and description for the configuration and then click Save Canvas.
A message displays, confirming that the configuration was successfully saved to the switch.