
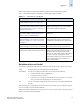
Technical data


Web Tools Administrator’s Guide 2-3
Publication Number: 53-0000522-09
Overview
2
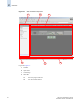
Task Bar
The left pane of Web Tools EZ is the task bar, which displays all tasks. The tasks are categorized by
switch, zoning, and device. Clicking a category displays the following:
Switch Switch status
Zoning Active zoning in matrix
Device Device table
When Web Tools EZ launches, the Switch status page is shown by default.
Caption Bar
The caption bar displays the switch name and the switch time. You can modify this information by
clicking Setup in the task bar.
Click the refresh icon to update the information on the screen with the current switch information.
When you click a different task in the task bar, the display is automatically refreshed.
Content Page
Web Tools EZ displays information in pages, which are displayed on the right side of the window. A
page can contain a table or other information. Additionally, a page might contain tabs. The tabs are at
the top of the page and provide a categorized view of information about objects shown on the page. You
can click a tab to view the display for that tab.
Status Bar
The status bar is at the bottom of the window. It is divided into the following sections:
• Error and progress indicator
This is on the left side of the status bar. When Switch Manager is sending data to or retrieving data
from the Multiprotocol Router, this indicator is animated. The indicator turns red if there are any
errors during the retrieval process. Clicking this indicator opens the Error Log window.
• User name and IP address
The right side of the status bar lists your user ID, your role, and the IP address of the switch to
which you are connected.