
Technical data


Web Tools Administrator’s Guide 3-9
Publication Number: 53-0000522-09
Viewing the Switch Explorer
3
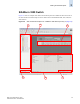
Switch View Button Menu
The Switch View button menu is the launch point for the Switch Events screen, telnet interface, Fabric
Watch module, Switch Admin module, Performance Monitor module, and High Availability (HA)
Admin module. Some of these functions require a license key to activate. The Switch View button
menu also includes buttons that display the status of the switch fans, temperature monitors, switch
information, power supply, and beacon. If upfront login is enabled, the Switch View button menu also
includes a Logout button.
It is important to note that certain Fabric OS features are available only on particular switch types;
therefore, the icons for those features are displayed only for those switch types. For example, the High
Availability feature is available only on the SilkWorm 12000, 24000, and 48000 directors; therefore,
the HA Admin button displays in the Switch View button menu only for those directors.
The following buttons have a color-coded background, which indicates status for that area:
• Status
• Fan
• Temp
• Power
• Hi Avail (HA)
The colors follow the status legend (see “Status Legend” on page 3-9).
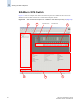
Switch Information View
The Switch Information View displays vital switch information such as name, status, Fabric OS
version, domain ID, IP address, WWN, and current zone configuration. The information in the Switch
Information View is polled every 15 seconds.
The Switch Information View is located beside the graphic representation of the switch for the
SilkWorm 12000, 24000, and 48000 directors. For all other switch types (SilkWorm 200E, 3014, 3016,
3250, 3850, 3900, 4012, and 4100), the Switch Information View is located beneath the graphic
representation of the switch.
For more information, refer to “Displaying Switch Information” on page 11-4.
Status Legend
The Status Legend is included in the Switch Information View and defines the meaning of colors visible
in the background of the various icons in the Switch Explorer. Each color indicates a different
operational state:
• Green: healthy
• Yellow: marginal
• Red: critical
• Gray: unknown or unmonitored
Note
For all status displays based on errors per time interval, any errors cause the status to show faulty until
the entire sample interval has passed.