
Technical data


Web Tools Administrator’s Guide 4-21
Publication Number: 53-0000522-09
Monitoring Events
4
There are four message severity levels: Critical, Error, Warning, and Info. Table 4-2 lists the event
message severity levels displayed in the Switch and Fabric Events windows, and explains what qualifies
event messages to be certain levels.
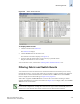
In both the Switch Events window and the Fabric Events window, you can click the Filter button to
launch the Filter Events dialog. The Filter Events dialog allows you to define which events should be
displayed in the Switch Events window or Fabric Events window. For more information on filtering
events, refer to “Filtering Fabric and Switch Events” on page 4-23.
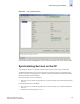
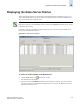
Displaying Fabric Events
Events are displayed for all switches in the fabric in the Fabric Events window (see Figure 4-7 on
page 4-22). Fabric events are not automatically polled. You must click Refresh from the Fabric Events
window to poll fabric events. Switch events are automatically polled every 15 seconds.
Fabric Events can be collected only for switches that have the same security level (http or https) as the
launch switch. For switches that have a different level of security from the launch switch, a message is
displayed at the top of the window indicating how many switches have no events reported from the last
polling. For detailed information on the switch names and reasons for not polling (if available), click
Details.
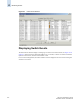
To display fabric events
1. Click a fabric from the Fabric Tree.
2. Click the Fabric Events icon on the Fabric Toolbar.
The Fabric Events window displays (see Figure 4-7).
3. Optional: Click the column head to sort the events by a particular column.
Drag the column divider to resize a column.
You can also filter events, as described in “Filtering Fabric and Switch Events” on page 4-23.
Table 4-2 Event Severity Levels
Icon and Level Description
Critical (1)
Critical-level messages indicate that the software has detected serious problems
that will eventually cause a partial or complete failure of a subsystem if not
corrected immediately; for example, a power supply failure or rise in temperature
must receive immediate attention.
Error (2)
Error-level messages represent an error condition that does not impact overall
system functionality significantly. For example, error-level messages might
indicate timeouts on certain operations, failures of certain operations after retries,
invalid parameters, or failure to perform a requested operation.
Warning (3)
Warning-level messages highlight a current operating condition that should be
checked or it might lead to a failure in the future. For example, a power supply
failure in a redundant system relays a warning that the system is no longer
operating in redundant mode and that the failed power supply needs to be replaced
or fixed.
Info (4)
Information-level messages report the current nonerror status of the system
components; for example, the online and offline status of a fabric port.