
Technical data


Web Tools Administrator’s Guide 4-23
Publication Number: 53-0000522-09
Monitoring Events
4
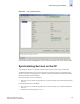
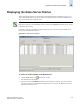
Figure 4-8 Switch Events Window
To display switch events
1. Click the switch from the Fabric Tree.
The Switch View displays.
2. Click the Events button on the Switch View.
The Switch Events window displays (see Figure 4-8).
3. Optional: Click the column head to sort the events by a particular column.
Drag the column divider to resize a column.
You can also filter events, as described in “Filtering Fabric and Switch Events,” next.
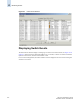
Filtering Fabric and Switch Events
You can filter the events in the Fabric Events window and Switch Events window by time, severity,
message ID, and service. You can apply either one type of filter at a time or multiple types of filters at
the same time. The Switch and Fabric Events windows both have a Filter button. Click the Filter
button to display the Event Filter dialog (see Figure 4-9 on page 4-24).
When a filter is applied, the Show All button is active in the events window and the type of filter
applied is identified at the top of the events window (see Figure 4-8). To unapply a filter, click the Show
All button in the events window.
Note
For two-switch configurations, clicking the Events button for a given switch automatically filters out
switch service events from the other switch. Chassis service is shown in both events lists.