
Technical data


Web Tools Administrator’s Guide 4-25
Publication Number: 53-0000522-09
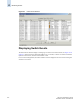
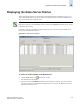
Monitoring Events
4
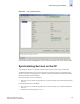
To filter events by event severity levels
1. Launch the Fabric or Switch Events window as described in “Displaying Fabric Events” on
page 4-21 or “Displaying Switch Events” on page 4-22.
2. Click Filter.
The Event Filter dialog displays.
3. Click Level.
The event severity level checkboxes are enabled.
4. Click the event levels you want to display.
5. Click OK.
The filter is enabled and the enabled filter type is displayed in the events window.
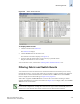
To filter events by message ID
1. Launch the Fabric or Switch Events window as described in “Displaying Fabric Events” on
page 4-21 or “Displaying Switch Events” on page 4-22.
2. Click Filter.
The Event Filter dialog displays.
3. Click Message ID.
4. Type the message IDs in the associated field. You can enter multiple message IDs as long as you
separate them by commas. You can type either the full message ID (moduleID-messageType) or a
partial ID (moduleID only).
5. Click OK.
The filter is enabled and the enabled filter type is displayed in the events window.
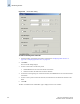
To filter events by service component
1. Launch the Fabric or Switch Events window as described in “Displaying Fabric Events” on
page 4-21 or “Displaying Switch Events” on page 4-22.
2. Click Filter.
The Event Filter dialog displays.
3. Click Service.
The event service drop-down list is enabled.
4. Select either “Switch” or “Chassis” from the drop-down list to show only those messages from the
logical switch or from the chassis.
5. Click OK.
The filter is enabled and the enabled filter type is displayed in the events window.