
Technical data


Monitoring and Alerting Policy Suite Administrator’s Guide 45
53-1002933-02
MAPS dashboard overview
6
ITW(ITWs) -------
LOSS_SYNC(SyncLoss) -------
LF -------
LOSS_SIGNAL(LOS) -------
PE(Errors)-------
STATE_CHG -------
LR -------
C3TXTO(Timeouts) -------
RX(%) -------
TX(%) -------
UTIL(%) -------
BN_SECS(Seconds) -------
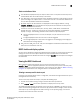
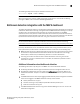
Viewing data for a specific time window
Detailed historical data provides the status of the switch for a specific time window. This is useful if,
for example, users are reporting problems on a specific day or time. The same port-display patterns
apply to viewing detailed historical data as for ordinary historical data.
To view detailed historical data about a switch, complete the following steps.
1. Connect to the switch and log in using an account with admin permissions.
2. Run mapsDb --show details and specify either the day or the hour of the current day you want
to view.
mapsdb --show details -day dd/mm/yyyy
or
mapsdb --show details -hour hh
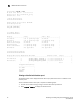
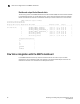
The following example displays historical port performance data for July 9, 2013 for a
chassis-based platform. Because the health status of the current switch poliucy is “CRITICAL”, the
sections “Contributing Factors” and “Rules affecting health” are displayed. If the current switch
policy status was “HEALTHY”, neither of these sections would be displayed.
switch:admin> mapsdb --show details -day 7/09/2013
DB start time: Tue Jul 9 17:17:33 2013
Active policy: dflt_conservative_policy
Fenced Ports : none
1 Switch Health Report:
=======================
Current Switch Policy Status: CRITICAL
Contributing Factors:
---------------------
*BAD_PWR (MARGINAL).
*BAD_FAN (CRITICAL).
2.1 Summary Report:
===================
Category |Today |Last 7 days |
--------------------------------------------------------------------------------
Port Health |Out of operating range |No Errors |
Fru Health |Out of operating range |In operating range |
Security Violations |No Errors |No Errors |
Fabric State Changes |No Errors |No Errors |