
Configuration Guide User guide


1134 BigIron RX Series Configuration Guide
53-1002484-04
Displaying sFlow information
40
Displaying sFlow counters
sFlow counters are included in the output of the show interface ethernet command.
In the output, the sFlow counters show:
• ignored - Bad Ethernet frames were received which includes CRC, runts, giants, and malformed
frames
• DMA received - Good packets were received
• DMA transmitted - Good packets were transmitted
Syntax: show interface ethernet
Configured default sampling rate The configured global sampling rate. If you changed the global sampling
rate, the value you entered is shown here. The actual rate calculated by
the software based on the value you entered is listed on the next line,
”Actual default sampling rate”.
UDP packets exported The number of sFlow export packets the device has sent.
NOTE: Each UDP packet can contain multiple samples.
sFlow samples collected The number of sampled packets that have been sent to the collectors.
sFlow ports The ports on which you enabled sFlow.
Global Sample Rate The global sampling rate for the device.
Port Sampling Rates The sampling rates of a port on which sFlow is enabled.
Hardware Sample Rate The actual sampling rate. This is the same as the Global Sample Rate
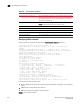
TABLE 184 sFlow information (Continued)
This field... Displays...
BigIron RX(config)# show interface ethernet 1/1
GigabitEthernet2/1 is disabled, line protocol is down, link keepalive is
enabled
Hardware is GigabitEthernet, address is 000c.dbe2.5900 (bia 000c.dbe2.5900)
Configured speed 1Gbit, actual unknown, configured duplex fdx, actual unknown
Configured mdi mode AUTO, actual unknown
Member of 2 L2 VLANs, port is tagged, port state is Disabled
STP configured to ON, Priority is level7, flow control enabled
Force-DSCP disabled
mirror disabled, monitor disabled
Not member of any active trunks
Not member of any configured trunks
No port name
MTU 1522 bytes, encapsulation ethernet
300 second input rate: 0 bits/sec, 0 packets/sec, 0.00% utilization
300 second output rate: 0 bits/sec, 0 packets/sec, 0.00% utilization
0 packets input, 0 bytes, 0 no buffer
Received 0 broadcasts, 0 multicasts, 0 unicasts
0 input errors, 0 CRC, 0 frame, 0 ignored
0 runts, 0 giants, DMA received 0 packets
0 packets output, 0 bytes, 0 underruns
Transmitted 0 broadcasts, 0 multicasts, 0 unicasts
0 output errors, 0 collisions, DMA transmitted 0 packets
Port Translation counter 8, Port UP counter 4,Port Down Counter 4
Last port state change at:May 15 11:42:59
port Translation counter for last 5min =5, 1hr =8, 24hr =8 and 30days =8