
User Manual v12.3.0 Owner's manual


1114 Brocade Network Advisor IP User Manual
53-1003153-01
IP real-time performance monitoring
34
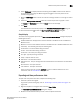
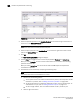
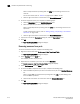
FIGURE 465 Select Sources - Real Time Graphs / Tables dialog box
2. Select the products you want in the Available Products list and click the right arrow button to
move them to the Selected Products list.
NOTE
You cannot select more than 100 products and ports.
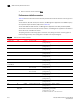
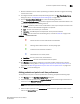
3. Select the ports you want in the Available Ports list and click the right arrow button to move
them to the Selected Ports list.
4. Click OK.
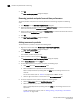
The Real Time Graphs/Tables dialog box displays.
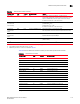
5. Use the Show list to toggle the tree structure display between Products and Collectibles.
When you select Products, the tree structure shows devices on the network that are being
polled for collectible data.
When you select Collectibles, the tree structure shows the MIB objects and expressions
associated with products.
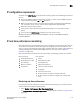
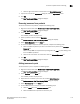
6. Add collectors to be monitored by completing the following steps.
NOTE
You cannot select more than 20 collectors at a time.
a. Choose from the following options:
• To view performance for all collectors defined for the product, click the product. To add
collectors to a product, refer to “Adding measures to products” on page 1116.
• To view performance for all collectors defined for the port, click an individual port. To
add collectors to a port, refer to “Adding measures to ports” on page 1117.
• To view a single collector, click an individual collector under a product or port.
b. Click the right arrow button.