
User Manual v12.3.0 Owner's manual

1122 Brocade Network Advisor IP User Manual
53-1003153-01
IP real-time performance monitoring
34
9. (Real Time Graphs/Tables and Historical Graphs/Tables dialog boxes only) Click Save as
Widget to create a performance monitor published widget on the active dashboard. For
instructions, refer to “Configuring a monitor from a performance graph” on page 385.
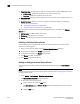
Configuring graph options
Use the following steps to configure graph options for real time performance graph display as well
as time series monitors on the Dashboard tab.
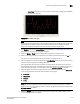
1. Click Options on the graph.
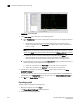
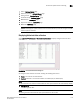
The Graph Options dialog box displays, as shown in Figure 467 on page 1122.
FIGURE 467 Graph Options dialog box (Historical Graphs/Tables dialog box)
NOTE
Figure 467 illustrates the Graph Options dialog box available from the Historical
Graphs/Tables dialog box. The Graph Options dialog box available from the Real Time
Graphs/Tables dialog box is similar, but has fewer control options.
2. Select the type of chart style from the Chart Style list.
Available chart styles include Line Chart, Area Chart, or Bar Chart.
3. Select the graph accuracy to up to three decimal places in the Value Decimal Places list.
4. Select from the following check boxes to define how polled data displays: