
User Manual v12.3.0 Owner's manual
Brocade Network Advisor IP User Manual 1125
53-1003153-01
IP historical performance monitoring
34
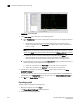
• Spreadsheet (.csv)
• Image (.png)
The Save dialog box displays.
3. Browse to the location where you want to save the export file.
4. Enter a name for the export file.
5. Click Save.
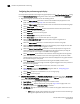
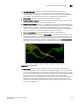
Printing a graph
To print a graph, complete the following steps.
1. Right-click the graph and select Print.
The Page Setup dialog box displays.
2. Edit the paper, orientation, and margins, as needed.
3. Click Printer to select a printer.
4. Click OK.
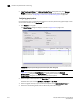
IP historical performance monitoring
Historical performance monitoring allows you create data collectors by choosing MIB object and by
choosing or creating mathematical expressions. You can also configure a historical data graph or
table to display data. The following options and features are available for obtaining historical
performance data:
• Define a data collector by mapping a MIB (Management Information Base) object to a unit
name (refer to “MIB data collectors” on page 1143).
• Specify and adjust threshold values and polling intervals, and set time schedules for data
collection. Historical data is recorded in a database for retrieval in the form of graphs and
tables.
• Store records for each port.