
User Manual v12.3.0 Owner's manual

1126 Brocade Network Advisor IP User Manual
53-1003153-01
IP historical performance monitoring
34
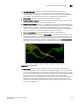
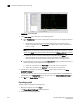
• Create a custom graph or table display for data by defining options such as the following:
- Selecting a product for displaying data.
- Selecting measures to collect.
- Modifying collectors.
- Plotting minimum and maximum values.
- Displaying data points or polling intervals.
- Displaying events.
- Selecting a graph or table format.
- Enabling granularity of data to display:
5 minutes granularity for last 8 days
30 minutes granularity for last 14 days
2 hour granularity for last 30 days
1 day granularity for last 730 days
- Displaying advanced monitoring service (AMS) violation events.
- Providing a period for plotting the graph or table.
Related topics
“Editing system collectors”
“Displaying historical data collectors”
“Enabling a historical data collector”
“Adding or editing a historical data collector”
“Adding third-party device MIB objects manually”
“IP performance monitoring and traffic analysis”
“IP configuration requirements”
“IP real-time performance monitoring”
“IP Custom performance reports”
“IP sFlow configuration”
“IP Traffic analyzer monitoring and sFlow reports”
“IP traffic accounting”
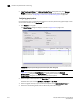
Editing system collectors
Subject to the following restrictions, you can edit system collectors using the Data Collector wizard
(refer to “Adding or editing a historical data collector” on page 1128).
You can modify the following attributes:
• Enable/disable settings - Collector Basics page
• Target selection - Select Source page
• Threshold and Rearm settings - Threshold and Rearm page
You cannot modify the following attributes: