
User Manual v12.3.0 Owner's manual

Brocade Network Advisor IP User Manual 1139
53-1003153-01
IP historical performance monitoring
34
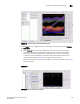
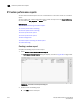
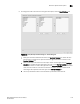
FIGURE 479 Historical Graphs/Tables Data Monitoring tab
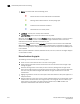
3. Use the Show selector to toggle the tree structure display in the left panel between Products
and Collectibles.
• Select Products and the left panel displays the tree structure of devices and device
interfaces on the network being polled for collectible data. The right panel displays
measures currently being collected for the selected product or port in the left panel.
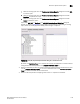
In addition, measures collected for attached wireless access point (AP) devices and
controllers display. Refer to Figure 482 on page 1140 for an example.
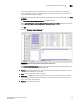
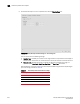
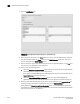
Measures also displays for IP products that appear in the device tree. Refer to Figure 481
for NetIron devices.
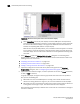
FIGURE 480
FIGURE 481
NetIron Historical Graph display