
User Manual v12.3.0 Owner's manual

Brocade Network Advisor IP User Manual 221
53-1003153-01
Dashboard customization
7
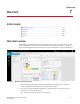
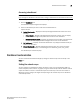
Accessing a dashboard
NOTE
If you change the dashboard in the Java client, change is reflected in the web client and vice versa.
To access a specific dashboard, complete the following steps.
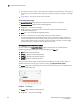
1. Click the Dashboard icon.
The Dashboard expand navigation bar displays.
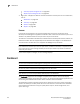
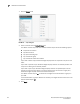
2. Select the dashboard you want to view from the Dashboards list.
Options include:
• Default Dashboards — Displays the three preconfigured dashboards. Select one of the
following:
- IP Port Health — Displays preconfigured IP performance monitors. You can display
additional status widgets and performance monitors in this dashboard.
- Product Status and Traffic — Displays preconfigured status widgets and performance
monitors. You can display additional widgets and monitors in this dashboard.
• My Dashboards — Displays user-defined dashboards. Only displays dashboards that you
create in the Java client.
• Shared Dashboards — Displays dashboards shared by other users in the Java client.
Shared dashboards display in the following format: dashboard_name (user_name).
The dashboard you selected displays.
Dashboard customization
You can customize the dashboard display by setting the network scope and time scope in the
Scope list.
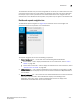
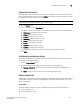
Setting the network scope
You can configure the dashboard to display all objects in your area of responsibility (AOR) or a
subset of objects (fabrics, devices, or groups) using the network scope selection. Default network
scopes are visible to all users. User-defined scopes are visible only to the user who created it.
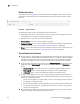
Whenever scope is changed, all widgets corresponding to the network scope in the dashboard
automatically refresh.