
User Manual v12.3.0 Owner's manual

Brocade Network Advisor IP User Manual 225
53-1003153-01
Dashboard customization
7
Product Status and Traffic
The Product Status and Traffic dashboard provides the following preconfigured status widgets and
performance monitors:
• Status widget
• When you launch the Port page, the detailed view closes.When you launch the Port page, the
detailed view closes.“Configuring the dashboard display” on page 223Events widget
• Out of Range Violations widget
• Top Product Memory Utilization monitor
• Top Product CPU Utilization monitor
• Top Products with Unused Ports monitor
• Top Port Utilization Percentage monitor (includes details for all ports, Initiator ports, ISL ports,
and Target ports)
• Bottom Port Utilization Percentage monitor (includes details for all ports, Initiator ports, ISL
ports, and Target ports)
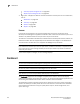
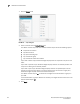
My Dashboards
The My Dashboards list includes all dashboards that you create in the Java Client. The My
Dashboards list does not display until you save a dashboard to My Dashboards in the Java Client. If
you share a dashboard you created the shared icon ( ) displays next to the dashboard name in
the My Dashboards list.
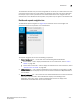
Shared Dashboards
The Shared Dashboards list includes all user-defined dashboards that have been shared with other
users in the Java Client. Shared dashboards display in the following format: dashboard_name
(user_name). The Shared Dashboards list does not display until a dashboard is shared with other
users in the Java Client.
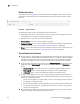
Status widgets
The Management application provides the following preconfigured status widgets:
• Access Point Status widget — Pie chart view of access point devices categorized by operational
and reachability status.
• When you launch the Port page, the detailed view closes.When you launch the Port page, the
detailed view closes.“Configuring the dashboard display” on page 223Events widget — Bar
chart view of events grouped by severity and range.
• Host Adapter Inventory widget — Stacked bar chart view of Host Adapters grouped by selected
category.
• IP Inventory widget — Stacked bar chart view of IP devices grouped by operational status and
selected category.
• IP Status widget — Pie chart view of IP devices categorized by operational and reachability
status.
• Out of Range Violations widget — Table view of all out of range threshold violations reported by
Network OS devices