
User Manual v12.3.0 Owner's manual


Brocade Network Advisor IP User Manual 249
53-1003153-01
Dashboard customization
7
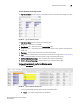
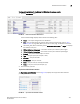
Top Port Traffic monitor
The Top Port Traffic monitor (Figure 89) displays the top ports with receive and transmit traffic in a
table.
FIGURE 89 Top Port Traffic monitor
The Top Port Traffic monitor includes the following data:
• Widget title — The name of the widget.
• View Details icon — Click to launch the Detailed View page.
• Widget summary — The product count for each status (worst to best) displays underneath the
widget title.
• Port — The port affected by this monitor. Click to launch the Port Page (refer to “Port summary
view” on page 276). When you launch the Port page, the detailed view closes.
• Connected_Port (where Connected_Port is Connected Port, Initiator, or Target) — Displays the
address of the port:
• RX Traffic (MB/s) — The top receive traffic in megabits per second.
• TX Traffic (MB/s) — The top transmit traffic in megabits per second.
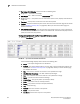
Viewing additional details for the Top Port Traffic monitor
1. Click the View Details icon.
A more detailed widget displays which includes the following data:
• Scope — The scope configured for the dashboard.
• Port — The port affected by this monitor. Click to launch the Port Page (refer to “Port
summary view” on page 276). When you launch the Port page, the detailed view closes.
• Connected_Port (where Connected_Port is Connected Port, Initiator, or Target) — Displays
the address of the port:
• RX Traffic (MB/s) — The top receive traffic in megabits per second.
• TX Traffic (MB/s) — The top transmit traffic in megabits per second.
• Product — The product affected by this monitor.
• Type — The type of port (for example, U-Port).
• Identifier — The port identifier.