
User Manual v12.3.0 Owner's manual


Brocade Network Advisor IP User Manual 253
53-1003153-01
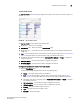
Dashboard customization
7
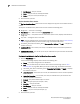
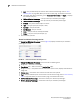
Viewing additional details for the Bottom Port Utilization Percentage monitor
1. Click the View Details icon.
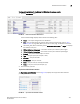
FIGURE 93 Bottom Port Utilization Detailed View
A more detailed widget displays which includes the following data:
• Scope — The scope configured for the dashboard.
• Port — The port affected by this monitor. Click to launch the Port Page (refer to “Port
summary view” on page 276). When you launch the Port page, the detailed view closes.
• Connected_Port (where Connected_Port is Connected Port, Initiator, or Target) — Displays
the address of the port:
• RX Port Utilization Percentage — The bottom receive port utilization percentages.
• TX Port Utilization Percentage — The bottom transmit port utilization percentages.
• Product — The product affected by this monitor.
• Type — The type of port (for example, U-Port).
• Identifier — The port identifier.
• Port Number — The port number.
• State — The port state (for example, Enabled).
• Status — The port status (for example, Up).
2. Click the close (X) button.
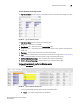
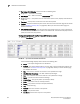
Top Product CPU Utilization monitor
The Top Product CPU Utilization monitor (Figure 94) displays the top product CPU utilization
percentages in a table.
FIGURE 94 Top Product CPU Utilization monitor