
User Manual v12.3.0 Owner's manual


330 Brocade Network Advisor IP User Manual
53-1003153-01
Default dashboards
8
Default dashboards
The Management application provides preconfigured dashboards which provide high-level overview
of the network, the current states of managed devices, and performance of devices, ports, and
traffic on the network.
Product Status and Traffic dashboard
The Product Status and Traffic dashboard provides the following preconfigured status widgets and
performance monitors:
• IP Inventory widget
• Status widget
The Bottleneck Graph dialog box displays event information for a specific duration by selecting one
of the following from the time period:
• Out of Range Violations widget
• Top Product Memory Utilization monitor
• Top Product CPU Utilization monitor
• Top Products with Unused Ports monitor
• Top Port Utilization Percentage monitor (includes details for all ports, Initiator ports, ISL ports,
and Target ports)
• Bottom Port Utilization Percentage monitor (includes details for all ports, Initiator ports, ISL
ports, and Target ports)
IP Port Health
The IP Ports Health dashboard provides the following preconfigured performance monitors:
• Top Port Errors monitor
• Top Port CRC Errors monitor
• Top Port Discards monitor
• Top Port Receive EOF monitor
• Top Port Underflow Errors monitor
• Top Port Over flow Errors monitor
• Top Port Runtime Errors monitor
• Top Port Too Long Errors monitor
• Top Port Alignment Errors monitor
Status widgets
The Management application provides the following preconfigured status widgets:
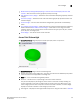
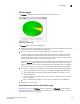
• Access Point Status widget — Pie chart view of access point devices categorized by operational
and reachability status