
User Manual v12.3.0 Owner's manual


Brocade Network Advisor IP User Manual 331
53-1003153-01
Status widgets
8
• Bottleneck Graph dialog boxDisplay Range is 150 minutes and the Display Interval is 300
seconds — Bar chart view of events grouped by severity and range
• Host Adapter Inventory widget — Stacked bar chart view of Host Adapters grouped by selected
category
• IP Inventory widget — Stacked bar chart view of IP devices grouped by operational status and
selected category
• IP Status widget — Pie chart view of IP devices categorized by operational and reachability
status
• Out of Range Violations widget — Table view of all out of range threshold violations reported by
Network OS devicesPort Health Violations widget — Table view of out of range port health
violations. There are four versions of this monitor based on the type of port: All ports, initiator
ports, ISL ports, and Target ports.
• Status widget — List view of various status attributes
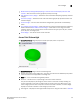
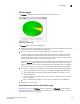
Access Point Status widget
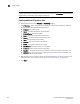
The Access Point Status widget displays the access point (AP) status as a pie chart.
FIGURE 144 Access Point Status widget
The Access Point Status widget includes the following data:
• Severity icon/product count/widget title — The color of the worst status followed by the product
count with that status displays before the widget title.
• Show list — A list of available managed AP products.
• Pie chart — The AP status as a percentage of the total number of devices.
The pie chart displays the percentage in various colors on each slice. Tooltips showing the
number of devices in that state are shown when you pause on the slice. When there is one
status category with less than one percent of the total number of devices, the status widget
displays the number of devices in each category on each slice.
• Color legend — Displays the color legend below the pie chart using the color codes in Table 29.