
User Manual v12.3.0 Owner's manual

Brocade Network Advisor IP User Manual 349
53-1003153-01
Performance monitors
8
• Status — The port status (for example, Up).
• Refreshed — The time of the last update for the monitor.
To customize the monitor to display data by a selected time frame as well as customize the display
options, refer to “Editing a preconfigured performance monitor” on page 370.
Accessing additional data from the Top Port C3 Discards RX TO monitor
• Right-click a row in the monitor to access the shortcut menu available for the associated
device. For more information about shortcut menus, refer to “IP shortcut menus” on
page 1406.
• In a Top N or Bottom N C3 Discards TX TO and C3 Discards RX TO monitors, right-click an
FC-port row and select Discarded Frames to navigate to the Discarded Frames dialog box. For
more information, refer to “Viewing discarded frames from a port” on page 661.
• Double-click a row to navigate to the Historical Graphs/Tables dialog box. For more
information, refer to “Performance Data” on page 1099.
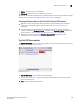
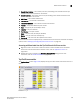
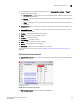
Top Port CRC Errors monitor
The Top Port CRC Errors monitor (Figure 155) displays the top ports with frames that contain cyclic
redundancy check (CRC) errors in a table.
FIGURE 155 Top Port CRC Errors monitor
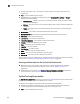
The Top Port CRC Errors monitor includes the following data:
• Severity icon/monitor title — The worst severity of the data based on the error count shown
next to the monitor title.
• Port — The port affected by this monitor.