
User Manual v12.3.0 Owner's manual

358 Brocade Network Advisor IP User Manual
53-1003153-01
Performance monitors
8
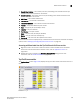
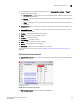
• Severity icon/monitor title — The color of the worst severity of the data shown next to the
monitor title.
• Port — The port affected by this monitor.
• Connected_Port_Link (where Connected_Port_Link is Connected Port, Initiator, or Target) —
Displays one of the following:
- Connected Port — The ISL or IFL port on the connected device. Click to launch the switch
port properties dialog box.
- Initiator — The initiator port on the connected device. Click to launch the device properties
dialog box.
- Target — The target port on the connected device. Click to launch the device properties
dialog box.
• Sync Losses — The number of synchronization failures for the port.
• Sync Losses/sec — The number of synchronization failures for the port per second.
• CRC Errors — The number of CRC errors.
• Link Failures — The number of link failures.
• Invalid Transmissions — The number of invalid transmissions.
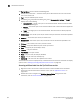
• Product — The product affected by this monitor.
• Type — The type of port (for example, U-Port).
• Identifier — The port identifier.
• Port Number — The port number.
• State — The port state (for example, Online).
• Status — The port status (for example, In_Sync, No_Sync).
• Refreshed — The time of the last update for the monitor.
To customize the monitor to display data by a selected time frame as well as customize the display
options, refer to “Editing a preconfigured performance monitor” on page 370.
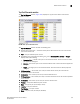
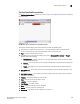
Accessing additional data from the Top Port Link Resets monitor
• Right-click a row in the monitor to access the shortcut menu available for the associated
device. For more information about shortcut menus, refer to “Application menus” on
page 1399.
• Double-click a row to navigate to the Custom: Historical Performance Graphs dialog box. For
more information, refer to “Performance Data” on page 1099.
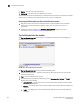
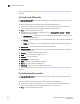
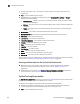
Top Port Too Long Errors monitor
The Top Port Too Long Errors performance monitor (Figure 163) displays the top ports with frames
longer than the maximum frame size allowed errors in a table.
The Top Port Too Long Errors performance monitor includes the following data:
• Threshold icon/object count/monitor title — The color associated with the threshold and
number of objects within that threshold displays next to the monitor title.
• Port — The port affected by this monitor.