
User Manual v12.3.0 Owner's manual


372 Brocade Network Advisor IP User Manual
53-1003153-01
User-defined performance monitors
8
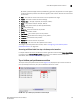
• Port
- Common
Port Utilization Percentage — The memory utilization percentage.
Traffic — The traffic in mbps.
CRC Errors — The number of CRC errors.
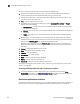
- IP
Errors — The number of errors.
Discards — The number of discarded frames.
SFP Ethernet Tx Power — The SFP Ethernet Tx power in dbm.
SFP Ethernet Rx Power — The SFP Ethernet Rx power in dbm.
SFP Ethernet Temperature — The SFP temperature in Celsius.
SFP Ethernet Current — The SFP Ethernet current in mA.
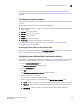
- Wireless
Dropped Events — The number of dropped events.
MAC Errors — The number of MAC errors.
Back Packets Received — The number of bad packets received.
Tx Errors — The number of transmit errors.
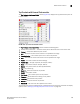
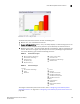
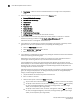
Top or bottom product performance monitors
The top or bottom product performance monitors (Figure 169) display the top or bottom number of
products (for example, top 10 products) for the selected measure in a table.
FIGURE 169 Top or bottom product performance monitor example
The top or bottom product performance monitor includes the following data:
• Threshold icon/object count/monitor title — The color associated with the threshold and
number of objects within that threshold displays next to the monitor title.
• Product — The product affected by this monitor.
• Min — The minimum value of the measure in the specified time range.
• Measure_Type — The percentage bar of the selected measure.