
User Manual v12.3.0 Owner's manual


Brocade Network Advisor IP User Manual 375
53-1003153-01
User-defined performance monitors
8
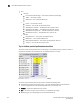
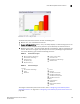
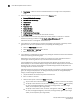
FIGURE 171 Distribution performance monitor example
The distribution performance monitor includes the following data:
• Monitor title — The user-defined monitor title.
• Number of Products/Ports (y-axis) — The y-axis always displays a numbered range (zero to the
maximum number of objects) for the products or ports affected by the selected measure.
• Measure_Type (x-axis) — The x-axis display depends on the Measure_Type you selected for this
monitor. Each bar on the graph maps directly to one of the five percentage ranges defined for
the monitor. Measure_Type includes the following measures:
To configure a distribution performance monitor, refer to “Configuring a user-defined product
performance monitor” on page 377 or “Configuring a user-defined port performance monitor” on
page 380.
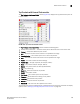
TABLE 32 Product measures types
• Memory Utilization Percentage
• CPU Utilization Percentage
• Temperature (C)
• Fan Speed (rpm)
• Response Time (s)
• System Up Time (days)
• Ports Not In Use
• Ping Packet Loss Percentage
• AP Client Count
TABLE 33 Port measures types
Common
• Port Utilization Percentage
• Traffic
• CRC Errors
IP
• Errors
• Discards
• SFP Ethernet Tx Power
• SFP Ethernet Rx Power
• SFP Ethernet Temperature
• SFP Ethernet Current
Wireless
• Dropped Events
• MAC Errors
• Back Packets Received
• Tx Errors