
User Manual v12.3.0 Owner's manual


Brocade Network Advisor IP User Manual 385
53-1003153-01
User-defined performance monitors
8
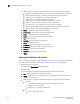
- Discards — The number of discarded frames.
- SFP Ethernet Tx Power — The SFP Ethernet Tx power in dbm.
- SFP Ethernet Rx Power — The SFP Ethernet Rx power in dbm.
- SFP Ethernet Temperature — The SFP temperature in Celsius.
- SFP Ethernet Current — The SFP Ethernet current in mA.
Wireless
- Dropped Events — The number of dropped events.
- MAC Errors — The number of MAC errors.
- Back Packets Received — The number of bad packets received.
- Tx Errors — The number of transmit errors.
• Product — The product affected by this monitor.
• Type — The type of port (for example, U-Port).
• Identifier — The port identifier.
• Port Number — The port number.
• State — The port state (for example, Enabled).
• Status — The port status (for example, Up).
3. Click Close.
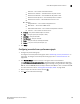
Configuring a monitor from a performance graph
1. Configure the performance graph.
To configure a real-time performance graph, refer to “Monitoring real-time performance” on
page 1113. To configure a historical performance graph, refer to “Performance Data” on
page 1099.
2. Click Save As Widget to create a monitor of the graph data for the dashboard.
The Performance Dashboard Monitor Title dialog box displays. The Management application
generates a default name for the monitor using the following naming convention: Chart_Type -
MM DD, YYYY HH:MM AM/PM. For example, Realtime Chart Monitor - Nov 2, 2012 11:02 AM.
For more information, refer to “Viewing Historical Graphs/Tables” on page 1138.
3. Enter a unique name for the monitor and click OK.
4. Click OK on the confirmation message.