
User Manual v12.1.0 Instruction Manual

Brocade Network Advisor SAN + IP User Manual 1473
53-1002949-01
SAN historical performance data
43
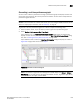
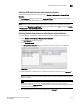
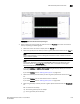
FIGURE 635 Historical Performance Graph dialog box
3. Select a default or custom-saved port and time from the Favorites list or filter the historical
data by completing the following steps.
a. Select the number of results to display from the Display list.
b. Select the type of port from which you want to gather performance data from the From list.
NOTE
Devices with 10GE ports must be running Fabric OS 6.4.1 or later to obtain the correct
TE port statistics (TX/RX).
NOTE
Devices with 10GE ports must have the RMON MIB enabled on the switch. For more
information about the rmon collection command, refer to the Fabric OS Converged
Enhanced Ethernet Command Reference.
If you select Custom, the Custom Port Selector dialog box displays where you can save
selected ports as a favorite.
If you select Custom, refer to “Filtering data by ports” on page 1475.
c. Select the historical period for which you want to gather performance data from the For
list.
If you select Custom, you can save selected time as a favorite.
If you select Custom, refer to “Filtering data by time” on page 1476.
d. Select the granularity at which you want to gather performance data from the Granularity
list.
• 5 minutes for last 8 days
• 30 minutes granularity for last 14days
• 2 hour granularity for last 30 days