
User Manual v12.1.0 Instruction Manual

Brocade Network Advisor SAN + IP User Manual 1501
53-1002949-01
SAN connection utilization
43
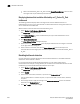
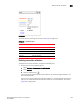
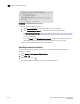
FIGURE 647 Utilization Legend
The colors and their meanings are outlined in Table 142 on page 1501.
TABLE 142 Utilization Legend
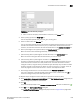
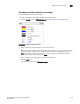
Enabling connection utilization
To display the connection utilization, complete the following steps.
1. Choose from one of the following options:
• Select Monitor > Performance > View Utilization.
• Press CTRL + U.
• Click the Utilization icon ( ).
If you have already enabled historical data collection, the Utilization Legend displays in the
main interface window.
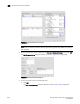
If you have not already enabled historical data collection, a message appears informing you
that you must enable historical data collection before you can view utilization, as shown in
Figure 648 on page 1502.
Line color Utilization defaults
Red line 80% to 100% utilization
Yellow line 40% to 80% utilization
Blue line 1% to 40% utilization
Gray line 0% to 1% utilization
Black line Utilization disabled