
User Manual v12.1.0 Instruction Manual
1832 Brocade Network Advisor SAN + IP User Manual
53-1002949-01
MAPS integration with other features
50
MAPS integration with other features
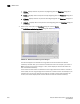
Dashboard MAPS widgets
The MAPS widgets display on the main Dashboard tab (refer to “Monitoring and Alerting Policy
Suite widgets” on page 299). The Management application provides the following preconfigured
MAPS widgets:
• Out of Range Violations widget — Table view of all out of range threshold violations reported in
your SAN (refer to “Out of Range Violations widget” on page 300).
• Port Health Violations widget — Table view of out of range port health violations (refer to “Port
Health Violations widget” on page 302). There are four port health violation widgets: All, ISL,
Initiator, and Target.
Master Log
The Master Log displays MAPS events the same as any other events. MAPS events display in the
following format:
severity="warning" message="Monitoring and Alerting System notification - Rule rule_name
violated. Obj: object_number/name-from_trap"
To view detailed information for an event, refer to “Displaying event properties from the Master
Log” on page 1774.
Performance graphs and monitors
You can enable events on historical graphs and monitors. For instructions, refer to ““Configuring
the performance graph display” on page 1511.
Once enabled, if the Management application receives any MAPS violation events during the time
range specified on the historical graph or monitor, event icons (indicating the severity) display on
the historical graphs and monitors. Place the cursor on an event icon to view the event details.
MAPS event details include the following information:
• Time base
• Switch or port information
• Name of the rule with a violation
• Condition of the rule that caused a violation