
User Manual v12.1.0 Instruction Manual
Brocade Network Advisor SAN + IP User Manual 337
53-1002949-01
User-defined performance monitors
8
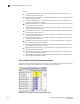
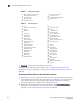
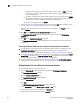
The top or bottom product performance monitor includes the following data:
• Threshold icon/object count/monitor title — The color associated with the threshold and
number of objects within that threshold displays next to the monitor title.
• Product — The product affected by this monitor.
• Min — The minimum value of the measure in the specified time range.
• Measure_Type — The percentage bar of the selected measure.
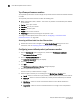
By default, products display sorted by the Measure_Type value (Top products sort from highest
to lowest and bottom products sort lowest to highest). Click a column head to sort the columns
by that value.
• Max — The maximum value of the measure in the specified time range.
• Fabric — The fabric to which the device belongs.
• Product Type — The type of product (for example, switch).
• State — The product state (for example, Offline).
• Status — The product status (for example, Reachable).
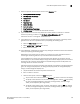
• Tag — The product tag.
• Serial # — The serial number of the product.
• Model — The product model.
• Port Count — The number of ports on the product.
• Firmware — The firmware level running on the product.
• Location — The location of the product.
• Contact — A contact name for the product.
• Refreshed — The time of the last update for the monitor.
To configure a product performance monitor, refer to “Configuring a user-defined product
performance monitor” on page 342.
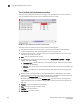
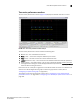
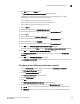
Accessing additional data from top or bottom product monitors
In a Top N or Bottom N monitor, double-click a row or right-click a row and select Show Graph/Table
to navigate to the Historical Graphs/Tables dialog box for the selected measures. For more
information, refer to “Performance Data” on page 1459.