
User Manual v12.1.0 Instruction Manual

338 Brocade Network Advisor SAN + IP User Manual
53-1002949-01
User-defined performance monitors
8
Top or bottom port performance monitors
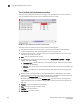
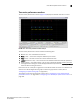
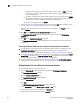
The top or bottom port performance monitors (Figure 131) display the top or bottom number of
ports (for example, bottom 10 ports) for the selected measure in a table.
FIGURE 131 Top or bottom port performance monitor example
The top or bottom port performance monitor includes the following data:
• Threshold icon/object count/monitor title — The color associated with the threshold and
number of objects within that threshold displays next to the monitor title.
• Severity icon/monitor title — The worst severity of the data based on the error count or error
rate shown next to the monitor title.
• Port — The port affected by this monitor.
• Connected_Port_Link (where Connected_Port_Link is Connected Port, Initiator, or Target) —
Displays one of the following:
- Connected Port — The ISL or IFL port on the connected device. Click to launch the switch
port properties dialog box.
- Initiator — The initiator port on the connected device. Click to launch the device properties
dialog box.
- Target — The target port on the connected device. Click to launch the device properties
dialog box.
• Measure_Type — The percentage bar of the selected measure. Depending on the selected
measure, both the error rate (per second) and error count may display. For selected measures,
more than one Measure_Type may display (for example RX and TX).
By default, ports display sorted by the Measure_Type value (Top ports sort from highest to
lowest and bottom ports sort lowest to highest). Click a column head to sort the columns by
that value.
• Product — The product affected by this monitor.
• Type — The type of port (for example, U-Port).
• Identifier — The port identifier.
• Port Number — The port number.