
User Manual v12.1.0 Instruction Manual

Brocade Network Advisor SAN + IP User Manual 339
53-1002949-01
User-defined performance monitors
8
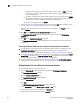
• State — The port state (for example, Enabled).
• Status — The port status (for example, Up).
• Refreshed — The time of the last update for the monitor.
To configure a port performance monitor, refer to “Configuring a user-defined port performance
monitor” on page 345.
Accessing additional data from top or bottom port monitors
• (SAN ports) In a Top N or Bottom N monitor, double-click a row or right-click a row and select
Show Graph/Table to navigate to the Custom: Historical Performance Graph dialog box for the
selected measures. For more information, refer to “Generating and saving a historical
performance graph” on page 1472.
• (IP ports) In a Top N or Bottom N monitor, double-click a row or right-click a row and select
Show Graph/Table to navigate to the Historical Graphs/Tables dialog box for the selected
measures. For more information, refer to “Performance Data” on page 1459.
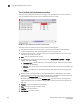
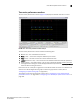
Distribution performance monitors
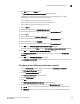
The distribution performance monitor (Figure 132) displays the distribution (number) of products
or ports for each of the five percentage ranges defined for the selected measure in a bar graph.
FIGURE 132 Distribution performance monitor example
The distribution performance monitor includes the following data:
• Monitor title — The user-defined monitor title.
• Number of Products/Ports (y-axis) — The y-axis always displays a numbered range (zero to the
maximum number of objects) for the products or ports affected by the selected measure.
• Measure_Type (x-axis) — The x-axis display depends on the Measure_Type you selected for this
monitor. Each bar on the graph maps directly to one of the five percentage ranges defined for
the monitor. Measure_Type includes the following measures: