
User Manual v12.1.0 Instruction Manual
340 Brocade Network Advisor SAN + IP User Manual
53-1002949-01
User-defined performance monitors
8
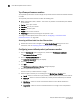
• Refreshed — The time of the last update for the monitor.
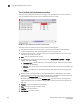
To configure a distribution performance monitor, refer to “Configuring a user-defined product
performance monitor” on page 342 or “Configuring a user-defined port performance monitor” on
page 345.
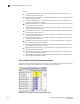
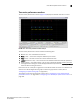
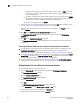
Accessing additional data from the Distribution monitors
• Place the cursor on a bar in the graph to display the number of products included in the count
for the selected bar. For example, the tooltip “(Data Item 3, 22.6-33.8) = 6” means that there
are six products within the third percentage range (displays the temperatures within the
percentage range) for the selected measure (product temperature).
• Double-click a percentage range to navigate to the Monitor_Title Distribution Data Details
dialog box. for more information, refer to “Viewing product distribution data details” on
page 349 or “Viewing port distribution data details” on page 350.
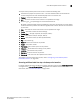
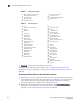
TABLE 38 Product measures types
• Memory Utilization Percentage
• CPU Utilization Percentage
• Temperature (C)
• Fan Speed (rpm)
• Response Time (s)
• System Up Time (days)
• Ports Not In Use
• Ping Packet Loss Percentage
• AP Client Count
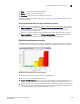
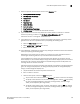
TABLE 39 Port measures types
Common
• Port Utilization Percentage
• Traffic
• CRC Errors
FC
• Link Resets
• Signal Losses
• Sync Losses
• Link Failures
• Sequence Errors
• Invalid Transmissions
• C3 Discards
• C3 Discards TX TO
• C3 Discards RX TO
• C3 Discards Unreachable
• C3 Discards Other
• Encode Error Out
• SFP Power
• SFP Voltage
• SFP Current
• SFP Temperature
FCIP
• Compression Ratio
• Latency
• Dropped Packets
• Link Retransmits
• Timeout Retransmits
• Fast Retransmits
• Duplicate Ack Received
• Window Size RTT
• TCP Out of Order Segments
• Slow Start Status
IP
• Errors
• Discards
• Receive EOF
• Underflow Errors
• Overflow Errors
• Alignment Errors
• Runtime Errors
• Too Long Errors
Wireless
• Dropped Events
• MAC Errors
• Back Packets Received
• Tx Errors