53-1003155-01 11 July 2014 Brocade Network Advisor SAN + IP User Manual Supporting Network Advisor 12.3.
Copyright © 2014, Brocade Communications Systems, Inc. All Rights Reserved. Brocade, the B-wing symbol, Brocade Assurance, ADX, AnyIO, DCX, Fabric OS, FastIron, HyperEdge, ICX, MLX, MyBrocade, NetIron, OpenScript, VCS, VDX, and Vyatta are registered trademarks, and The Effortless Network and the On-Demand Data Center are trademarks of Brocade Communications Systems, Inc., in the United States and in other countries. Other brands and product names mentioned may be trademarks of others.
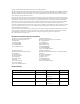
Title Publication number Summary of changes Date Brocade Network Advisor SAN + IP User Manual 53-1002697-01 Updated for Network Advisor 12.0.0. December 2012 Brocade Network Advisor SAN + IP User Manual 53-1002949-01 Updated for Network Advisor 12.1.0. July 2013 Brocade Network Advisor SAN + IP User Manual 53-1003058-01 Updated for Network Advisor 12.2.0. January 2014 Brocade Network Advisor SAN + IP User Manual 53-1003155-01 Updated for Network Advisor 12.3.0.
ivBrocade Network Advisor SAN + IP User Manual 53-1003155-01
Contents About This Document How this document is organized . . . . . . . . . . . . . . . . . . . . . . . . . . . . lvii Supported hardware and software . . . . . . . . . . . . . . . . . . . . . . . . . . lix What’s new in this document . . . . . . . . . . . . . . . . . . . . . . . . . . . . . . lxvii Document conventions . . . . . . . . . . . . . . . . . . . . . . . . . . . . . . . . . . . . lxx Text formatting . . . . . . . . . . . . . . . . . . . . . . . . . . . . . . . . . . . . . . .
Changing the database user password . . . . . . . . . . . . . . . . . . . 26 Supported open source software products. . . . . . . . . . . . . . . . . . . . 27 SAN feature-to-firmware requirements . . . . . . . . . . . . . . . . . . . . . . . 30 Chapter 2 Patches Installing a patch. . . . . . . . . . . . . . . . . . . . . . . . . . . . . . . . . . . . . . . . . 33 Uninstalling a patch . . . . . . . . . . . . . . . . . . . . . . . . . . . . . . . . . . . . . .
IP SNMP credentials . . . . . . . . . . . . . . . . . . . . . . . . . . . . . . . . . . . . . . 72 Adding SNMPv1 and SNMPv2c credentials . . . . . . . . . . . . . . . . 73 Adding SNMPv3 credentials . . . . . . . . . . . . . . . . . . . . . . . . . . . . 74 Editing SNMPv1 and SNMPv2c credentials. . . . . . . . . . . . . . . . 75 Editing SNMPv3 credentials . . . . . . . . . . . . . . . . . . . . . . . . . . . . 76 Reordering SNMP credentials in the list . . . . . . . . . . . . . . . . . .
Rediscovering a host to active discovery . . . . . . . . . . . . . . . . .128 Rediscovering a previously discovered host . . . . . . . . . . . . . .128 Deleting a host from discovery . . . . . . . . . . . . . . . . . . . . . . . . .128 Viewing the host discovery state. . . . . . . . . . . . . . . . . . . . . . . .129 Troubleshooting host discovery. . . . . . . . . . . . . . . . . . . . . . . . .130 VM Manager discovery . . . . . . . . . . . . . . . . . . . . . . . . . . . . . . . . . . .
SAN display settings . . . . . . . . . . . . . . . . . . . . . . . . . . . . . . . . . . . . .168 Importing OUI and editing product type mapping . . . . . . . . . .169 Importing the OUI file. . . . . . . . . . . . . . . . . . . . . . . . . . . . . . . . .170 Editing the product type . . . . . . . . . . . . . . . . . . . . . . . . . . . . . .170 SAN End node display . . . . . . . . . . . . . . . . . . . . . . . . . . . . . . . . . . . . 171 SAN Ethernet loss events . . . . . . . . . . . . . . . . . . . . . .
Accepting changes for a switch, access gateway, or phantom domain . . . . . . . . . . . . . . . . . . . . . . . . . . . . . . . . . .228 Chapter 6 User Account Management Users overview . . . . . . . . . . . . . . . . . . . . . . . . . . . . . . . . . . . . . . . . .229 Viewing configured users . . . . . . . . . . . . . . . . . . . . . . . . . . . . .229 User accounts . . . . . . . . . . . . . . . . . . . . . . . . . . . . . . . . . . . . . . . . . .233 Editing a user account. . . . . . . . . . . . . . .
General dashboard functions . . . . . . . . . . . . . . . . . . . . . . . . . .260 Accessing a dashboard . . . . . . . . . . . . . . . . . . . . . . . . . . . . . . .261 Dashboard customization. . . . . . . . . . . . . . . . . . . . . . . . . . . . . . . . .261 Setting the time interval . . . . . . . . . . . . . . . . . . . . . . . . . . . . . .263 Configuring the dashboard display . . . . . . . . . . . . . . . . . . . . . .263 Default dashboards . . . . . . . . . . . . . . . . . . . . . . . . . . . . . . .
Deleting a user-defined network scope . . . . . . . . . . . . . . . . . .377 Setting the time scope. . . . . . . . . . . . . . . . . . . . . . . . . . . . . . . .377 Dashboard playback . . . . . . . . . . . . . . . . . . . . . . . . . . . . . . . . .378 Default dashboards . . . . . . . . . . . . . . . . . . . . . . . . . . . . . . . . . . . . .380 SAN Ports Health . . . . . . . . . . . . . . . . . . . . . . . . . . . . . . . . . . . .380 IP Port Health . . . . . . . . . . . . . . . . . . . . . . . . . . . .
Top or bottom product performance monitors. . . . . . . . . . . . .436 Top or bottom port performance monitors. . . . . . . . . . . . . . . .437 Distribution performance monitors . . . . . . . . . . . . . . . . . . . . .438 Time series performance monitors. . . . . . . . . . . . . . . . . . . . . .440 Top sFlows performance monitors . . . . . . . . . . . . . . . . . . . . . .441 Configuring a user-defined product performance monitor . . .441 Adding targets to a user-defined performance monitor . . . . .
SAN product status icons . . . . . . . . . . . . . . . . . . . . . . . . . . . . .485 IP product status icons . . . . . . . . . . . . . . . . . . . . . . . . . . . . . . .485 Event icons . . . . . . . . . . . . . . . . . . . . . . . . . . . . . . . . . . . . . . . . .486 Customizing the main window . . . . . . . . . . . . . . . . . . . . . . . . . . . . .486 Showing levels of detail on the Connectivity Map . . . . . . . . . .487 Exporting the topology . . . . . . . . . . . . . . . . . . . . . . . . . . . .
Customizing the Topology Map . . . . . . . . . . . . . . . . . . . . . . . . .529 Adding a background image to a map . . . . . . . . . . . . . . . . . . .530 Deleting a background image from the library . . . . . . . . . . . .531 Exporting the topology . . . . . . . . . . . . . . . . . . . . . . . . . . . . . . . .531 Printing a map . . . . . . . . . . . . . . . . . . . . . . . . . . . . . . . . . . . . . .532 Port actions . . . . . . . . . . . . . . . . . . . . . . . . . . . . . . . . . . . . . . . . . . .
Assigning an event filter to a device . . . . . . . . . . . . . . . . . . . . . . . .567 Overwriting an assigned event filter . . . . . . . . . . . . . . . . . . . . . . . .568 Removing all event filter from a Call Home center . . . . . . . . . . . . .568 Removing an event filter from a device . . . . . . . . . . . . . . . . . . . . . .569 Removing an event filter from the Call Home Event Filters list . . .569 Searching for an assigned event filter . . . . . . . . . . . . . . . . . . . . . .
AAA Settings tab . . . . . . . . . . . . . . . . . . . . . . . . . . . . . . . . . . . . . . . .590 Configuring Radius server authentication . . . . . . . . . . . . . . . .590 Configuring LDAP server authentication . . . . . . . . . . . . . . . . .593 Configuring TACACS+ server authentication . . . . . . . . . . . . . .596 Configuring Common Access Card authentication . . . . . . . . .599 Configuring switch authentication . . . . . . . . . . . . . . . . . . . . . .601 Configuring Windows authentication . .
Keeping a copy past the defined age limit. . . . . . . . . . . . . . . .647 Tracking changes from the baseline configuration . . . . . . . . .648 Replicating configurations. . . . . . . . . . . . . . . . . . . . . . . . . . . . .649 Replicating security configurations. . . . . . . . . . . . . . . . . . . . . .653 Enhanced group management. . . . . . . . . . . . . . . . . . . . . . . . . . . . .656 Firmware management. . . . . . . . . . . . . . . . . . . . . . . . . . . . . . . . . . .
Management application support for AD-enabled fabrics . . .700 Port Auto Disable. . . . . . . . . . . . . . . . . . . . . . . . . . . . . . . . . . . . . . . .701 Configuring Port Auto Disable event triggers . . . . . . . . . . . . . .703 Enabling Port Auto Disable on individual ports . . . . . . . . . . . .704 Enabling Port Auto Disable on all ports on a device . . . . . . . .705 Disabling Port Auto Disable on individual ports. . . . . . . . . . . .705 Disabling Port Auto Disable on all ports on a device.
Port groups . . . . . . . . . . . . . . . . . . . . . . . . . . . . . . . . . . . . . . . . . . . .727 View management . . . . . . . . . . . . . . . . . . . . . . . . . . . . . . . . . . . . . .728 Wireless device properties . . . . . . . . . . . . . . . . . . . . . . . . . . . . . . . .728 Element Manager . . . . . . . . . . . . . . . . . . . . . . . . . . . . . . . . . . . . . . .729 Launching the Element Manager . . . . . . . . . . . . . . . . . . . . . . .729 Launching a Telnet session. . . . . . . . .
Alert notifications. . . . . . . . . . . . . . . . . . . . . . . . . . . . . . . . . . . .754 Resource monitoring . . . . . . . . . . . . . . . . . . . . . . . . . . . . . . . . .754 SFP parameter monitoring . . . . . . . . . . . . . . . . . . . . . . . . . . . .755 Security monitoring . . . . . . . . . . . . . . . . . . . . . . . . . . . . . . . . . .755 Port statistics monitoring . . . . . . . . . . . . . . . . . . . . . . . . . . . . .755 Interface error types . . . . . . . . . . . . . . . . . . . . . .
Chapter 20 Fibre Channel over Ethernet FCoE overview . . . . . . . . . . . . . . . . . . . . . . . . . . . . . . . . . . . . . . . . . .795 DCBX protocol . . . . . . . . . . . . . . . . . . . . . . . . . . . . . . . . . . . . . .796 Enhanced Ethernet features . . . . . . . . . . . . . . . . . . . . . . . . . . . . . .796 Enhanced Transmission Selection . . . . . . . . . . . . . . . . . . . . . .796 Priority-based flow control . . . . . . . . . . . . . . . . . . . . . . . . . . . . .
Configuring LLDP for FCoE . . . . . . . . . . . . . . . . . . . . . . . . . . . .829 Adding an LLDP profile . . . . . . . . . . . . . . . . . . . . . . . . . . . . . . .830 Editing an LLDP profile . . . . . . . . . . . . . . . . . . . . . . . . . . . . . . .831 Deleting an LLDP profile . . . . . . . . . . . . . . . . . . . . . . . . . . . . . .831 Assigning an LLDP profile to a port or ports in a LAG . . . . . . .832 802.1x authentication . . . . . . . . . . . . . . . . . . . . . . . . . . . . . . . . . . .
Viewing ACL counters. . . . . . . . . . . . . . . . . . . . . . . . . . . . . . . . .873 Chapter 22 Security Management Security overview . . . . . . . . . . . . . . . . . . . . . . . . . . . . . . . . . . . . . . .875 Layer 2 access control list management. . . . . . . . . . . . . . . . . . . . .875 IronWare Layer 2 ACL configuration . . . . . . . . . . . . . . . . . . . . . 876 Fabric OS Layer 2 ACL configuration . . . . . . . . . . . . . . . . . . . .
Fibre Channel routing overview . . . . . . . . . . . . . . . . . . . . . . . . . . . .952 Guidelines for setting up Fibre Channel routing . . . . . . . . . . . . . . .953 Connecting edge fabrics to a backbone fabric . . . . . . . . . . . . . . . .954 Configuring routing domain IDs . . . . . . . . . . . . . . . . . . . . . . . . . . . .956 Chapter 24 Virtual Fabrics Virtual Fabrics overview . . . . . . . . . . . . . . . . . . . . . . . . . . . . . . . . . .957 Virtual Fabrics requirements . . . . . . . . .
Submitting the CSR to a certificate authority . . . . . . . . . . . . .996 KAC certificate registration expiry. . . . . . . . . . . . . . . . . . . . . . .996 Importing the signed KAC certificate . . . . . . . . . . . . . . . . . . . .997 Uploading the CA certificate onto the DPM appliance (and first-time configurations). . . . . . . . . . . . . . . . . . . . . . . . . .997 Uploading the KAC certificate onto the DPM appliance (manual identity enrollment). . . . . . . . . . . . . . . . . . . . . . . . . . .
Importing the Fabric OS encryption node KAC certificates to TKLM. . . . . . . . . . . . . . . . . . . . . . . . . . . . . . . . 1023 Exporting the TKLM self-signed server certificate. . . . . . . . .1024 Importing the TKLM certificate into the group leader . . . . . .1024 Steps for connecting to a KMIP-compliant SafeNet KeySecure. 1025 Setting FIPS compliance . . . . . . . . . . . . . . . . . . . . . . . . . . . . 1026 Creating a local CA. . . . . . . . . . . . . . . . . . . . . . . . . . . . . . . . . .
Metadata requirements and remote replication . . . . . . . . . .1110 Adding target tape LUNs for encryption. . . . . . . . . . . . . . . . . . . . 1111 Moving targets. . . . . . . . . . . . . . . . . . . . . . . . . . . . . . . . . . . . . . . . .1114 Configuring encrypted tape storage in a multi-path environment. . . . . . . . . . . . . . . . . . . . . . . . . . . . . . . . . . . . . . . . . . .1114 Tape LUN write early and read ahead . . . . . . . . . . . . . . . . . . . . .
Enabling and disabling the encryption engine state from Properties . . . . . . . . . . . . . . . . . . . . . . . . . . . . . . . . . . . 1149 Viewing and editing encryption group properties . . . . . . . . . . . . 1149 General tab . . . . . . . . . . . . . . . . . . . . . . . . . . . . . . . . . . . . . . 1150 Members tab . . . . . . . . . . . . . . . . . . . . . . . . . . . . . . . . . . . . . 1154 Security tab . . . . . . . . . . . . . . . . . . . . . . . . . . . . . . . . . . . . . .
Creating a common active zone configuration in two fabrics . . . . . . . . . . . . . . . . . . . . . . . . . . . . . . . . . . . . . . . . . . . 1190 Saving a zone database to a switch . . . . . . . . . . . . . . . . . . . .1191 Exporting an offline zone database . . . . . . . . . . . . . . . . . . . .1191 Importing an offline zone database . . . . . . . . . . . . . . . . . . . 1192 Rolling back changes to the offline zone database . . . . . . 1192 LSAN zones . . . . . . . . . . . . . . . . . . . . . . . .
FCIP tunnel restrictions for FCP and FICON emulation features . . . . . . . . . . . . . . . . . . . . . . . . . . . . . . . . . . . . . . . . . FCIP Trunk configuration considerations . . . . . . . . . . . . . . . FCIP circuit failover capabilities . . . . . . . . . . . . . . . . . . . . . . Bandwidth calculation during failover . . . . . . . . . . . . . . . . . Circuit Failover Grouping . . . . . . . . . . . . . . . . . . . . . . . . . . . . 1219 1219 1219 1220 1222 Adaptive Rate Limiting . . . . . . . .
Deleting FCIP Circuits . . . . . . . . . . . . . . . . . . . . . . . . . . . . . . . . . . 1262 Displaying FCIP performance graphs. . . . . . . . . . . . . . . . . . . . . . 1263 Displaying performance graphs for FC ports . . . . . . . . . . . . 1263 Displaying FCIP performance graphs for Ethernet ports. . . 1263 Displaying tunnel properties from the FCIP tunnels dialog box . 1264 Displaying FCIP circuit properties from the FCIP tunnels dialog box. . . . . . . . . . . . . . . . . . . . . . . . . . . . . . .
Editing a State Change threshold . . . . . . . . . . . . . . . . . . . . Finding assigned thresholds . . . . . . . . . . . . . . . . . . . . . . . . . Viewing thresholds. . . . . . . . . . . . . . . . . . . . . . . . . . . . . . . . . Viewing all thresholds on a specific Fabric OS device. . . . . 1295 1296 1296 1297 Removing thresholds . . . . . . . . . . . . . . . . . . . . . . . . . . . . . . . . . . 1297 Removing thresholds from the thresholds table . . . . . . . . .
Configuring VLAN . . . . . . . . . . . . . . . . . . . . . . . . . . . . . . . . . . 1339 Resetting port counters . . . . . . . . . . . . . . . . . . . . . . . . . . . . . 1339 Enable or Disable. . . . . . . . . . . . . . . . . . . . . . . . . . . . . . . . . . 1340 Management Module switchover. . . . . . . . . . . . . . . . . . . . . . . . . 1340 Switch Fabric Module . . . . . . . . . . . . . . . . . . . . . . . . . . . . . . . . . . .1341 Port mirroring. . . . . . . . . . . . . . . . . . . . . . . . . . .
Chapter 34 CLI Configuration Management CLI configuration overview . . . . . . . . . . . . . . . . . . . . . . . . . . . . . . 1395 Viewing existing templates . . . . . . . . . . . . . . . . . . . . . . . . . . . . . . 1396 Product configuration templates . . . . . . . . . . . . . . . . . . . . . . . . . .1397 Changing product credentials . . . . . . . . . . . . . . . . . . . . . . . . . . . 1402 Importing parameter values into a configuration . . . . . . . . . . . . 1403 Previewing CLI commands . . . . .
Deploying software images to products . . . . . . . . . . . . . . . . .1431 Deleting software images from the Management application1431 Unified image management . . . . . . . . . . . . . . . . . . . . . . . . . . . . . 1432 Viewing the list of unified images . . . . . . . . . . . . . . . . . . . . . 1432 Importing unified images into the Management application1433 Updating unified images . . . . . . . . . . . . . . . . . . . . . . . . . . . . 1435 Deploying unified images to products . . . . . . . . . . .
Adding an LSP path . . . . . . . . . . . . . . . . . . . . . . . . . . . . . . . . .1473 Editing an LSP path . . . . . . . . . . . . . . . . . . . . . . . . . . . . . . . . . 1474 Duplicating an LSP path . . . . . . . . . . . . . . . . . . . . . . . . . . . . .1475 Deleting an LSP path . . . . . . . . . . . . . . . . . . . . . . . . . . . . . . . .1475 Configuring advanced RSVP LSP settings . . . . . . . . . . . . . . .1476 Editing an RSVP LSP . . . . . . . . . . . . . . . . . . . . . . . . . . . . . . .
Checking the connectivity status of remote MEPs . . . . . . . Sending a loopback message . . . . . . . . . . . . . . . . . . . . . . . . Sending a linktrace message . . . . . . . . . . . . . . . . . . . . . . . . Configuring frame delay . . . . . . . . . . . . . . . . . . . . . . . . . . . . Chapter 38 1529 1530 1531 1533 VIP Servers VIP Servers overview. . . . . . . . . . . . . . . . . . . . . . . . . . . . . . . . . . . 1535 Viewing the VIP Servers . . . . . . . . . . . . . . . . . . . . . . . . . . .
Chaining SSL certificates . . . . . . . . . . . . . . . . . . . . . . . . . . . . . . . .1577 Deleting SSL certificates . . . . . . . . . . . . . . . . . . . . . . . . . . . . . . . 1579 Chapter 41 Deployment Manager Introduction to the Deployment Manager . . . . . . . . . . . . . . . . . . 1581 Editing a deployment configuration . . . . . . . . . . . . . . . . . . . . . . . 1581 Duplicating a deployment configuration . . . . . . . . . . . . . . . . . . . 1582 Deleting a deployment configuration. . . . .
Displaying end-to-end monitor pairs in a historical graph. . 1626 Refreshing end-to-end monitor pairs . . . . . . . . . . . . . . . . . . .1627 Deleting an end-to-end monitor pair. . . . . . . . . . . . . . . . . . . 1628 SAN Top Talker monitoring . . . . . . . . . . . . . . . . . . . . . . . . . . . . . . 1628 Configuring a fabric mode Top Talker monitor . . . . . . . . . . . 1629 Configuring an F_Port mode Top Talker monitor . . . . . . . . . .1631 Deleting a Top Talker monitor . . . . . . . . . . . . . .
Deleting a historical data collector . . . . . . . . . . . . . . . . . . . . Adding, editing, or duplicating a user-defined expression . Deleting an expression . . . . . . . . . . . . . . . . . . . . . . . . . . . . . Viewing Historical Graphs/Tables . . . . . . . . . . . . . . . . . . . . . Mouse functions for graphs . . . . . . . . . . . . . . . . . . . . . . . . . 1673 1673 1675 1675 1680 MIB data collectors . . . . . . . . . . . . . . . . . . . . . . . . . . . . . . . . . . . . .
Monitoring flows. . . . . . . . . . . . . . . . . . . . . . . . . . . . . . . . . . . .1733 Resetting flow statistics. . . . . . . . . . . . . . . . . . . . . . . . . . . . . .1735 Activating flows. . . . . . . . . . . . . . . . . . . . . . . . . . . . . . . . . . . . .1736 Deactivating flows . . . . . . . . . . . . . . . . . . . . . . . . . . . . . . . . . .1736 Deleting flows. . . . . . . . . . . . . . . . . . . . . . . . . . . . . . . . . . . . . .1736 Flow Monitor . . . . . . . . . . . . . . . . . . . .
Chapter 46 Power Center Power center overview . . . . . . . . . . . . . . . . . . . . . . . . . . . . . . . . . 1829 Data monitoring. . . . . . . . . . . . . . . . . . . . . . . . . . . . . . . . . . . . . . . Viewing PoE data for ports . . . . . . . . . . . . . . . . . . . . . . . . . . Filtering port details. . . . . . . . . . . . . . . . . . . . . . . . . . . . . . . . Viewing attached device properties . . . . . . . . . . . . . . . . . . . Viewing PoE charts. . . . . . . . . . . . . . . . . . . . . . .
Duplicating a configuration rule . . . . . . . . . . . . . . . . . . . . . . 1887 Editing a configuration rule . . . . . . . . . . . . . . . . . . . . . . . . . . 1887 Exporting a configuration rule. . . . . . . . . . . . . . . . . . . . . . . . 1888 Importing a configuration rule . . . . . . . . . . . . . . . . . . . . . . . 1888 Deleting a configuration rule. . . . . . . . . . . . . . . . . . . . . . . . . 1889 Viewing predefined configuration conditions. . . . . . . . . . . .
Creating an event action definition. . . . . . . . . . . . . . . . . . . . Creating a new event action definition by copying an existing definition . . . . . . . . . . . . . . . . . . . . . . . . . . . . . . . . . Modifying an event action definition . . . . . . . . . . . . . . . . . . Deleting an event action definition . . . . . . . . . . . . . . . . . . . Configuring event actions for Snort messages . . . . . . . . . . 1932 1945 1946 1946 1946 Pseudo events . . . . . . . . . . . . . . . . . . . . . . .
Chapter 49 Packet Capture (Pcap) Configuring packet captures . . . . . . . . . . . . . . . . . . . . . . . . . . . . 1981 Chapter 50 Monitoring and Alerting Policy Suite Monitoring and Alerting Policy Suite overview . . . . . . . . . . . . . . 1983 MAPS role-based access control. . . . . . . . . . . . . . . . . . . . . . 1984 Enabling MAPS on a device. . . . . . . . . . . . . . . . . . . . . . . . . . 1985 MAPS interoperability with other features. . . . . . . . . . . . . . . . . . 1986 Fabric Watch. . .
Creating multiple groups . . . . . . . . . . . . . . . . . . . . . . . . . . . . 2029 Editing multiple groups . . . . . . . . . . . . . . . . . . . . . . . . . . . . . 2029 Deleting a group. . . . . . . . . . . . . . . . . . . . . . . . . . . . . . . . . . . 2030 MAPS violations. . . . . . . . . . . . . . . . . . . . . . . . . . . . . . . . . . . . . . . 2031 MAPS events . . . . . . . . . . . . . . . . . . . . . . . . . . . . . . . . . . . . . . . . . 2033 Viewing MAPS events. . . . . . . . . . . . . . . .
Exporting IP reports to e-mail recipients . . . . . . . . . . . . . . . . . . . 2067 IP Wired Products report . . . . . . . . . . . . . . . . . . . . . . . . . . . . 2068 Detailed Product Report . . . . . . . . . . . . . . . . . . . . . . . . . . . . 2069 Detailed Cluster Report . . . . . . . . . . . . . . . . . . . . . . . . . . . . . 2073 AP Products report . . . . . . . . . . . . . . . . . . . . . . . . . . . . . . . . . .2076 Module List report . . . . . . . . . . . . . . . . . . . . . . . . . . . . . .
Security events for FC devices . . . . . . . . . . . . . . . . . . . . . . . .2145 Security events for IP devices . . . . . . . . . . . . . . . . . . . . . . . . .2145 User action events . . . . . . . . . . . . . . . . . . . . . . . . . . . . . . . . . . . . .2146 Management server events . . . . . . . . . . . . . . . . . . . . . . . . . . . . . .2146 Product events. . . . . . . . . . . . . . . . . . . . . . . . . . . . . . . . . . . . . . . . .2147 IP Performance monitoring events. . . . . . . . . . . . .
Master Log and Switch Console troubleshooting . . . . . . . . . . . . .2247 Names troubleshooting . . . . . . . . . . . . . . . . . . . . . . . . . . . . . . . . .2247 Patch troubleshooting. . . . . . . . . . . . . . . . . . . . . . . . . . . . . . . . . . 2248 Performance troubleshooting. . . . . . . . . . . . . . . . . . . . . . . . . . . . 2249 Port Fencing troubleshooting . . . . . . . . . . . . . . . . . . . . . . . . . . . . 2253 Professional edition login troubleshooting . . . . . . . . . . . . . . .
DEV_PORT_GIGE_PORT_LINK_INFO. . . . . . . . . . . . . . . . . . . .2518 DEV_PORT_MAC_ADDR_MAP_INFO . . . . . . . . . . . . . . . . . . . .2518 ISL_CONNECTION_INFO . . . . . . . . . . . . . . . . . . . . . . . . . . . . .2519 ISL_INFO . . . . . . . . . . . . . . . . . . . . . . . . . . . . . . . . . . . . . . . . . .2519 ETHERNET_ISL_INFO . . . . . . . . . . . . . . . . . . . . . . . . . . . . . . . 2520 EVENT_DETAILS_INFO . . . . . . . . . . . . . . . . . . . . . . . . . . . . . . 2521 EVENT_INFO . . . . .
SWITCH_DETAILS_INFO . . . . . . . . . . . . . . . . . . . . . . . . . . . . . 2570 SWITCH_DISCOVERED_MAC_INFO . . . . . . . . . . . . . . . . . . . . 2572 SWITCH_PORT_INFO . . . . . . . . . . . . . . . . . . . . . . . . . . . . . . . 2572 SWITCH_SNMP_INFO. . . . . . . . . . . . . . . . . . . . . . . . . . . . . . . .2574 TIME_SERIES_DATA_INFO . . . . . . . . . . . . . . . . . . . . . . . . . . . .2576 TIME_SERIES_DATA_VIEW. . . . . . . . . . . . . . . . . . . . . . . . . . . .2577 TRILL_INFO . . . . . . . .
About This Document In this chapter • How this document is organized . . . . . . . . . . . . . . . . . . . . . . . . . . . . . . . . . . lvii • Supported hardware and software. . . . . . . . . . . . . . . . . . . . . . . . . . . . . . . . . lix • What’s new in this document . . . . . . . . . . . . . . . . . . . . . . . . . . . . . . . . . . . . lxvii • Document conventions . . . . . . . . . . . . . . . . . . . . . . . . . . . . . . . . . . . . . . . . . . lxx • Additional information . . . . . . . . . . .
• Chapter 14, “SAN Device Configuration,” provides device configuration instructions. • Chapter 15, “Host Port Mapping,” provides instructions about how to create Hosts and assign the HBAs to them and import an externally created Host port mapping file (.CSV) to the Management application. • Chapter 16, “Storage Port Mapping,” provides instructions about how to create and assign properties to a storage device. • Chapter 17, “Wireless Management,” provides information about wireless devices.
• Chapter 41, “Deployment Manager,” provides information about how to view, deploy, and manage deployment configurations. • Chapter 42, “Fibre Channel Troubleshooting,” provides troubleshooting details for Fibre Channel devices. • Chapter 43, “Performance Data,” provides information on how to manage performance. • Chapter 44, “Flow Vision,” provides information on a network diagnostic tool that provides a unified platform to manage traffic-related applications on Fabric OS devices.
Fabric OS hardware and software support The following firmware platforms are supported by this release of Network Advisor 12.3.0: • Fabric OS 5.0 or later in a pure Fabric OS fabric • Fabric OS 6.0 or later in a mixed fabric NOTE Discovery of a Secure Fabric OS fabric in strict mode is not supported. The hardware platforms in Table 1 are supported by this release of Network Advisor 12.3.0.
TABLE 1 Fabric OS-supported hardware (Continued) Device name Terminology used in documentation Firmware level required Brocade AP7600 switch 4 Gbps 32-port Switch Fabric OS v6.1.0 or later Brocade 7800 switch 8 Gbps Extension Switch Fabric OS v6.3.0 or later Brocade 7840 switch 16 Gbps 24-FC port, 18 GbE port Switch Fabric OS v7.3.0 or later Brocade 8000 switch 8 Gbps 8-FC port, 10 GbE 24-DCB port Switch Fabric OS v6.1.
TABLE 1 Fabric OS-supported hardware (Continued) Device name Terminology used in documentation Firmware level required Brocade DCX-4S with FC8-16, FC8-32, and FC8-48 Blades 4-slot Backbone Chassis with 8 Gbps 16-FC port, 8 Gbps 32-FC port, and 8 Gbps 48-FC port blades Fabric OS v6.2.0 Brocade DCX-4S with FC8-64 Blades 4-slot Backbone Chassis with 8 Gbps 64-FC port blades Fabric OS v6.4.0 Brocade DCX-4S with FR4-18i Blades 4-slot Backbone Chassis with 4 Gbps Router, Extension blade Fabric OS v6.
• • • • • • BigIron 2.7.02e (sustaining mode) or later FastIron 7.2.0 or later NetIron 5.1.0 or later ServerIron (JetCore) 11.0 or later ServerIron ADX 12.2.0 or later TurboIron 4.2.0 or later For platform-specific firmware requirements, refer to Table 2. Table 2 lists the hardware platforms supported by this release of Network Advisor 12.3.0, the terminology used in the documentation, as well as any specific firmware requirements.
TABLE 2 IronWare-supported hardware (Continued) Device name lxiv Terminology used in documentation Firmware level required ICX 6610-24F Stackable switch 24 SFP ports Campus LAN Edge stackable switch FastIron 07.0.3 and later Hyper Edge stacking requires FastIron 8.0 or later ICX 6610-24P Stackable switch 24 PoE ports Campus LAN Edge stackable switch FastIron 07.0.3 and later Hyper Edge stacking requires FastIron 8.
TABLE 2 IronWare-supported hardware (Continued) Device name Terminology used in documentation Firmware level required ICX 7750-26Q switch 26 10/40 GbE QSFP+ ports FastIron 08.0.10 and later ICX 7750-48F switch 48 1/10 GbE SFP+ ports and six 10/40 GbE QSFP+ ports FastIron 08.0.10 and later ICX 7750-48C switch 48 1/10 GbE RJ-45 ports and six 10/40 GbE QSFP+ ports FastIron 08.0.
TABLE 2 IronWare-supported hardware (Continued) Device name Terminology used in documentation Firmware level required NetIron MLX (Supported regardless of license configuration) Ethernet router NetIron 5.0.0 or 5.0.1 NetIron MLXe (Supported regardless of license configuration) Ethernet Core router NetIron 5.0.0 or 5.0.1 NetIron XMR (Supported regardless of license configuration) Ethernet Backbone router NetIron 5.0.0 or 5.0.
TABLE 3 Network OS-supported hardware (Continued) Device name Terminology used in documentation Firmware level required Brocade VDX 6720-24 switch VDX 6720-24 switch 2.1 or later Brocade VDX 6720-60 switch VDX 6720-60 switch 2.1 or later Brocade VDX 6730-32 switch VDX 6730-32 switch 2.1 or later Brocade VDX 6730-76 switch VDX 6730-76 switch 2.1 or later Brocade VDX 6740 switch VDX 6740 switch 4.0 or later Brocade VDX 6740T switch VDX 6740T switch 4.
• Information that was changed: - Menu - SAN Device Property - FCIP lxviii Host port mapping overview IP Element Manager - Product group overview Host Port Mapping - Cascaded FICON fabric Group Management - Support for Brocade 7840 FICON - Defining filters Event action definitions Pseudo events Event logs Flow Vision - Fabric Binding overview Fault Management - Discovering fabrics Host Discovery Fabric Binding - Restoring a configurat
- Monitoring and Alerting Policy Suite - Configuring Virtual Fabrics VLAN Management - Product List SAN port icon SAN product status icons Virtual Fabrics - Application privileges and behavior View Management - Users overview Copying and pasting user preferences User Privileges - Device technical support User Account Management - AAA Settings tab Technical Support - Port Commissioning Server Management Console - Policy monitor
- Wireless devices Zoning Listing zone members Information that was deleted: • - Performance dashboard For further information about new features and documentation updates for this release, refer to the release notes. Document conventions This section describes text formatting conventions and important notice formats used in this document.
For definitions of SAN-specific terms, visit the Storage Networking Industry Association online dictionary at: http://www.snia.org/education/dictionary Notice to the reader This document may contain references to the trademarks of the following corporations. These trademarks are the properties of their respective companies and corporations. These references are made for informational purposes only.
Other industry resources For additional resource information, visit the Technical Committee T11 website. This website provides interface standards for high-performance and mass storage applications for Fibre Channel, storage management, and other applications: http://www.t11.org For information about the Fibre Channel industry, visit the Fibre Channel Industry Association website: http://www.fibrechannel.
• Brocade 5000—On the switch ID pull-out tab located on the bottom of the port side of the switch • Brocade 7600—On the bottom of the chassis • Brocade 48000—Inside the chassis next to the power supply bays • Brocade DCX and DCX-4S—On the bottom right on the port side of the chassis 4. World Wide Name (WWN) Use the licenseIdShow command to display the WWN of the chassis.
lxxiv Brocade Network Advisor SAN + IP User Manual 53-1003155-01
Chapter Getting Started 1 In this chapter • User interface components . . . . . . . . . . . . . . . . . . . . . . . . . . . . . . . . . . . . . . . 1 • Management server and client. . . . . . . . . . . . . . . . . . . . . . . . . . . . . . . . . . . . . 3 • Accessibility features for the Management application . . . . . . . . . . . . . . . . 17 • PostgreSQL database . . . . . . . . . . . . . . . . . . . . . . . . . . . . . . . . . . . . . . . . . . . 22 • Supported open source software products . . . . .
1 User interface components FIGURE 1 Main window 1. Menu bar — Lists commands you can perform on the Management application. The available commands vary depending on which tab (SAN, IP, or Dashboard) you select. For a list of available commands, refer to Appendix A, “Application menus”. 2. Toolbar — Provides buttons that enable quick access to dialog boxes and functions. The available buttons vary depending on which tab (SAN, IP, or Dashboard) you select.
Management server and client 1 Management server and client The Management application has two parts: the Server and the Client. The Server is installed on one machine and stores device-related information; it does not have a user interface. To view information through a user interface, you must log in to the Server through a Client. The Server and Clients may reside on the same machine, or on separate machines. If you are running Professional, the server and the client must be on the same machine.
1 Management server and client NOTE When you launch the Management application or navigate to a new view, the SAN tab displays with a gray screen over the Product List and Topology Map while data is loading. Launching a remote client NOTE For higher performance, use a 64-bit JRE. To launch a remote client, complete the following steps. 1. Open a web browser and enter the IP address of the Management application server in the Address bar.
Management server and client 1 The Management application displays. NOTE When you launch the Management application or navigate to a new view, the SAN tab displays with a gray screen over the Product List and Topology Map while data is loading. Clearing previous versions of the remote client The remote client link in the Start menu does not automatically upgrade when you upgrade the Management application. You must clear the previous version from the Java cache.
1 Management server and client FIGURE 3 Management application web client log in page 2. Enter your user name and password. NOTE Do not enter Domain\User_Name in the User ID field for LDAP server authentication. 3. Press Enter or click the log in arrow icon. 4. Click OK on the Login Banner. The Management application web client displays.
Management server and client 1 1. Choose one of the following options: • On Windows systems, select Start > Programs > Management_Application_Name 12.X.X > Management_Application_Name Configuration. • On UNIX systems, execute sh Install_Home/bin/configwizard on the terminal. 2. Click Next on the Welcome screen. 3. Click Yes on the confirmation message. 4. Complete the following steps on the FTP/SCP/SFTP Server screen. a.
1 Management server and client • • • • • Options dialog box (does not display all IP addresses) a. Select an address from the Server IP Configuration list. b. Select an address from the Switch - Server IP Configuration Preferred Address list.
Management server and client d. 1 Enter a port number in the Starting Port Number field (default is 24600). NOTE For Professional software, the server requires 15 consecutive free ports beginning with the starting port number. NOTE For Trial and Licensed software, the server requires 18 consecutive free ports beginning with the starting port number. e. Enter a port number in the Syslog Port Number field (default is 514).
1 Management server and client 11. Choose one of the following options: • If you configured authentication to CAC, enter your PIN in the CAC PIN field. • If you configured authentication to the local database, an external server (RADIUS, LDAP, or TACACS+) or a switch, enter your user name and password. The defaults are Administrator and password, respectively. NOTE Do not enter Domain\User_Name in the User ID field for LDAP server authentication. 12. Click Login. 13. Click OK on the Login Banner.
Management server and client 1 Disconnecting users To disconnect a user, complete the following steps. 1. Select Server > Active Sessions. The Active Sessions dialog box displays. 2. Select the user you want to disconnect and click Disconnect. 3. Click Yes on the confirmation message. The user you disconnected receives the following message: The Client has been disconnected by User_Name from IP_Address at Disconnected_Date_and_Time. 4. Click Close.
1 Management server and client TABLE 4 Server Properties Field/Component Description Java VM Vendor The Java Virtual Machine vendor. Java VM Version The Java Virtual Machine version running on the server. Server Name The server’s name. OS Architecture The operating system architecture on the server. OS Name The name of the operating system running on the server. OS Version The operating system version running on the server. Region The server’s geographical region.
Management server and client FIGURE 7 1 Port Status dialog box 2. Review the port status details: • Name — The Port name. Options include CIM Indication for Event Handling, CIM Indication for HCM Proxy, FTP, SCP/SFTP, sFlow, SNMP Trap, Syslog, TFTP, Web Server (HTTP), and Web Server (HTTPS). • Port # — The required port number. • Status — The status of the port. The status options are as follows: Success — The port is listening or bound to the server.
1 Management server and client • Transport — The transport type (TCP or UDP). • Description — A brief description of the port. • Communication Path — The “source” to “destination” vaules. Client and Server refer to the Management application client and server unless stated otherwise. Product refers to the Fabric OS, Network OS, or IronWare devices. • Open in Firewall — Whether the port needs to be open in the firewall.
Management server and client TABLE 5 1 Port usage and firewall requirements (Continued) Port Number Ports Transport Description Communication Path Open in Firewall 4431,2 HTTPS server TCP HTTPS (HTTP over SSL) server port if you use secure client server communication Client-Server Yes 4432 HTTPS (HTTP over SSL) server port if you use secure communication to the product Server–Product Yes 443 HTTPS (HTTP over SSL) server port if you use secure communication to the product and you do not u
1 Management server and client TABLE 5 Port usage and firewall requirements (Continued) Port Number Ports Transport Description Communication Path Open in Firewall 63432 sFlow UDP Receives sFlow data from products if you are monitoring with sFlow Product-Server Yes 246001,2 JNP (Java Naming Protocol) port TCP Use for service location. Uses SSL for privacy. Client–Server Yes 246011,2 EJB (Enterprise Java Bean) connection port TCP Client requests to server. Uses SSL for privacy.
Accessibility features for the Management application TABLE 5 1 Port usage and firewall requirements (Continued) Port Number Ports Transport Description Communication Path Open in Firewall 34568 HCM Agent discovery port TCP Used for HBA management via JSON Server - Managed Host Yes 555561 Launch in Context (LIC) client hand shaking port TCP Client port used to check if a Management application client opened using LIC is running on the same host Client No NOTE: If this port is in use, th
1 Accessibility features for the Management application TABLE 6 Keyboard shortcuts Menu Item or Function Keyboard Shortcut Internet Explorer SHIFT + F2 Master Log F5 FireFox SHIFT + F1 Paste CTRL + V Product List F9 Properties Alt-Enter Select All CTRL + A Show Ports F4 SSH Shift-F5 View Utilization CTRL + U Zoom In CTRL + NumPad+ Zoom Out CTRL + NumPad- Look and feel customization You can configure the Management application to mimic your system settings as well as define the
Accessibility features for the Management application 1 2. Select Look and Feel in the Category list. 3. Choose from one of the following options: • Select Default to configure the look and feel back to the Management application defaults. • Select System to configure the Management application to have the look and feel of your system. This changes the look and feel for the components that use ‘Java Metal Look and Feel’.
1 Product improvement Product improvement To improve its products, Brocade is collecting usage statistics from the field. If you agree to participate in the program, the Network Advisor server will transmit data back to the secure Brocade web server (HTTPS). The Brocade web server is hosted in a Brocade network.
Product improvement 1 Disabling product improvement data transfer You can disable feature usage data transfer from the Options dialog box once your system is up and running. To disable feature usage data transfer from the application, complete the following steps. 1. Select Server > Options. The Options dialog box displays. 2. Select Product Improvement in the Category list. 3. Select the No, thank you option. 4. Click OK to save your selection and close the Options dialog box.
1 PostgreSQL database 11. When the file is successfully created, the client changes the state of the data transfer to “Uploading” and transmits the data. The client transmits the data securely to the Brocade web server using the Apache HTTP Components third-party library. The client communicates with the Brocade web server using an authorization token. 12. When the transfer is complete, the client updates the Brocade web server database with the transfer status (success or failure).
PostgreSQL database 1 Connecting to the database using the ODBC client (Windows systems) The Open Database Connectivity (ODBC) driver enables you to configure the data source name (DSN) for the database. To install the ODBC driver and create a new data source, complete the following steps. 1. Double-click edb_psqlodbc.exe located on the DVD (DVD_Drive/Management_Application/odbc/Windows). 2.
1 PostgreSQL database 20. Click Save. 21. Click OK on the ODBC Data Source Administrator dialog box. 22. To export data, select Data > Import External Data > New Database Query and complete the steps in the Data Connection Wizard. Connecting to the database using the ODBC client (Linux systems) NOTE The ODBC driver is not supported on 64-bit Linux systems. You must have the Open Database Connectivity (ODBC) driver to allow remote clients to export data and generate reports.
PostgreSQL database 1 Adding the Datasourse on Linux systems Before you edit the INI files, make sure the PostgreSQL database is up and running. NOTE For RedHat and Oracle Enterprise systems, the odbc.ini and odbcinst.ini files are located in /etc. For SUSE systems, the odbc.ini and odbcinst.ini files are located in /etc/unixODBC. 1. Open the odbc.ini file in an editor and enter the datasource information as follows: [TestDB] Description = PostgreSQL 8.4 Driver = /opt/PostgreSQL/psqlODBC/lib/psqlodbcw.
1 PostgreSQL database 5. On the Set up user authentication screen, complete the following steps. a. Enter the database user name in the User name field. b. Select the Password required check box. c. Click Test Connection to test the connection. The Authentication Password dialog box displays. d. Enter the database password in the Password field and click OK. e. Click OK on the Connection Test dialog box.
Supported open source software products 1 If the new password and confirm password do not match, the following message displays: New password and confirm password do not match. Please try again. Press any key to continue. 3. Launch the Server Management Console. 4. Click the Services tab. 5. Click Stop to stop all services. 6. Click Close to close the Server Management Console. 7. Launch the Server Management Console. 8. Click Start to start all services.
1 Supported open source software products TABLE 9 28 Open source software third-party software products Open Source Software License Type ApacheCommonsNet 2.0 Apache License v2.0 ApacheCommonsPool 1.5.4 Apache License v2.0 ApacheCommonsValidator 1.3.1 Apache License v2.0 Apache Extras Companion for Apache log4j 1.1 Apache License v2.0 ApacheFTPServer 1.0.3 Apache License v2.0 Apache Log4j 1.2.16 Apache License v2.0 ASM 3.2 Custom License Axis 1.4 Apache License v2.
Supported open source software products TABLE 9 1 Open source software third-party software products Open Source Software License Type JCalendar 1.3.3 LGPL v2.1 JCommon 1.0.16 LGPL v2.1 JDOM 1.1.1 Apache Style JFreeChart 1.0.13 LGPL v2.1 JGoodiesForms 1.2.1 BSD JGoodiesLooks 2.2.2 BSD JGraph 5.13.0.1 BSD Style JIDE 2.10.1 JIDE Software License Jmesa 2.4.5 Apache JSON-RPCJava 1.0.1 Apache License v2.0 KajabityTools 0.1 Apache License v2.0 L2Fprod.comCommonComponents 7.
1 SAN feature-to-firmware requirements SAN feature-to-firmware requirements Use the following table to determine whether the Management application SAN features are only available with a specific version of the Fabric OS firmware as well as if there are specific licensing requirements. TABLE 10 SAN feature to firmware requirements Feature Fabric OS Access Gateway (AG) AG connected to Fabric OS devices requires firmware 5.2 or later. Call Home (Trial and Licensed version Only) Requires Fabric OS 5.
SAN feature-to-firmware requirements TABLE 10 1 SAN feature to firmware requirements Feature Fabric OS Port Fencing (Trial and Licensed version Only) Requires Fabric OS 6.2 or later. Requires Fabric OS 6.3 or later for State Change and C3 Discard Frames violation types. Security Management Requires Fabric OS 5.2 and later for SCC Policy. Requires Fabric OS 5.2 and later for DCC Policy. Requires Fabric OS 5.3 and later for IP Filter Policy. Requires Fabric OS 6.
1 32 SAN feature-to-firmware requirements Brocade Network Advisor SAN + IP User Manual 53-1003155-01
Chapter 2 Patches In this chapter • Installing a patch . . . . . . . . . . . . . . . . . . . . . . . . . . . . . . . . . . . . . . . . . . . . . . . 33 • Uninstalling a patch. . . . . . . . . . . . . . . . . . . . . . . . . . . . . . . . . . . . . . . . . . . . . 34 Installing a patch The patch installer enables you to update the Management application between releases. Each patch installer includes the previous patches within a specific release. For example, patch F (11.X.
2 Uninstalling a patch • Extracts patch files to the Install_Home folder. • Creates a back up (zip) of the original files to be updated and copies the zip file to the Install_Home\patch-backup directory (for example, Install_Home\patch-backup\na_11-3-0a.zip). The first time you apply a patch, the back up patch zip file uses the following naming convention: _-- .zip (for example, Install_Home\patch-backup\na_11-3-0a.zip).
Uninstalling a patch 2 6. Copy the artifact from the extracted folder to the source folder in the Install_Home/patch-backup directory. 7. Repeat step 5 and 6 for all artifacts listed in the restore.xml folder. 8. Go to the Install_Home/conf directory. 9. Open the version.properties file in a text editor. 10. Change the patch version (patch.version) value to the reverted patch (for example, if you are reverting from patch F to patch C then patch.version = c).
2 36 Uninstalling a patch Brocade Network Advisor SAN + IP User Manual 53-1003155-01
Chapter 3 Discovery In this chapter • SAN discovery overview. . . . . . . . . . . . . . . . . . . . . . . . . . . . . . . . . . . . . . . . . . 37 • DCB discovery . . . . . . . . . . . . . . . . . . . . . . . . . . . . . . . . . . . . . . . . . . . . . . . . . 48 • Viewing the fabric discovery state . . . . . . . . . . . . . . . . . . . . . . . . . . . . . . . . . 48 • Troubleshooting fabric discovery . . . . . . . . . . . . . . . . . . . . . . . . . . . . . . . . . . 49 • SAN Fabric monitoring. . . . .
3 SAN discovery overview For a Fabric OS fabric, the seed switch must be the primary Fabric Configuration Server (FCS). If you use a non-primary FCS to discover the fabric, the Management application displays an error and will not allow the discovery to proceed. If the Management application has already discovered the fabric, but afterward you create the FCS policy and the seed switch is not a primary FCS, an event is generated during the next poll.
SAN discovery overview 3 NOTE The Backbone Chassis can only discover and manage the backbone fabric. Backbone Chassis discovery requirements Table 11 details which Backbone Chassis models can be discovered by each version of the Management application and whether or not the model can be discovered as a seed switch or only as a member switch.
3 SAN discovery overview Discovering fabrics NOTE Fabric OS devices must be running Fabric OS 5.0 or later. NOTE Only one copy of the application should be used to monitor and manage the same devices in a subnet. NOTE When accessing additional data from the SAN Inventory or SAN Status widgets, it takes a few moments to populate newly discovered products in the SAN Products - Status dialog box (where Status is the section of the widget you selected).
SAN discovery overview FIGURE 9 3 Add Fabric Discovery dialog box (IP Address tab) 3. Enter a name for the fabric in the Fabric Name field. 4. Enter an IP address (IPv4 or IPv6) for a device in the IP Address field. To configure the preferred IP format for the Management application server to connect with Fabric OS devices, refer to “Configuring the preferred IP format” on page 216. If the product has both an IPv4 and IPv6 address, the Management server uses the preferred address.
3 SAN discovery overview For Virtual Fabric discovery device requirements, refer to “Virtual Fabrics requirements” on page 958. To discover a Virtual Fabric device, you must have the following permissions: • Switch user account with Chassis Admin role permission on the physical chassis. • Switch and SNMPv3 user account with access rights to all logical switches (all Fabric IDs (1 - 128). For information about configuring permissions on a Fabric OS device, refer to the Fabric OS Administrator’s Guide.: 5.
SAN discovery overview d. 3 Select the SNMP version from the SNMP Version list. • If you selected v1, continue with step e. • If you select v3, the SNMP tab displays the v3 required parameters. Go to step i. To discover a Fabric OS device (not virtual fabric-capable), you must provide the existing SNMPv3 username present in the switch. To discover a Virtual Fabric device, you must configure SNMPv3 and your SNMP v3 user account must be defined as a Fabric OS switch user.
3 SAN discovery overview Editing the password for multiple devices You can only edit password for Fabric OS devices in the same fabric. To edit the password for multiple devices within the same fabric, complete the following steps. 1. Select Discover > Fabrics. The Discover Fabrics dialog box displays. 2. Select multiple devices within the same fabric from the Discovered Fabrics table. 3. Click Edit. The Fabric_Name Edit Switches dialog box displays. FIGURE 11 Edit Switches dialog box 4.
SAN discovery overview 3 Configuring SNMP credentials 1. Select Discover > Fabrics. The Discover Fabrics dialog box displays. 2. Select an IP address from the Discovered Fabrics table. 3. Click Edit. The Add Fabric Discovery dialog box displays. 4. To revert to the default SNMPv3 settings, click the Automatic option. Go to step 19. 5. To manually configure SNMP, select the Manual option. Go to step 6. 6. Click the SNMP tab. FIGURE 12 7.
3 SAN discovery overview 16. Enter the authorization password in the Auth Password field. • If you selected Configure for 256-Port_Director_Name, go to step 19. • If you did not select Configure for 256-Port_Director_Name, continue with step 17. 17. Select the privacy protocol in the Priv Protocol field. 18. Enter the privacy password in the Priv Password field. 19. Click OK on the Add Fabric Discovery dialog box. If the seed switch is not partitioned, continue with step 20.
SAN discovery overview 3 Removing a fabric from active discovery If you decide you no longer want the Management application to discover and monitor a specific fabric, you can delete it from active discovery. Deleting a fabric also deletes the fabric data on the server (both system collected and user-defined data) except for user-assigned names for the device port, device node, and device enclosure information. To delete a fabric from active discovery, complete the following steps. 1.
3 DCB discovery DCB discovery You can discover DCB devices from both the SAN and IP tabs. The following sections details the differences between discovery from the SAN tab or the IP tab. DCB discovery from the SAN tab • You can discover DCB devices through fabric discovery. • If you discover a fabric that contains DCB devices on the SAN tab, the DCB devices display on the IP tab in the Network Objects, L2 Topology, IP Topology, and VLAN Topology views. Non-DCB devices do not display on the IP tab.
Troubleshooting fabric discovery 3 To view the discovery status of a device, complete the following steps. 1. Select Discover > Fabrics. The Discover Fabrics dialog box displays. 2. Right-click a fabric and select Expand All to show all devices in the fabric. The Name field displays the discovery status icons in front of the device name. The following table illustrates and describes the icons that indicate the current status of the discovered devices.
3 Troubleshooting fabric discovery Problem Resolution If you exceed your managed count limit, the Management application displays a “licensed exceeded” message on the topology. Perform one or more of the following actions to “Changing your network size” “Remove a device from active discovery” “Deleting a fabric” Changing your network size If you are at the maximum network size for your license, contact your preferred network provider. To change the size of your network, complete the following steps.
SAN Fabric monitoring 3 Virtual Fabric discovery troubleshooting The following section state possible issues and the recommended solutions for Virtual Fabric discovery errors. Problem Resolution At the time of discovery, the seed switch is Virtual Fabric-enabled; however, the user does not have Chassis Admin role for the seed switch. At the time of discovery, the user does not have the Chassis Admin role for all other switches in the fabric. After discovery, a device is upgraded to Fabric OS 6.
3 SAN Fabric monitoring Fabric monitoring enables discovery of and data collection for the specified fabric and all associated devices. The Management application enables you to view fabric monitoring status through the Discover Fabrics dialog box. The following table illustrates and describes the icons that indicate the current status of the discovered switches. TABLE 13 Icon Monitor Icons Description Displays when the switch is managed and the switch management status is okay.
SAN Fabric monitoring 3 To stop monitoring a fabric and all associated devices, complete the following steps. 1. Select Discovery > Fabrics. The Discover Fabrics dialog box displays. 2. Select the fabric you want to stop monitoring from the Discovered Fabrics table. 3. Click Unmonitor. 4. Click Close on the Discover Fabrics dialog box. Stop monitoring of discovered switches NOTE You cannot stop monitoring the seed switch.
3 SAN Fabric monitoring • If you unmonitor a DCB switch (discovered on the SAN tab), the DCB switch does not display on the SAN tab, but continues to display on the IP tab. To stop monitoring a switch, complete the following steps. 1. Select Discovery > Fabrics. The Discover Fabrics dialog box displays. 2. Select one or more switches in the same fabric that you want to stop monitoring from the Discovered Fabrics table. NOTE You cannot select switches in different fabrics. 3. Click Unmonitor.
SAN Seed switch 3 Resume monitoring of discovered switches NOTE Monitoring is not supported on Hosts. NOTE You can only monitor a switch that is reachable and has valid credentials. To monitor a switch, complete the following steps. 1. Select Discovery > Fabrics. The Discover Fabrics dialog box displays. 2. Select one or more switches that you want to monitor from the Discovered Fabrics table. 3. Click Monitor. The Monitor Status dialog box displays with the status. 4.
3 SAN Seed switch This operation preserves historical and configuration data, such as performance monitoring and user-customized data for the selected fabric. ATTENTION If the seed switch firmware is downgraded from Fabric OS 5.2.X to an earlier version, then all RBAC-related data is discarded from the Management application.
SAN Seed switch 3 • Identifies which switches are Virtual Fabric-enabled switches (Fabric OS only). If there are Virtual Fabric-enabled switches, the Management application only uses these switches as recommended seed switches. If there are no Virtual Fabric-enabled switches, continue with the next check. • Identifies which switches are Virtual Fabric-capable devices (Fabric OS only).
3 IP discovery overview IP discovery overview NOTE Discovery only displays products that are assigned to your area of responsibility (AOR). For more information about user accounts, refer to “Areas of responsibility” on page 243. NOTE You must have the Discover Setup - IP privilege to configure and run discovery. For more information about privileges, refer to “User Privileges” on page 2151.
IP discovery overview 3 Profile-based discovery uses the following steps to build a list of candidate IP addresses to probe. 1. Discovery runs one of the following programs: • On Windows systems, use ipconfig to find the default gateway. • On UNIX systems, use netstat -r -n to determine the "seed" routers and extract IP addresses from the program output. Discovery adds these IP addresses to the list of candidate IP addresses. 2.
3 IP discovery overview Rediscovery updates can occur using any of the following methods: • Lazy polling. • Adaptive discovery (triggered by snmp traps). • Manual rediscovery (refer to “IP Rediscovery” on page 135). Configuration requirements Before configuring discovery, obtain the following information: • SNMPv1 and SNMPv2c read-write community strings or SNMPv3 read-write credentials for the devices to be included in discovery.
IP discovery overview TABLE 15 3 Required MIB support for IronWare OS devices (Continued) IETF standard MIB name Required MIB object Data collected RFC 1213 MIB-II mib-2.system mib-2.interfaces.ifTable mib-2.ip.ipAddrTable From mib-2.interfaces.ifTable for interface level information: • ifName/ifDescr • ifAlias • ifType • ifMtu • ifSpeed • ifPhysAddress • ifAdminStatus • ifOperStatus • ifLastChange From mib-2.ip.ipAddrTable for IP subnet information: • ipAdEntAddr • ipAdEntNetMask From mib-2.ip.
3 IP discovery overview Table 16 provides a list of MIB support required for third-party devices. TABLE 16 Required MIB support for third-party devices IETF standard MIB name Required MIB object Data collected RFC 1213 MIB-II mib-2.system mib-2.interfaces.ifTable mib-2.ip.ipAddrTable From mib-2.interfaces.ifTable for interface level information: • ifName/ifDescr • ifAlias • ifType • ifMtu • ifSpeed • ifPhysAddress • ifAdminStatus • ifOperStatus • ifLastChange From mib-2.ip.
VDX/VCS discovery TABLE 16 3 Required MIB support for third-party devices (Continued) IETF standard MIB name Required MIB object Data collected RFC 4133 ENTITY-MIB entPhysicalTable entAliasMappingTable (if available) For module (line card) information: Entire entPhysicalTable Entire entAliasMappingTable, if available RFC 4293 IP-MIB mib2.ip.
3 VDX/VCS discovery VCS devices use the following to determine reachability: • Reachable — The VDX/VCS product is online and is accessible by ICMP, Netconf, and SNMP; therefore, it is reachable. • Degraded Link — The VDX/VCS product is not accessible by one of the following: ICMP, Netconf, or SNMP. • Not Reachable — The VDX/VCS product is offline and is not accessible by any of the following: ICMP, Netconf, and SNMP. The following sections detail the VDX/VCS discovery behavior.
VDX/VCS discovery 3 # # A sample entry: # 10:00:00:05:33:51:62:42 172.26.20.10 # # Changes to this file do not require restarting the management server. 3. Select File > Save. Standalone discovery • When you discover a VDX device that is not VCS-enabled, it displays as an individual L2 (DCB) device. • When you enable VCS mode on a discovered VDX device, after rediscovery the VDX displays as a VCS fabric. VCS fabric discovery NOTE Professional edition can only discover a VCS fabric with one member.
3 VDX/VCS discovery Seed switch failover The Management application uses the seed switch to discover other members in the VCS fabric. When you discover devices through individual discovery, the seed switch is the first member you discover in the VCS fabric. When you discover devices through profile discovery, the seed switch is the principal switch in the VCS fabric.
Logical chassis cluster mode discovery 3 Logical chassis cluster mode discovery Logical chassis cluster mode requires Network OS 4.0 or later and is one of two types of VCS modes. In logical chassis cluster mode, both the data and configuration paths are distributed. The entire cluster can be configured from the principal node.
3 Logical chassis cluster mode discovery • The State column in the Discover Setup - IP dialog shown in Figure 13 applies only to nodes that are in logical chassis mode. Possible states are: - Online—A node that is currently connected and operational. - Offline—A cluster member node that cannot be reached by the primary cluster node. - Rejoining—A node that is in the process of rejoining its cluster. - Replacing—A node that is being replaced.
Logical chassis cluster mode discovery FIGURE 14 3 Discover Setup - IP dialog box before removal of node Figure 15 shows the Discover Setup - IP dialog box after the administrator has removed the node with the IP address of 172.26.5.130 from its logical chassis cluster. FIGURE 15 Discover Setup - IP dialog box after disabling the node from logical chassis cluster Figure 16 shows the Discover Setup - IP dialog box after The Management application has performed rediscovery.
3 HyperEdge stack discovery NOTE All cluster-specific configurations are lost during a cluster-mode change. On refresh collection, the Management application detects the mode change and retains all database entries related to the cluster. HyperEdge stack discovery HyperEdge stacks must contain at least one ICX 6610 device and one ICX 6650 device and all stacking members must be running IronWare 8.0 or later (the exact same version). HyperEdge stacks support up to 8 units in stack.
Configuring IP profile discovery FIGURE 17 3 Discover Setup - IP dialog box 2. Click the Global Settings tab. a. To set SNMP credentials, refer to “IP SNMP credentials” on page 72. b. To configure default user names and passwords, refer to “Default IP user credentials” on page 78. c. To configure global setting preferences, refer to “Defining global setting preferences” on page 86. 3. Click the Profiles tab. a. To create a discovery profile, refer to “IP discovery profiles” on page 89. b.
3 Configuring IP simple discovery Configuring IP simple discovery NOTE The Discovered Products table lists all products discovered through individual product discovery, profile-based discovery, as well as Fabric discovery (from the SAN tab). NOTE DCB devices discovered through Fabric discovery (from the SAN tab) are automatically added to IP discovery during rediscovery. NOTE You must have the All IP Products AOR (area of responsibility) in your user account to discover new products.
IP SNMP credentials 3 Adding SNMPv1 and SNMPv2c credentials If SNMPv1 or SNMPv2c is enabled, or if you want to use community strings to gain access to the device, define community strings. To add a SNMPv1 or SNMPv2c read-write community string, complete the following steps. 1. Select Discover > IP Products. The Discover Setup - IP dialog box displays. 2. Click the Global Settings tab. 3. Click the SNMP tab. FIGURE 18 SNMPv1 or SNMPv2c credentials 4.
3 IP SNMP credentials Adding SNMPv3 credentials To add SNMPv3 read-write credentials, complete the following steps. 1. Select Discover > IP Products. The Discover Setup - IP dialog box displays. 2. Click the Global Settings tab. 3. Click the SNMP tab. FIGURE 19 SNMPv3 credentials 4. Enter a unique label to identify the credentials in the Display Label field of the Add/Edit SNMPv3 Read-Write Credentials area.
IP SNMP credentials 3 The password can be from 1 through 16 characters long, case sensitive, and allows all printable ASCII characters. The password displays as asterisks. 10. Click the right arrow button to add the SNMPv3 read-write credentials to the Selected SNMPv3 Read-Write Credentials list.
3 IP SNMP credentials NOTE If the Selected Read-Write Community Strings list does not contain write community strings, the auto registration fails for traps on IP products. 8. Click Apply to save your work. 9. Click Close to close the Discover Setup - IP dialog box. 10. Click Yes on the confirmation message. Editing SNMPv3 credentials To edit SNMPv3 read-write credentials, complete the following steps. 1. Select Discover > IP Products. The Discover Setup - IP dialog box displays. 2.
IP SNMP credentials 3 The password can be from 1 through 16 characters long, case sensitive, and allows all printable ASCII characters. The password display as asterisks. 11. Click the right arrow button to add the SNMPv3 read-write credentials to the Selected SNMPv3 Read-Write Credentials list.
3 Default IP user credentials • Select the SNMPv3 read-write credentials you want to delete in the Selected SNMPv3 Read-Write Credentials list and click the left arrow button. • Select the SNMPv1 or SNMPv2c read-write community string you want to delete in the Selected Read-Write Community Strings list and click the left arrow button. 5. Click Apply to save your work. 6. Click Close to close the Discover Setup - IP dialog box. 7. Click Yes on the confirmation message.
Default IP user credentials FIGURE 20 3 Default Passwords 4. Enter a login prompt user name and password by selecting Read/Write Login Prompt from the Credential Type list and completing the following steps. FIGURE 21 a. Read/Write Login Prompt Enter a unique label to identify the credentials in the Display Label field. This label can be from 1 through 200 characters long, case sensitive, and allows all printable ASCII characters. b. Enter the user name in the User ID field. c.
3 Default IP user credentials 5. Enter an enable prompt user name and password by selecting Read/Write Enable Prompt from the Credential Type list and completing the following steps. FIGURE 22 a. Read/Write Enable Prompt Enter a unique label to identify the credentials in the Display Label field. This label can be from 1 through 200 characters long, case sensitive, and allows all printable ASCII characters. b. Enter the user name in the User ID field. c.
Default IP user credentials 3 8. Click Close to close the Discover Setup - IP dialog box. 9. Click Yes on the confirmation message. Editing login prompt user credentials To edit a login prompt user name and password, complete the following steps. 1. Select Discover > IP Products. The Discover Setup - IP dialog box displays. 2. Click the Global Settings tab. 3. Click the Default Passwords tab. 4. Select Read/Write Login Prompt from the Credential Type list. 5.
3 Default IP user credentials 6. Edit the unique label to identify the credentials in the Display Label field. This label can be from 1 through 200 characters long, case sensitive, and allows all printable ASCII characters. 7. Edit the user name in the User ID field. 8. Edit the user password in the Password field. 9. Click the right arrow button. 10.
Default IP user credentials 3 Reordering user credentials in the list Discovery tries the user credentials in order until one set of credentials is found that works, so place the most common ones first. To rearrange the user credentials, complete the following steps. 1. Select Discover > IP Products. The Discover Setup - IP dialog box displays. 2. Click the Global Settings tab. 3. Click the Default Passwords tab. 4.
3 IP Object identifier filters IP Object identifier filters The object identifier (OID) filter allows you to select which product types to include or exclude from discovery. If you add a third-party product OID to the Included Product Types list during discovery and later move it to the Excluded Product Types list, note that you will not be able to discover a new device with that product OID.
IP Object identifier filters 3 5. In the top Add/Edit Product Types area, choose one of the following options: • Enter the device’s sysObjectID you want to include in the Product Type list. • Select an existing device sysObjectID from the Product Type list. Table 18 lists the default third party product types. TABLE 18 Default third-party product types Product sysObjectID Vendor .1.3.6.1.4.1.9. Cisco .1.3.6.1.4.1.4874. Juniper .1.3.6.1.4.1.2636.1. Juniper 6.
3 Defining global setting preferences Deleting product types from the list To delete an entry from the Included Product Types or Excluded Product Type list, complete the following steps. 1. Select Discover > IP Products. The Discover Setup - IP dialog box displays. 2. Click the Global Settings tab. 3. Click the OID Filter tab. 4. Select an entry from the Included Product Types or Excluded Product Type list and click the left arrow button. 5. Click Apply to save your work. 6.
Defining global setting preferences 3 5. Select one of the following Ping Type options: • ICMP Ping (default). Go to step 7. • TCP Ping. Continue with step 6. 6. Enter the TCP port number (from 1 through 65536) in the TCP Ping Port field. The default is 23. 7. Enter the number of times (from 0 through 10) to ping the device when ping is unsuccessful in the Ping Retries field. The default is 0. 8. Select the Enable lazy polling check box to periodically rediscover all devices in the database.
3 Configuring event-based collection Clear the check box to configure discovery to select the original IP address used to discover the device. 13. Select the Import SSL Certificate and Key check box to enable discovery to download and synchronize certificates from SSL capable Application products. 14. Choose one of the following options: • Select the Discard all old topology information for each product discovered option to delete all existing device topology data when running discovery.
IP discovery profiles 3 NOTE This settings cannot be disabled for DCB switches. NOTE Network OS devices must be running version 4.0 or later to enable this setting. NOTE For Network OS devices, adaptive discovery is also performed for Syslog events. The lazy polling function sends login and log messages to the Master Log and the switch console. If you are receiving too many messages due to lazy polling, clear the check box to disable off lazy polling.
3 IP discovery profiles NOTE DCB devices discovered through Fabric discovery (from the SAN tab) are automatically added to IP discovery during rediscovery. Configuring a discovery profile NOTE You cannot configure a discovery profile if you do not have the All IP Products AOR (area of responsibility) in your user account. NOTE DCB devices discovered through Fabric discovery (from the SAN tab) are automatically added to IP discovery during rediscovery.
IP discovery profiles 3 4. Click “new_profile” in the Profile Name field to enter a unique name for the profile. This name can be from 1 through 255 characters long, case sensitive, and allows all printable ASCII characters. 5. Click the Address Ranges tab to configure address ranges for the profile. For step-by-step instructions, refer to “Configuring address ranges” on page 92. 6. Click the Scheduling tab to configure a discovery schedule for the profile.
3 IP discovery profiles For step-by-step instructions, refer to “Configuring address ranges” on page 92 or “Editing address ranges” on page 96. 6. Click the Scheduling tab to configure a discovery schedule for the profile. For step-by-step instructions, refer to “Scheduling discovery” on page 98. 7. Click the Preferences tab to configure preferences for the profile. For step-by-step instructions, refer to “Configuring advanced discovery profile preferences” on page 104. 8. Click the Global Settings tab.
IP discovery profiles 3 • To exclude an address range using the CIDR subnet format, refer to “Excluding CIDR subnet addresses” on page 94. • To exclude an address range using the subnet format, refer to “Excluding subnet addresses” on page 95. • To exclude an address range using the address range format, refer to “Excluding IP addresses” on page 96. NOTE DCB products discovered through Fabric discovery (on the SAN tab) cannot be excluded.
3 IP discovery profiles 1. Select Subnet from the Entry Type list. FIGURE 28 Include Subnet 2. Enter the IP address in the IP Address field. 3. Enter the subnet mask in the Subnet Mask field. 4. To exclude an address range using the Subnet format, refer to “Excluding subnet addresses” on page 95. 5. To finish configuring the address ranges, return to “Configuring address ranges” on page 92. Adding IP addresses To add an IP address range (IPv4 and IPv6), complete the following steps. 1.
IP discovery profiles 3 1. Select CIDR Subnet from the Entry Type list. FIGURE 30 Exclude CIDR Subnet 2. Enter the IP address in the IP Address field. 3. Enter the subnet mask bits in the Subnet Mask Bits field. For IPv4, the subnet mask bits is between 0 and 32. For IPv6, the subnet mask bits is between 0 and 128. 4. To include an address range using the CIDR Subnet format, refer to “Adding CIDR subnet addresses” on page 93. 5.
3 IP discovery profiles Excluding IP addresses NOTE To exclude a VCS fabric, you must add all members of the VCS fabric to the exclude list. To exclude an IP address range (IPv4 and IPv6), complete the following steps. 1. Select IP Address from the Entry Type list. FIGURE 32 Exclude Address Range 2. Enter the first IP address in the range in the first IP Address field. 3. Enter the last IP address in the range in the second IP Address field. 4.
IP discovery profiles 3 • To edit the included addresses using the address range format, refer to “Editing IP addresses” on page 97. 7. Select the Also perform ping sweep check box to perform ping sweep on the address range. 8. To edit an excluded address range, select the address range you want to edit in the Excluded IP Addresses list. 9. Click the left arrow button to display the address range details in the bottom Add/Edit IP Addresses area. 10.
3 IP discovery profiles 1. Change the first IP address in the range in the first IP Address field. 2. Change the last IP address in the range in the second IP Address field. 3. To finish editing the address ranges, return to “Editing address ranges” on page 96. Scheduling discovery You can create multiple schedules (to a maximum of 32) for each profile.
IP discovery profiles 7. 3 Click Close to close the Discover Setup - IP dialog box. 8. Click Yes on the confirmation message. Configuring a one-time discovery schedule To configure a one-time discovery schedule, complete the following steps. 1. Select One Time from the Frequency list. FIGURE 34 Scheduling tab - One Time 2. Select the time of day you want discovery to run from the Time (hh:mm) lists.
3 IP discovery profiles 1. Select Daily from the Frequency list. FIGURE 36 Scheduling tab - Daily 2. Select the time of day you want discovery to run from the Time (hh:mm) lists. Where the hour value is from 1 through 12, the minute value is from 00 through 59, and the day or night value is AM or PM. 3. Click the right arrow button to add the schedule to the Scheduled Discovery Cycles list. 4. To finish configuring the discovery schedule, return to “Scheduling discovery” on page 98.
IP discovery profiles 3 1. Select Monthly from the Frequency list. FIGURE 38 Scheduling tab - Monthly 2. Select the time of day you want discovery to run from the Time (hh:mm) lists. Where the hour value is from 1 through 12, the minute value is from 00 through 59, and the day or night value is AM or PM. 3. Select the day you want discovery to run from the Day of the Month list (1 through 31). 4. Click the right arrow button to add the schedule to the Scheduled Discovery Cycles list. 5.
3 IP discovery profiles 3. Select the profile for which you want to suspend a discovery schedule in the Discovery Profiles table and click the Scheduling tab. 4. Select the schedule you want to suspend in the Scheduled Discovery Cycles list and click the left arrow button. 5. Click the Suspend check box and click the right arrow button to return the schedule to the Scheduled Discovery Cycles list. The suspended schedule displays at the bottom of the Scheduled Discovery Cycles list. 6.
IP discovery profiles 3 Editing a one-time discovery schedule To edit a one-time discovery schedule, complete the following steps. 1. Select the time of day you want discovery to run from the Time (hh:mm) lists. Where the hour value is from 1 through 12, the minute value is from 00 through 59, and the day or night value is AM or PM. 2. Click the Date list to select a date from the calendar. 3. Click the right arrow button to add the schedule to the Scheduled Discovery Cycles list. 4.
3 IP discovery profiles 1. Select the time of day you want discovery to run from the Time (hh:mm) lists. Where the hour value is from 1 through 12, the minute value is from 00 through 59, and the day or night value is AM or PM. 2. Select the day you want discovery to run from the Day of the Month list (1 through 31). 3. Click the right arrow button to add the schedule to the Scheduled Discovery Cycles list. 4. To finish editing the discovery schedule, return to “Editing a discovery schedule” on page 102.
IP discovery profiles FIGURE 40 3 Preferences tab 4. Enter the maximum number (from 1 through 100) of simultaneous connections to devices allowed by discovery in the Maximum Threads field. 5. Enter the name of the file that contains specific IP addresses to probe in the Discovery Address File field. The file supports both IPv4 and IPv6 addresses. This file must be located in the Install_Home\conf\discovery\ip folder on the server. The default file is the discovery_addrs.
3 IP discovery profiles Deleting a discovery profile You can delete any of the discovery profiles except the “Default” profile. To delete a discovery profile, complete the following steps. 1. Select Discover > IP Products. The Discover Setup - IP dialog box displays. 2. Click the Profiles tab. 3. Select the profile you want to delete in the Discovery Profiles table and click Delete. 4. Click Apply to save your changes. 5. Click Close to close the Discover Setup - IP dialog box. 6.
IP discovery profiles 3 3. Select the discovery profile on which you want to start discovery in the Discovery Profiles table and click Start. 4. Click Close to close the Discover Setup - IP dialog box. 5. Click Yes on the confirmation message. Starting discovery automatically To run discovery for a profile at startup, complete the following steps. 1. Select Discover > IP Products. The Discover Setup - IP dialog box displays. 2. Click the Profiles tab. 3.
3 IP discovery profiles • • • • Waiting — Discovery will start for this profile once the current profile discovery completes. Scheduled — Discovery will be run for this profile at the scheduled time. Idle — Discovery is not running. Terminating — Discovery for the profile is either completing or has been terminated. 4. Click Close to close the Discover Setup - IP dialog box. 5. Click Yes on the confirmation message.
Individual IP device discovery 3 Exporting discovery reports To export a report for a discovery profile, complete the following steps. 1. Select Discover > IP Products. The Discover Setup - IP dialog box displays. 2. Click the Profiles tab. 3. Select the discovery profile for which you want to export a report in the Discovery Profiles table and click Report. 4. Choose one of the following options: • To export the report to a .csv file, select Export > Export as CSV.
3 Individual IP device discovery Adding an IP device to discovery NOTE DCB devices discovered through Fabric discovery (from the SAN tab) are automatically added to IP discovery during rediscovery. NOTE You cannot discover new products if you do not have the All IP Products AOR (area of responsibility) in your user account. To add an individual IP device to discovery, complete the following steps. 1. Select Discover > IP Products. The Discover Setup - IP dialog box displays.
Individual IP device discovery 3 • Also try these settings — Select to use specific SNMP settings to contact the device. If you do not enter SNMP settings or if the settings do not authenticate on the device, the application uses the SNMP settings configured in the Global Settings tab to contact the device. NOTE You can configure both SNMPv3 and SNMPv1/SNMPv2c credentials at the same time; however, discovery tries the SNMPv3 credentials before trying the SNMPv1 and SNMPv2c credentials. 5.
3 Individual IP device discovery The password can be from 1 through 16 characters long, case sensitive, and allows all printable ASCII characters. The password display as asterisks. 6. Configure the SNMPv3 read only credentials by completing the following steps. a. Click the SNMPv3 Read Only tab. b. Enter the SNMPv3 user name in the User ID field. The user name can be from 1 through 16 characters long, case sensitive, and allows all printable ASCII characters. c.
Individual IP device discovery 3 NOTE If you do not enter a community string in the field, discovery uses the "public" and "private" community strings to probe the devices. 8. Configure the SNMPv1 and SNMPv2c read only credentials by completing the following steps. a. Click the SNMPv1/v2c Read Only tab. b. Enter the community string in the Community field. The community string can be from 1 through 16 characters long, case sensitive, and allows all printable ASCII characters.
3 Individual IP device discovery To edit one or more IP devices, complete the following steps. 1. Select Discover > IP Products. The Discover Setup - IP dialog box displays. 2. Select one or more IP devices you want to edit in the Discovered Products table. Select multiple devices by holding down the CTRL key and clicking more than one device. NOTE You cannot edit IronWare and Network OS devices at the same time.
Individual IP device discovery 3 The user name can be from 1 through 16 characters long, case sensitive, and allows all printable ASCII characters. c. Select one of the following protocols from the Authentication Protocol list: • None • HMAC_MD5 • HMAC_SHA d. Enter the SNMPv3 authentication password in the Authentication Password field. The password can be from 8 through 16 characters long, case sensitive, and allows all printable ASCII characters. The password display as asterisks. e.
3 Individual IP device discovery 7. Change the SNMPv1 and SNMPv2c read-write credentials by completing the following steps. a. Click the SNMPv1/v2c Read/Write. tab FIGURE 46 b. SNMPv1/v2c settings Enter the unique community string in the Community field. The community string can be from 1 through 16 characters long, case sensitive, and allows all printable ASCII characters. The string displays as asterisks.
Individual IP device discovery 3 The password can be from 1 through 200 characters long, case sensitive, and allows all printable ASCII characters. Not applicable to DCB devices. c. Change the unique user name in the Login Prompt User Name field. The user name can be from 1 through 200 characters long, case sensitive, and allows all printable ASCII characters. d. Change the password in the Login Prompt Password field.
3 Individual IP device discovery The password can be from 8 through 16 characters long, case sensitive, and allows all printable ASCII characters. The password display as asterisks. 11. Change the Read Only credentials by completing the following steps. NOTE These credentials are not applicable for DCB, VDX, or VCS devices. a. Click the Read Only Credentials tab. FIGURE 49 a. Read Only credentials Change the unique user name in the Login Prompt User Name field.
Host discovery 3 Deleting IP devices from discovery To delete one or more IP devices from discovery, complete the following steps. 1. Select Discover > IP Products. The Discover Setup - IP dialog box displays. 2. Select the IP devices you want to remove from discovery in the Discovered Products table. Select multiple devices by holding down the CTRL key and clicking more than one device. NOTE You cannot delete an active member from a VCS fabric. 3. Click Delete.
3 Host discovery 1. Import the host certificate when the Enable Certificate Validation check box is selected. Discovery will occur successfully even without importing the certificate when the Enable Certificate Validation checkbox is not selected. 2. Restarting the Server Management Console (SMC) is necessary whether the Enable Certificate Validation check box is selected or not. 3.
Host discovery FIGURE 51 3 Add Host Adapters dialog box 3. (Optional) Enter a discovery request name (such as, Manual 06/12/2009) in the Discovery Request Name field. 4. Select Network Address from the list. 5. Enter the IP address (IPv4 or IPv6 formats) or host name in the Network Address field. 6. Click Add. The IP address or host name of the Host displays in the Host List. 7.
3 Host discovery The HCM agent default is admin. Leave this field blank for the CIM server. 11. Enter your password in the Password field. The HCM agent default is password. Leave this field blank for the CIM server. 12. Repeat step 5 through step 11 for each Host you want to discover. 13. Click OK on the Add Host Adapters dialog box. If an error occurs, a message displays. Click OK to close the error message and fix the problem.
Host discovery 3 The CSV file must meet the following requirements: • Comma-separated IP addresses or host names • No commas within the values • No escaping supported For example, XX.XX.XXX.XXX, XX.XX.X.XXX, computername.company.com 6. Click Open. The CSV file is imported to the Add Host Adapters dialog box. During import, duplicate values are automatically dropped. When import is complete, the imported values display in the Host List. If the file cannot be imported, an error displays. 7.
3 Host discovery 2. Click Add. The Add Host Adapters dialog box displays. FIGURE 53 Add Host Adapters dialog box 3. Enter a discovery request name (such as MyFabric) in the Discovery Request Name field. 4. Select Hosts in Fabrics from the list. 5. Select All fabrics or an individual fabric from the host list. 6. Click Add. All hosts that are part of a managed fabric and have a registered host name display in the host list. If no host with a registered host name exists, an error message displays.
Host discovery 3 The HCM agent default is admin. Leave this field blank for the CIM server. 11. Enter your password in the Password field. The HCM agent default is password. Leave this field blank for the CIM server. 12. Click OK on the Add Host Adapters dialog box. If an error occurs, a message displays. Click OK to close the error message and fix the problem. A host group displays in the Discovered Hosts table of the Discover Host Adapters dialog box. The discovery status is updated dynamically. 13.
3 Host discovery 7. Configure Host credentials by choosing one of the following options: • To configure HCM agent credentials, select the HCM agent option. Go to step 9. • To configure CIM server credentials, select the CIM server (ESXi only) option. Continue with step 8. • To configure WMI server credentials, select the Windows Management Instrumentation (WMI) option. Continue with step 8. If you do not need to configure Host credentials, skip to step 12. 8.
Host discovery FIGURE 55 3 Edit Host Adapters dialog box 3. Configure Host credentials by choosing one of the following options: • To configure HCM agent credentials, select the HCM agent option. Go to step 5. • To configure CIM server credentials, select the CIM server (ESXi only) option. Continue with step 4. • To configure WMI server credentials, select the Windows Management Instrumentation (WMI) option. Continue with step 4. If you do not need to configure Host credentials, skip to step 8. 4.
3 Host discovery 1. Select Discover > Host Adapters. The Discover Host Adapters dialog box displays. 2. Select the host you want to delete from active discovery in the Discovered Hosts table. 3. Click Delete. 4. Click OK on the confirmation message. The deleted host displays in the Previously Discovered Addresses table. 5. Click Close on the Discover Host Adapters dialog box. Rediscovering a host to active discovery To rediscover a host to active discovery, complete the following steps. 1.
Host discovery 3 2. Select the host you want to delete permanently from discovery in the Previously Discovered Addresses table. 3. Click Delete. 4. Click OK on the confirmation message. 5. Click Close on the Discover Host Adapters dialog box. Viewing the host discovery state The Management application enables you to view device discovery status through the Discover Host Adapters dialog box. To view the discovery status of a device, complete the following steps. 1. Select Discover > Host Adapters.
3 VM Manager discovery • Discovery ignored. One or more adapters in the host are already a part of auto/manual enclosure {}. Please delete the enclosure and try again. • • • • • • Discovered Discovering.... Rediscovering... Deleting.... Internal Error No Adapters found Troubleshooting host discovery If you encounter discovery problems, complete the following checklist to ensure that discovery was set up correctly.
VM Manager discovery 3 VM Manager discovery requirements • Discovery of a vCenter server (refer to “Discovering a VM manager” on page 131, step 4 and step 5), requires a vCenter user with read-only or read-write privilege on the vCenter server node and all objects in the inventory below the vCenter server.
3 VM Manager discovery FIGURE 57 Add VM Manager dialog box 3. Enter the IP address or host name in the Network Address field. 4. Enter the VM manager port number in the Port field. 5. Enter the VM manager username in the User ID field. 6. Enter the VM manager password Password field. 7. Select the Enable display of network information in vSphere client check box to enable vSphere client plug-in registration. Clear to disable vSphere client plug-in registration. 8.
VM Manager discovery FIGURE 58 3 Edit VM Manager dialog box 3. Change the VM manager port number in the Port field. 4. Enter the VM manager username in the User ID field. 5. Enter the VM manager user password Password field. 6. Select the Enable display of network information in vSphere client check box to enable vSphere client plug-in registration. Clear to disable vSphere client plug-in registration. 7.
3 VM Manager discovery Removing a VM manager from active discovery If you decide you no longer want the Management application to discover and monitor a specific VM manager, you can delete it from active discovery. Deleting a VM manager also deletes the data on the server (both system collected and user-defined data) except for user-assigned names for the device port, device node, and device enclosure information. To delete a VM manager from active discovery, complete the following steps. 1.
IP Rediscovery 3 5. Refresh the Discover VM Managers list by clicking Refresh. 6. Click Close on the Discover VM Managers dialog box. Viewing the VM manager discovery state The Management application enables you to view device discovery status through the Discover VM Managers dialog box. To view the discovery status of a device, complete the following steps. 1. Select Discover > VM Managers. The Discover VM Managers dialog box displays. 2. Right-click the Hosts node select Expand All to show all devices.
3 IP Rediscovery When you rediscover an IP device, the Management application captures and stores all changes to its configuration since the last Discovery or Rediscovery cycle. Once Rediscovery completes, configuration updates display in Network Object view. Rediscovering IP devices To rediscover one or more IP devices, complete the following steps. 1. Select Discover > IP Products. The Discover Setup - IP dialog box displays. 2.
IP Rediscovery 3 Select multiple devices by holding down the CTRL key and clicking more than one device. You can select up to 32 devices for rediscovery. If you select to rediscover a multiple devices, you should configure a discovery profile to run in the background. For step-by-step instructions, refer to “Configuring a discovery profile” on page 90. 3. Click Rediscover on the Product List toolbar. The Rediscover product dialog box displays.
3 IP Rediscovery 3. Click the Preferences tab. 4. Select the Enable password validation on rediscover check box to enable password validation when rediscovering devices. 5. Click Apply to close the Discover Setup - IP dialog box. 6. Click Close to close the Discover Setup - IP dialog box.
Chapter Management Groups 4 In this chapter • Management groups overview . . . . . . . . . . . . . . . . . . . . . . . . . . . . . . . . . . . 139 • Product group overview. . . . . . . . . . . . . . . . . . . . . . . . . . . . . . . . . . . . . . . . . 140 • Port Groups . . . . . . . . . . . . . . . . . . . . . . . . . . . . . . . . . . . . . . . . . . . . . . . . . .
4 Product group overview • To filter the Network Objects Product List, refer to “Filtering devices in the Network Objects Product List” on page 513. • To update device configuration information on the Network Object view, refer to “IP Rediscovery” on page 135. Product group overview Once devices display in the Network Object view, you can associate the devices with a group. Product groups allow you to monitor and manage multiple devices at one time.
Product group overview 4 - Static — You can define a product group by selecting the product you want to include in the group. - Dynamic — You can define a product group using the following product attributes: Name IP Address Product Type Serial # Status Vendor Model Firmware Build Label Location Contact Description VLANs User_defined_property1 (up to 3) Static product groups You can define a static product group by selecting the product you want to include in the group.
4 Product group overview 3. Enter a unique name (maximum 64 characters) for the product group in the Name field. 4. Enter a description (maximum 255 characters) for the product group in the Description field. 5. Select the Topology Display Enable check box to display the product group in the L2 Topology view. 6. Add products to the group by selecting the product in the Available Products list and clicking the right arrow button.
Product group overview 4 Duplicating a static product group To duplicate a product group, complete the following steps. 1. Select Network Objects from the view list on the Product List toolbar. 2. Right-click the product group you want to duplicate in the Product List and select Duplicate Group. The Add Product Group dialog box displays. 3. Edit the name for the product group in the Name field. 4. Edit the description for the product group in the Description field. 5.
4 Product group overview • User_defined_property1 (up to 3) — A user-defined product property value. You can create up to three user-defined properties (refer to “Properties customization” on page 2211). Creating a dynamic product group To create a dynamic product group, complete the following steps. 1. Select Network Objects from the view list on the Product List toolbar. 2. Select Add Product Group > Dynamic from the Grouping list on the Product List toolbar.
Product group overview 4 NOTE You can add a standalone VDX product or a VCS fabric to a user-defined Product Group; however, the VCS fabric members are not included with the group. • • • • • • • Firmware Build Label Location Contact Description VLANs User_defined_property1 (up to 3) 8.
4 Product group overview If you selected Product Type from the Property list, the following predefined values are populated in the Value/Regular Expression field: • • • • • L2 Switch Load Balancer Router Wireless Controller Wireless Standalone AP To fetch products that have an empty value for a property, select the operator Equals from the Operator list and leave the Value/Regular Expression field blank.
Product group overview 4 The Edit Product Group - Dynamic dialog box displays. 3. Change the name for the product group in the Name field. 4. Change the description for the product group in the Description field. 5. Select the Topology Display Enable check box to display the product group in the L2 Topology view. 6. To add a new row, complete step 6 through step 11 of “Creating a dynamic product group” on page 144. 7. To delete a row, select the row and click Delete. 8.
4 Product group overview Viewing test results To test the group criteria, click Test. The Management application uses the group criteria to search the available products in your AOR. The products that meet the criteria display in the Test Results. table. This table includes the following details: • • • • • • • • • • • • • • • • Group/Product — The name of the product or product group. Name — The name of the product. IP Address — The IP address (IPv4 or IPv6 format) of the product.
Product group overview TABLE 20 4 Product Group Properties fields and components Field/Component Description Product Count The number of products in the group. Performance list Select to launch the real time or historical performance. Name The name of the product. Alias The alias. Host Name The host name. System Name The system name. IP Address The IP address (IPv4 or IPv6 format) of the product. System OID The system's object identifier. Device Type The type of device.
4 Port Groups Ctrl and click to select more than one group to delete. A confirmation message displays. 3. Click Yes. The group is deleted from the User-Defined Groups folder of the Product list. Port Groups Port groups allow you to group ports together across network devices to perform common port-based configuration and monitoring activities. Once configured you can use port groups to perform the following: • Deploy common configurations to all ports in a group.
Port Groups 7. 4 Remove ports from the group by selecting the port in the Selected Ports list and clicking the left arrow button. The selected ports move from the Selected Ports list to the Available Ports list. 8. Click OK. The new group displays in the Port Groups folder of the Product list. Editing a port group To edit a port group, complete the following steps. 1. Select Network Objects from the view list on the Product List toolbar. 2.
4 Port Groups 3. Edit the name for the port group in the Name field. 4. Edit the description for the port group in the Description field. 5. Select one of the following options: • All Ports — Select to display all ports. • Ports Connected to APs — Select to display only ports connected to an access point (AP). 6. Add ports to the group by selecting the port in the Available Ports list and clicking the right arrow button.
Port Groups TABLE 21 4 Port Group Properties fields and components Field/Component Port Actions list Description Select one of the following options: Enable Disable Display Attached Port Properties • • • Performance list Select to launch the real time or historical performance. Identifier The identifier of the port. Name The name of the port. MAC Address The MAC Address of the port. Port Status The status of the port. Port State The state of the port. Type The port type.
4 154 Port Groups Brocade Network Advisor SAN + IP User Manual 53-1003155-01
Chapter 5 Application Configuration In this chapter • Server Data backup. . . . . . . . . . . . . . . . . . . . . . . . . . . . . . . . . . . . . . . . . . . . • Server Data restore . . . . . . . . . . . . . . . . . . . . . . . . . . . . . . . . . . . . . . . . . . . . • SAN data collection . . . . . . . . . . . . . . . . . . . . . . . . . . . . . . . . . . . . . . . . . . . . • SAN display settings . . . . . . . . . . . . . . . . . . . . . . . . . . . . . . . . . . . . . . . . . . .
5 Configurable preferences • SAN End Node Display — Use to display (or turn off display of) end nodes on the Connectivity map for newly discovered fabrics. Disabling end node display limits the Connectivity map to switch members only. For more information, refer to “SAN End node display” on page 172. • SAN Ethernet Loss Events — Use to enable events for a loss of ethernet connection to SAN switches. For more information, refer to “SAN Ethernet loss events” on page 172.
Server Data backup 5 Server Data backup The Management application helps you to protect your data by backing it up automatically. Backup is a service process that periodically copies and stores application files to an output directory. The output directory is relative to the server and must use a network share format to support backup to the network. The data can then be restored, as necessary. NOTE Backing up data takes some time.
5 Server Data backup Backup directory structure overview The Management server backs up data to two alternate folders. For example, if the backup directory location is D:\Backup, the backup service alternates between two backup directories, D:\Backup\Backup and D:\Backup\BackupAlt. The current backup is always D:\Backup and contains a complete backup of the system. The older backup is always D:\BackupAlt. If a backup cycle fails, the cause is usually a full CD-RW.
Server Data backup 5 • Select the Include Technical Support directory check box, if necessary. Only available if the Include FTP Root directory check box is clear. • Select the Include Upload Failure Data Capture directory check box, if necessary. Only available if the Include FTP Root directory check box is clear. 5. Enter the time (using a 24-hour clock) you want the backup process to begin in the Next Backup Start Time Hours and Minutes fields. 6.
5 Server Data backup NOTE This is not recommended on a permanent basis. CDs have a limited life, and may only last a month. An error message occurs if your Management application can no longer backup to the disc. a. Verify that the CD backup directory is correct (default directory is D:\Backup). It is assumed that drive D is a CD-RW drive. You can change the directory or use the Browse button to select another directory. b. Install the formatted disc into the CD drive.
Server Data backup 5 Viewing the backup status The Management application enables you to view the backup status at a glance by providing a backup status icon on the Status Bar. The following table illustrates and describes the icons that indicate the current status of the backup function. TABLE 22 Icon Backup status Description Backup in Progress — displays the following tooltip: “Backup started at hh:mm:ss, in progress... XX directories are backed up.
5 Server Data restore 1. Select Server > Options. The Options dialog box displays. 2. Select Server Backup in the Category list. 3. Click Backup Now. Click Yes on the confirmation message. The backup process begins immediately. 4. Click Apply or OK. Reviewing backup events The Master Log, which displays in the lower left area of the main window, lists the events that occur on the Fabric. If you do not see the Master Log, select View > Show Panels > All Panels.
Server Data restore 5 The Management application helps you to protect your data by backing it up automatically. The data can then be restored, as necessary. The data in the following directories is automatically backed up to disk. The data includes the following items: • Backup\databases — contains database and log files.
5 SAN data collection If your Management application server fails and you must recover information to a new server, restore the data (Refer to “Restoring data” on page 163 for complete instructions). SAN data collection The Management application uses collectors to gather data from switches, persist the switches in the database, and to publish the collected data to the client. Each collector polls data for one feature area using HTTP or HTTPS (web pages or CAL calls) to communicate with the switch.
SAN data collection 5 • TopologyCollector – Collects data about the ISLs in the fabric. • TrunkInfoCollector – Collects data about trunks in the fabric. • WtJarsCollector – Downloads the jar files needed to launch WebTools from the Management application. Switch-level collectors gather individual switch-level information (such as, port details and so on). The Management application also uses specialty collectors which run only for switches that have a particular feature.
5 Product communication protocols Product communication protocols Table 23 details the protocols that the Management application uses for communication between products and the Management application server. TABLE 23 Product communication protocols Protocol Description Management application use Communicates with device type ICMP The Internet Control Message Protocol (ICMP) is part of the Internet Protocol Suite, as defined in RFC 792.
Product communication protocols TABLE 23 Protocol 5 Product communication protocols Description Management application use Communicates with device type HTTP/HTTPS The Hypertext Transfer Protocol (HTTP) is an application protocol for distributed, collaborative, hypermedia information systems. HTTP is the foundation of data communication for the World Wide Web.
5 SAN display settings TABLE 23 Product communication protocols Protocol Description Management application use Communicates with device type SCP Secure copy (SCP) is a means of securely transferring computer files between a local host and a remote host or between two remote hosts. It is based on the Secure Shell (SSH) protocol. Used for firmware download. For Fabric OS and Network OS devices, used to collect technical support information.
SAN display settings FIGURE 62 5 Options dialog box (SAN Display pane) 3. Click Set Up FICON Display. Any table that contains end device descriptions move the following nine columns to the beginning of the table: Attached Port #, FC Address, Serial #, Tag, Device Type, Model, Vendor, Port Type, and WWN. 4. Click Apply or OK to save your work. Resetting your display You can reset your system to display the default display settings for all fabrics.
5 SAN display settings To reset the Management application to the default display and view settings, complete the following steps. 1. Select Server > Options. The Options dialog box displays. 2. Select SAN Display in the Category list. 3. Click Reset Display. 4. Click Yes on the reset confirmation message. The display and view settings are immediately reset to the default display settings (as detailed in the Default display settings table. 5. Click Apply or OK to save your work.
SAN display settings 5 • 00:00:88 (hex) Brocade Communications Systems, Inc. • 000088 (hex) Brocade Communications Systems, Inc. 5. Click OK. Editing the product type You can edit the product type of the OUI by setting it as Initiator, Target. or Default. To edit the product type, complete the following steps. 1. Select Server > Options. The Options dialog box displays. 2. Select SAN Display in the Category list. The SAN Display pane displays. 3. Click Edit Product Type.
5 SAN End node display SAN End node display The connectivity map can be configured to display or not display end nodes. This option enables you to set the end node display for all newly discovered fabrics. Note that disabling end node display limits the connectivity map to emphasize switch members only. Displaying end nodes To display end nodes when discovering a new fabric, complete the following steps. 1. Select Server > Options. The Options dialog box displays (Figure 64).
Event storage settings FIGURE 65 5 Options dialog box (SAN Ethernet Loss Event pane) 2. Select SAN Ethernet Loss Events in the Category list. 3. Select the Enable events for ethernet loss check box. 4. Enter the Ethernet time out value (10 to 120 minutes). 5. Click Apply or OK to save your work. Disabling SAN Ethernet loss events To disable Ethernet loss events, complete the following steps. 1. Select Server > Options. The Options dialog box displays. 2.
5 Event storage settings FIGURE 66 Options dialog box (Event Storage pane) 3. Enter the maximum number of events you want to be retained in the repository in the Maximum Events field. Depending on your installation, the maximum number of events stored are as follows: • Professional — 1 through 100,000 • Professional Plus — 1 through 1,000,000 • Enterprise — 1 through 10,000,000 Default is 50,000.
Flyover settings 5 Purged events from the master log table are stored in the Install_Home\data\archive\events directory using the format event_MMDDYYY.zip (for example, event_04052011.zip. These files are retained for a maximum of 30 days. The zip file contains multiple archive text files that use the format event_MMDDYYY_N.txt (for example, event_04052011_1.txt). Flyover settings You can configure your system to display information for products and connections in a pop-up window on the Connectivity Map.
5 Flyover settings The default protocol is Fibre Channel (FC).
Flyover settings FIGURE 68 a. 5 Options dialog box (Flyovers pane, Connection tab) Select the protocol type (FC or IP) from the Type list, if necessary. The default protocol is FC. Depending on which protocol you select, some properties may not be available for all protocols. b. Select each property you want to display in the connection flyover from the Available Properties table.
5 Name settings IP • IP_Address:Port-IP_Address:Port c. Click the right arrow to move the selected properties to the Selected Properties table. d. Use the Move Up and Move Down buttons to reorder the properties in the Selected Properties table. The properties displayed in the Selected Properties table appear in the flyover display. 8. Remove connection properties you do not want to display on flyover by selecting the property in the Selected Properties table and clicking the left arrow. 9.
Name settings 5 1. Select Server > Options. The Options dialog box displays. 2. Select SAN Names in the Category list. The SAN Names pane displays. 3. Select Set names to be unique to require that names be unique on your system. 4. Click OK on the Options dialog box. 5. Click OK on the “duplicate names may exist” message. To fix duplicated names, refer to “Fixing duplicate names” on page 179. Setting names to be non-unique You can choose to allow duplicate names in your fabric.
5 Name settings FIGURE 69 Duplicated Names dialog box The Duplicated Names dialog box contains the following information: • Description — A description of the device. • Duplicate Names table — Every instance of duplicate names. Fabric — The fabric name. FC Address — The Fibre Channel address. Names — The current name of the device. If you selected the Append Incremental numbers for all repetitive names option, the names display with the incremental numbering.
Name settings 5 Viewing names To view names associated with devices, complete the following steps. 1. Select Configure > Names. The Configure Names dialog box displays (Figure 70). FIGURE 70 Configure Names dialog box 2. Select All Names from the Display list. Only devices with a name display. The table displays the following information. • Scope list — Select a search value (Name or WWN) from the list. • Search text box — Enter the name or WWN of the device for which you are searching.
5 Name settings • Export button — Click to export the name data. Depending on your operating system, the default export location are as follows: Desktop\My documents (Windows) \root (Linux) For more information, refer to “Exporting names” on page 184. • Fix Duplicates button — Click to launch the Fix Duplicates dialog box. For more information, refer to “Fixing duplicate names” on page 179. • Apply Names button — Click to apply unassigned (detached) names to newly discovered devices.
Name settings 5 Adding a name to a new device To add a new device and name it, complete the following steps. 1. Select Configure > Names. The Configure Names dialog box displays. 2. Enter the WWN of the device in the Detached WWN field. 3. Enter a name for the device in the Name field. 4. Click Add. The new device displays in the table. If you set names to be unique on the Options dialog box and the name you entered already exists, a message indicating the name already in use displays.
5 Name settings 6. Click OK on the confirmation message. Editing names To edit the name associated with a device, complete the following steps. 1. Select Configure > Names. The Configure Names dialog box displays. 2. Select All Names from the Display list. Only devices with a name display. The table displays the Name, WWN, Operational Status, Type, and a Description of the device. 3. Click the name you want to edit in the Name column. 4. Edit the name and press Enter. 5.
Name settings TABLE 25 5 Name length limitations Device Character limit Fabric OS switch port 6.4.X or earlier 32 (24 character limit when in FICON mode) HBA 256 HBA port 256 Others names 128 To import names, complete the following steps. 1. Select Configure > Names. The Configure Names dialog box displays. 2. Click Import. The Import Files dialog displays. 3. Browse to the import (.csv) file location. 4. Select the file and click Import. 5. Click OK to close the Configure Names dialog box. 6.
5 Miscellaneous security settings Searching for a device by WWN You can search for objects (switch, fabric, product, ports, or N Ports) by WWN (world wide name). To search for a WWN in the Connectivity Map, refer to “Searching for a device” on page 493. To search by WWN, complete the following steps. 1. Select Configure > Names. The Configure Names dialog box displays. 2. Select All Names from the Display list. 3. Select WWN from the Scope list. 4. Enter the WWN you want to search for in the Search field.
Miscellaneous security settings FIGURE 71 5 Options dialog box (Security Misc pane) 3. Enter the server name in the Server Name field. The Server Name field cannot be empty. 4. Click OK on the confirmation message. 5. Click Apply or OK to save your work. Enforcing MD5 file during import NOTE The MD5 checksum file is required when you load Fabric OS firmware into the Management application version 12.0 or later.
5 Miscellaneous security settings Configuring login security To configure login security, complete the following steps. 1. Select Server > Options. The Options dialog box displays. 2. Select Security Misc in the Category list. 3. Choose one of the following options: • To allow users to save their password in the Login Security list, select Allow clients to save password on login.
Syslog Registration settings 5 Syslog Registration settings You can automatically register the server as the syslog recipient on products. Registering a server as a Syslog recipient automatically 1. Select Server > Options. The Options dialog box displays. 2. Select Syslog Registration in the Category pane. The Syslog Registration pane displays (Figure 72). FIGURE 72 Options dialog box (Syslog Registration pane) 3. Select the Auto register server as Syslog recipient check box, if necessary.
5 SNMP Trap forwarding credential settings Registering a server as a SNMP trap recipient automatically 1. Select Server > Options. The Options dialog box displays. 2. Select Trap Registration in the Category pane. The Trap Registration pane displays (Figure 73). FIGURE 73 Options dialog box (Trap Registration pane) 3. Select the Auto register server as SNMP trap or informs recipient check box, if necessary. This check box is selected by default. 4. Click Apply or OK to save your work.
SNMP Trap forwarding credential settings FIGURE 74 5 Options dialog box (Trap Forwarding Credentials pane) 3. Enter the unique community string (case sensitive, 1 to 16 characters). in the Community and Confirm Community fields. Displays as asterisks. Allows all printable ASCII characters. 4. Click Apply or OK to save your work. Configuring SNMP v3 credentials To configure a SNMP v1 or v2c credentials, complete the following steps. 1. Select Server > Options. The Options dialog box displays. 2.
5 Software Configuration • CFB_AES_256 (continue with step 7) • NONE (go to step 8) 7. Enter the privacy password (case sensitive, 8 to 16 characters) in the Priv Password and Confirm Password fields. Displays as asterisks. Allows all printable ASCII characters. 8. Click Apply or OK to save your work. Software Configuration The Management application allows you to configure the following software settings: • • • • • • Certificates — Support settings to allow enhanced diagnostics.
Software Configuration 5 Viewing certificates 1. Select Server > Options. The Options dialog box displays. 2. Select Certificates to in the Category list. The Certificates pane displays (Figure 75). FIGURE 75 Options dialog box (Certificates pane) The Certificates pane contains the following fields and components: • Enable certificate validation check box — Select to enable certificate validation.
5 Software Configuration • Truststore Certificates table — Contains the following fields and components: Alias Name — Unique alias of the certificate. Issued To — To whom the certificate was issued. Issued By — Author of the certificate. Import button — Click to import a certificate. For more information, refer to “Importing a truststore certificate” on page 195. View button — Click to view the certificate details.
Software Configuration 5 • Right-side table — Displays the following certificate details: Version — Version of the certificate. Serial Number — Serial number of the certificate. Signature Algorithm — Signature algorithm used to sign the certificate. The signature algorithm is derived from the algorithm of the underlying private key. For example, if the underlying private key is of type "RSA", the default signature algorithm is "SHA256withRSA". Issuer — Entity that signed the certificate.
5 Software Configuration Changing the password for the truststore repository To change the keystore password, refer to “Changing the keystore password” on page 198. 1. Select Server > Options. The Options dialog box displays. 2. Select Certificates to in the Category list. The Certificates pane displays. 3. Select a truststore in the Truststore Certificates table. 4. Click Password. The Truststore Password dialog box displays. 5. Enter the current password in the Old Password field. 6.
Software Configuration 5 Validity — Dates that the certificate is valid. Subject — Name of the entity whose public key the certificate identifies. Signature — Digital signature of the certificate. MD5 Fingerprint — MD5 fingerprint used to authenticate the public key. SHA1 Fingerprint — SHA1 fingerprint used to authenticate the public key Public Key — Public key used for the certificate. Right-side text box — Displays the value for the field selected in the table above. • 4. Click Close. 5.
5 Software Configuration 6. Click Apply or OK to save your work. The new certificate is saved to the server. 7. Click OK on the “changes take effect after application restart” message. Changing the keystore password NOTE Changes to this option take effect after an application restart. 1. Select Server > Options. The Options dialog box displays. 2. Select Certificates to in the Category list. The Certificates pane displays. 3. Select Change Password from the Keystore Certificate list.
Software Configuration 5 Client export port settings You can configure a port for communication between the client and server. Configuring the client export port To configure client export port settings, complete the following steps. 1. Select Server > Options. The Options dialog box displays. 2. Select Client Export Port to assign a communications port between the client and server in the Category list. The Client Export Port pane displays (Figure 77).
5 Software Configuration Server impact • • • • • Configuration wizard (does not display all IP addresses) Trap and Syslog auto registration Report content (Ipconfiguration element does not display all server IP addresses) Network OS configuration backup through FTP Trace dump through FTP Client impact • • • • • Options dialog box (does not display all IP addresses) Firmware import and download dialog box Firmware import for Fabric OS and Network OS products FTP button in Technical Support Repository
Software Configuration 5 4. Select the return IP address in the Client - Server IP Configuration Return Address list. 5. Select the preferred IP address in the Switch - Server IP Configuration Preferred Address list. If DNS is not configured for your network, do not select the ‘hostname’ option from either the Return Address or Preferred Address list. Selecting the ‘hostname’ option prevents clients and devices from communicating with the Server. 6. Click Apply or OK to save your work.
5 Software Configuration a. Select an address from the Server IP Configuration list. b. Select an address from the Switch - Server IP Configuration Preferred Address list. NOTE If the “hostname” contains invalid characters, the host name does not display in the list. Valid characters include alphanumeric and dash (-) characters. The IP address is selected by default. If the an IPv6 address is selected, server start up will fail.
Software Configuration 5 NOTE If your Operating System is IPv4-enabled or IPv6-enabled (dual mode), the server binds using IPv4 address by default. NOTE IPv6 only mode does not support server to client communication (the IPv6 address cannot be bound to the server). To configure the IP address to override the default RMI server host IP address, complete the following steps. NOTE This configuration option replaces the -Djava.rmi.server.hostname value used in previous releases. 1.
5 Software Configuration • Configuring MPLS polling service preferences . . . . . . . . . . . . . . . . . . . . . . • Configuring name service preferences . . . . . . . . . . . . . . . . . . . . . . . . . . . . • Configuring polling service preferences. . . . . . . . . . . . . . . . . . . . . . . . . . . . • Configuring sFlow accounting preferences . . . . . . . . . . . . . . . . . . . . . . . . . • Configuring sFlow data collector preferences . . . . . . . . . . . . . . . . . . . . . . .
Software Configuration 5 4. Enter the number of configurations to retain per product in the ConfigsRetainedPerProduct field. The maximum is 30 and the minimum is 5. The default is 20. When the system reaches the maximum limit for a product, the oldest configuration is deleted and the new configuration is saved. However, if a baselined configuration becomes the oldest configuration, the baselined configuration is retained. 5.
5 Software Configuration 2. Select IP Preferences from the Software Configurations list in the Category pane. 3. Enter the number of days to retain deployment records in the Expiration.DaysToKeep field. The minimum is 1 and the maximum is 366. The default is 180. 4. Click Apply or OK to save your work. Configuring deployment report preferences 1. Select Server > Options. The Options dialog box displays. 2. Select IP Preferences from the Software Configurations list in the Category pane. 3.
Software Configuration 5 3. Select the EnableVcidThresholdNotification check box to enable notification when the VCID pool usage crosses a threshold. 4. Enter a threshold percentage for the VCID pool usage in the VcidThresholdPercentage field. Once this threshold is reached, a trap is generated to notify you that the VCID pool is running out of IDs. 5. Click Apply or OK to save your work. Configuring MPLS polling service preferences 1. Select Server > Options. The Options dialog box displays. 2.
5 Software Configuration Configuring sFlow accounting preferences 1. Select Server > Options. The Options dialog box displays. 2. Select IP Preferences from the Software Configurations list in the Category pane. 3. Select the LogReportsToFile check box to enable sFlow accounting log reports to file. 4. Enter the maximum number of rows to display in the log report in the MaxRowsToShow field. The default is 200. 5. Click Apply or OK to save your work. Configuring sFlow data collector preferences 1.
Software Configuration 5 To enter multiple combinations, separate them with commas (for example, FIN-SYN, ACK-RST). Control bit options include: • • • • • • ACK — Acknowledgement field significant bit URG — Urgent pointer field significant bit PSH — Push function bit RST — Reset connection bit SYN — Synchronize sequence number bit FIN — No more data from sender 8. Click Apply or OK to save your work. Configuring SSL certificates preferences 1. Select Server > Options. The Options dialog box displays.
5 Software Configuration 4. Enter the polling interval in the PollingIntervalMilliSeconds field. The default is 5000. 5. Select the ReadNewEventsOnly check box to only read new events. Configuring TFTP preferences 1. Select Server > Options. The Options dialog box displays. 2. Select IP Preferences from the Software Configurations list in the Category pane. 3. Enter the number of retries before aborting a read or write transfer in the maxRetries field. 4.
Software Configuration FIGURE 81 5 Options dialog box (Memory Allocation pane) 3. (Enterprise only) In the SAN Network Size list, complete the following steps. For other editions, the SAN Network size is small. You cannot change the SAN Network size. NOTE The SAN + IP version is not supported on a 32-bit Windows system. a. Select the size of the SAN (small, medium, or large) you want to configure.
5 Software Configuration For other editions, the IP Network size is medium. You cannot change the IP Network size. a. Select the size of the IP Network (small, medium, or large) you want to configure. Product recommended counts change to the new default values when you change the IP Network size.
Software Configuration 5 For all 64-bit servers, the default minimum server heap size for all network sizes is 2048 MB. NOTE There is no restriction on the maximum value for server heap size in a 64-Bit server. The correct server heap size value must be given according to the RAM present in the server. 7. Click Apply or OK to save your work. NOTE Changes to this option take effect after an application restart.
5 Software Configuration • Small/0–2000 ports (Professional): 120 seconds • Medium/2000–5000 ports: 900 seconds • Large/5000 or more ports: 1800 seconds 5. Click Apply or OK to save your work. NOTE Changes to this option take effect after an application restart. NOTE You can only restart the server using the Server Management Console (Start > Programs > Management_Application_Name 12.X.X > Server Management Console). 6. Click OK on the “changes take effect after application restart” message.
Software Configuration 5 Product communication settings You can configure HTTP or HTTPS connections between the products and the Management application server. Configuring SAN communication To configure connections between the SAN devices and the Management application server, complete the following steps. 1. Select Server > Options. The Options dialog box displays. 2. Select Product Communication from the Software Configurations list in the Category pane.
5 Software Configuration a. Select the Connect using HTTPS (HTTP over SSL) only option. b. Enter the connection port number in the Port # field. Continue with step 6. The default HTTPS port number is 443. 5. To connect using HTTPS then HTTP, complete the following steps. a. Select the Connect using HTTPS then HTTP option. b. Enter the connection port number in the Current Port # field. Continue with step 6. The default HTTPS port number is 443 and the default HTTP port number is 80. 6.
Software Configuration FIGURE 83 5 Options dialog box (Product Communication pane) 3. To connect to products using SSH, complete the following steps. a. Select the SSH only option. b. Enter the connection port number in the SSH Port field. Go to step 6. The default SSH port number is 22. 4. To connect to products using Telnet, select the Telnet only option. Go to step 6. 5. To connect to products using SSH then Telnet, complete the following steps. a. Select the SSH then Telnet option. b.
5 Software Configuration File Transfer Protocol (FTP) is a network protocol used to transfer data from one computer to another over a TCP computer network. During installation, a built-in FTP server and its services are installed. Other FTP servers on your system are recognized by the application as external FTP servers. For Windows systems, the built-in FTP server is the default configuration and installation starts the FTP service if port 21 is not used by any other FTP server.
Software Configuration FIGURE 84 5 Options dialog box (FTP/SCP/SFTP pane) 3. Select the Use built-in FTP/SCP/SFTP Server option to use the default built-in FTP server. All active fields are mandatory. The default user name is admin. The full path to the built-in FTP directory displays in the Root Directory field. 4. Select the Built-in FTP Server check box. 5. Change your password by entering a new password in the Password and Confirm Password fields.
5 Software Configuration FIGURE 85 Options dialog box (FTP/SCP/SFTP pane) 3. Select the Use built-in FTP/SCP/SFTP Server option to use the default built-in SCP or SFTP server. All active fields are mandatory. The default user name is admin. The full path to the built-in SCP or SFTP directory displays in the Root Directory field. 4. Select the SCP/SFTP Server check box. 5. Change your password by entering a new password in the Password and Confirm Password fields.
Software Configuration FIGURE 86 5 Options dialog box (FTP/SCP/SFTP pane) 3. Select the Use External FTP Server and/or SCP Server option. 4. To configure an external FTP server, complete the following steps. a. Select the FTP Server check box to configure the external FTP server. All fields are mandatory. b. Enter the IP address for the remote host in the Remote Host IP field. c. Enter a user name in the Remote Host User Name field. d.
5 Software Configuration Use a slash (/) or period (.) to denote the root directory. 7. e. Enter the password in the Password Required for SFTP field. f. Select SFTP from the Preferred Protocol (Secured) list. Click Test to test the server. A “Server running successfully” or an error message displays.
Software Configuration 5 1. Select Server > Options. The Options dialog box displays. 2. Select Server Port in the Category list. The Server Port pane displays (Figure 87). FIGURE 87 Options dialog box (Server Port pane) 3. Enter a port number in the Web Server Port # (HTTPS) field. The default is 443. 4. Enable HTTP redirection to HTTPS by selecting the Redirect HTTP Requests to HTTPS check box. When you enable HTTP redirection, the server uses port 80 to redirect HTTP requests to HTTPS.
5 Software Configuration 1. Select Server > Options. The Options dialog box displays (Figure 88). 2. Select Support Mode in the Category list. NOTE Only use this option when directed to by customer support. The Support Mode pane displays (Figure 87). FIGURE 88 Options dialog box (Support Mode pane) 3. Select the Log client support data - Log Level list, and select the type of log data you want to configure. Log level options include: All, Fatal, Error, Warn, Info, Debug, Trace, and Off.
FIPS Support 5 server. log file properties • There is only one server.log file each day with no log size limit. • The server.log file rolls over at 12:00 midnight everyday. • When the log file rolls over, it is compressed and renamed using the following file name format: server.yyyy-mm-dd.log.zip for example, server.2010-04-14.log.zip, server.2010-04-15.log.zip, and so on • For servers, log files are created in the Install_Home/logs/server directory.
5 Fabric tracking Device Added Device Removed When you enable fabric tracking and a switch is missing from the fabric, a warning level call home event (Switch Switch_WWN is missing from the Fabric Fabric_Name) is generated in the Master Log and a call home alert is sent to the corresponding call center for this event. To avoid call home events for missing switches, create a call home event filter and clear the Switch is missing from the Fabric check box in the Available Call Home Event Types table.
Fabric tracking 5 The accept changes summary message displays. This message includes the following information: • Do not show me this again check box — Select if you do not want to see this dialog box again when you enable or disable fabric tracking or accept changes for a switch or fabric. • Switches — This table shows a brief summary of the switches including status (whether the device port will be added ( ) or removed ( ) from the fabric), name, fabric name, IP address, WWN, and domain ID.
5 Fabric tracking • Switches — This table shows a brief summary of the switches including status (whether the device port will be added ( ) or removed ( ) from the fabric), name, fabric name, IP address, WWN, and domain ID. This table includes unmonitored switches which becomes segmented from the fabric.
Fabric tracking 5 • Switches — This table shows a brief summary of the switches including status (whether the device port will be added ( ) or removed ( ) from the fabric), name, fabric name, IP address, WWN, and domain ID. This table includes unmonitored switches which becomes segmented from the fabric.
5 230 Fabric tracking Brocade Network Advisor SAN + IP User Manual 53-1003155-01
Chapter 6 User Account Management In this chapter • Users overview. . . . . . . . . . . . . . . . . . . . . . . . . . . . . . . . . . . . . . . . . . . . . . . . • User accounts . . . . . . . . . . . . . . . . . . . . . . . . . . . . . . . . . . . . . . . . . . . . . . . . • Roles. . . . . . . . . . . . . . . . . . . . . . . . . . . . . . . . . . . . . . . . . . . . . . . . . . . . . . . . • Areas of responsibility . . . . . . . . . . . . . . . . . . . . . . . . . . . . . . . . . . . . . . . . . .
6 Users overview FIGURE 91 Users dialog box - Users tab The Users dialog box contains the following fields and components: • Authentication-Primary — The primary authentication server type configured through the Server Management Console. • Secondary — The secondary authentication server type configured through Server Management Console. • Authorization — The authorization source configured through the Server Management Console.
Users overview 6 • Users table — The configured users. User ID — The unique name used to identity a user. Full Name — The user’s full name. Roles — List of roles the user belongs to separated by commas. Area Of Responsibility — List of Area Of Responsibility (AORs) the user belongs to separated by commas. E-mail Notification — Whether e-mail notification is enabled for the user. Account Enabled — Whether the user account status is enabled.
6 Users overview Default system roles for SAN only environments include: - SAN System Administrator Network Administrator Security Administrator Zone Administrator Operator Security Officer Host Administrator Default system roles for IP only environments include: - IP System Administrator Network Administrator Report User Group Default system roles for SAN plus IP environments include: - SAN System Administrator IP System Administrator Network Administrator Security Administrator Zone Administrato
User accounts 6 • E-mail Event Notification Setup button — Click to configure e-mail event notification (refer to “Configuring e-mail notification” on page 254). 3. Click Close to close the Users dialog box. User accounts NOTE You must have User Management Read and Write privileges to add new accounts, set passwords for accounts, and apply roles to the accounts. For a list of privileges, refer to “User Privileges” on page 2151.
6 User accounts 3. Enter a unique name to identify the user in the User ID field. 4. Enter a password for the user in the Password and Confirm Password fields. Passwords displays as dots (.). For password policy details, refer to “Viewing your password policy” on page 253. 5. Select the Account Status - Enable check box to enable the account of the user. Account Status is enabled by default. 6. (Optional) Enter the full name of the user in the Full Name field. 7.
User accounts 6 Editing a user account To make changes to an existing user account, complete the following steps. 1. Select Server > Users. The Users dialog box displays. 2. Select the user account you want to edit and click Edit under the Users table. The Edit User dialog box displays. 3. Complete step 3 through step 13 in “Creating a new user account” on page 233. 4. Click OK to save the user account and close the Edit User dialog box.
6 User accounts Copying and pasting user preferences You can copy user preference settings, such as window and dialog box sizes, table column and sort order, as well as other customizations, and all the user-defined views (including fabrics and hosts) from the selected user account to one or more other user accounts. If the fabric and hosts from the original user account are not included in the other user's AOR, then the copied fabrics and hosts do not display in the other user's views.
User accounts 6 5. Click Save.The file is saved to the location you selected. If the export is successful, the following message displays: User profile data exported successfully to -UserProfile-
6 User accounts Removing roles and areas of responsibility from a user account To remove roles and AORs from an existing user account, complete the following steps. 1. Select Server > Users. The Users dialog box displays. 2. Select the user account you want to edit and click Edit under the Users table. The Edit User dialog box displays. 3.
Roles 6 4. Click Close to close the Users dialog box. Deleting a user account NOTE You cannot delete the default "Administrator" user account. To permanently delete a user account from the server, complete the following steps. 1. Select Server > Users. The Users dialog box displays. 2. Select the user you want to delete in the Users table and click Delete. 3. Click Yes on the confirmation message. If currently accessing the server, the user will be logged out once the user account is deleted. 4.
6 Roles 1. Select Server > Users. The Users dialog box displays. 2. Click Add under the Roles table. The Add Role dialog box displays. FIGURE 93 Add Role dialog box 3. Enter a name of the role in the Name field. 4. (Optional) Enter a short description for the role in the Description field. 5. Add or remove privileges as needed. For step-by-step instructions, refer to “Adding privileges to a role” on page 241 or “Removing privileges from a role” on page 242. 6.
Roles 6 4. Click OK to save the role and close the Edit Role dialog box. If you make changes to the user’s role or AOR while the user is logged in, a confirmation message displays. When you click OK on the confirmation message, the user is logged out and must log back in to see the changes. 5. Click Close to close the Users dialog box. Copying a role You can create a new role by copying an existing one. When you copy a role, you copy the selected privileges in that role.
6 Roles 2. Click Add, Edit, or Duplicate under the Roles table. The Add Roles, Edit Roles, or Duplicate Roles dialog box displays. 3. Add read and write access by selecting the features to which you want to allow read and write access in the Available Privileges list and click the right arrow button to move the features to the Read & Write Privileges list. Select multiple features by holding down the CTRL key and clicking more than one privilege. The features are moved to the Read & Write Privileges list.
Areas of responsibility 6 Areas of responsibility NOTE You must have User Management Read and Write privileges to view, add, modify, or delete operational areas of responsibility. An area of responsibility (AOR) allows you to place Fabrics, Hosts, Products, Product Groups, Port Groups, and Application products into management groups that can be assigned to an Management application user.
6 Areas of responsibility FIGURE 94 Users dialog box - Users tab 3. Enter a name of the AOR in the Name field. 4. (Optional) Enter a short description for the AOR in the Description field. 5. Assign or remove products as needed. For step-by-step instructions, refer to “Assigning products to an AOR” on page 245 or “Removing products from an AOR” on page 247. 6. Click OK to save the new AOR and close the Add AOR dialog box. The new AOR displays in the AOR list of the Users dialog box. 7.
Areas of responsibility 6 If you make changes to the user’s role or AOR while the user is logged in, a confirmation message displays. When you click Yes on the confirmation message, the user is logged out and must log back in to see the changes. 5. Click Close to close the Users dialog box. Copying an AOR NOTE You cannot duplicate system AORs. To create a new AOR by copying an existing one, complete the following steps. 1. Select Server > Users. The Users dialog box displays. 2.
6 Areas of responsibility The Add AOR, Edit AOR, or Duplicate AOR dialog box displays. 3. Click the Fabrics tab. 4. Select the fabrics you want to assign to the AOR in the Available Fabrics table and click the right arrow button to move the products to the Selected Products table. Select multiple fabrics by holding down the CTRL key and clicking more than one fabric. 5. Click the Hosts tab. 6.
Password policies 6 Removing products from an AOR You can remove fabrics, hosts, and IP products from and AOR from the Edit AOR or Duplicate AOR dialog box. To remove fabrics, hosts, and IP products from the AOR, complete the following steps. 1. Select Server > Users. The Users dialog box displays. 2. Click Edit or Duplicate under the AOR table. The Edit AOR or Duplicate AOR dialog box displays. 3.
6 Password policies FIGURE 95 Users dialog box - Policy tab 3. Configure the password expiration by completing the following steps. a. Enter the maximum number of days that can elapse before a password must be changed by the user in the Password Age field. Valid values are 0 through 999. The default is 0, which means the policy is disabled. b. Enter the number of days to warn the user prior to password expiration in the Warning Period field.
Password policies 6 Only enabled when the Empty Password - Allow check box is clear. Valid values are 4 through 127. The default is 8. c. Enter the minimum number of uppercase characters required in the Upper Case Characters field. Only enabled when the Empty Password - Allow check box is clear. Valid values are 0 through 127. The default is 0. d. Enter the minimum number of lowercase characters required in the Lower Case Characters field.
6 User profiles b. Select Reject New Sessions or Logout Existing Sessions from the Action list. 8. To configure the application to use the CLI login credentials of the user for all CLI deployments, select the Use User CLI Credential check box in the CLI Credential area. A confirmation message displays. Click Yes on the message. Make sure to configure the User CLI Credentials in the User Profile dialog box (refer to “Configuring CLI credentials” on page 254).
User profiles • • • • • • • • • 6 Change your user account description Change your phone number Change your e-mail address View your account state View your password policy Reset Management application messages Enable e-mail notification Configure e-mail notification Configure CLI credentials Viewing your user profile To view your user profile, complete the following steps. To edit your user profile, refer to “Editing your user profile” on page 252. 1. Select Server > User Profile.
6 User profiles • CLI Credential Configure button — Click to display the CLI Credentials dialog box (refer to “Configuring CLI credentials” on page 254). • Optional Messages Reset button — Click to reset all optional messages to the default behavior. For more information, refer to “Resetting optional messages” on page 254. 2. Click OK on the User Profile dialog box. Editing your user profile To edit your user profile, complete the following steps. 1. Select Server > User Profile.
User profiles 6 2. Change your password in the Password and Confirm Password fields. Passwords display as dots (.). 3. Click OK on the User Profile dialog box to save your changes. If your password expires or your current password violates the password policy, you will be prompted to change your password from the Change Password dialog box. To view your password policy, click Password Policy - View. To change your password from the Change Password dialog box, complete the following steps. 1.
6 User profiles Resetting optional messages To reset all Management application optional messages to their default behaviors, complete the following steps. 1. Select Server > User Profile. The User Profile dialog box displays. 2. Click Optional Messages Reset. The Password Policy dialog box displays. 3. Click Yes on the confirmation message. A successful reset message displays. 4. Click OK on the User Profile dialog box.
User profiles 6 3. Enter the user name for the product in the Product Login Account - Username field. 4. Enter the password for the product in the Product Login Account - Password field. NOTE If Telnet is used to log in to the device and Telnet only requires a password, then enter the password in the Password field and leave the Username field blank. 5. (IronWare only) Enter the user name assigned to management privilege levels on the device in the Product Enable Account - Username field. 6.
6 256 User profiles Brocade Network Advisor SAN + IP User Manual 53-1003155-01
Chapter 7 Web Client In this chapter • Web client overview. . . . . . . . . . . . . . . . . . . . . . . . . . . . . . . . . . . . . . . . . . . . • Dashboard . . . . . . . . . . . . . . . . . . . . . . . . . . . . . . . . . . . . . . . . . . . . . . . . . . . • Inventory. . . . . . . . . . . . . . . . . . . . . . . . . . . . . . . . . . . . . . . . . . . . . . . . . . . . . • Events. . . . . . . . . . . . . . . . . . . . . . . . . . . . . . . . . . . . . . . . . . . . . . . . . . . . . . . • Reports. . .
7 Dashboard 2. Left pane — Contains the Expand navigation bar which provides a list of features you can access. For more information, refer to: • “Dashboard expand navigation bar” on page 259 • “Inventory expand navigation bar” on page 310 • “Reports expand navigation bar” on page 334 3. Right pane — Displays the detail for the feature selected in the left pane.
Dashboard 7 The dashboard provides a high-level overview of the network and the current states of managed devices. This allows you to easily check the status of the devices on the network. The dashboard also provides several features to help you quickly access reports, device configurations, and system event logs. The dashboard refreshes every ten seconds regardless of the size of your network. Note that data may become momentarily out of sync between the dashboard and other areas of the application.
7 Dashboard Dashboard toolbar The dashboard toolbar (Figure 98) is located above the status widgets or performance monitors and provides a information about the selected dashboard as well as buttons to perform various functions. FIGURE 98 Dashboard toolbar The dashboard toolbar contains the following fields and components: 1. Collapse/Expand buttons — Click the Expand button to hide the expand navigation bar. Click the Collapse button to display the expand navigation bar. 2.
Dashboard customization 7 Accessing a dashboard NOTE If you change the dashboard in the Java client, change is reflected in the web client and vice versa. To access a specific dashboard, complete the following steps. 1. Click the Dashboard icon. The Dashboard expand navigation bar displays. 2. Select the dashboard you want to view from the Dashboards list. Options include: • Default Dashboards — Displays the three preconfigured dashboards.
7 Dashboard customization FIGURE 99 Scope dialog box 2. Select a network from the Network Scope list. The available network scopes include the following options: • • • • • • All products and fabrics Any SAN fabric Any Ethernet fabric Any system-defined group Any user-defined group Any user-defined customized network If you select a fabric scope, dashboard widgets displays data for all products and ports in the fabric.
Dashboard customization 7 Setting the time interval Setting the global time interval in the dashboard toolbar configures the data display time range for all the applicable widgets. Time interval in the Scope list allows you to select a specific time range for which you want to display data in the dashboard. NOTE Time Interval does not affect the Status and Inventory widgets. 1. Click the Scope arrow. 2. Select a duration from the Time Scope list.
7 Dashboard customization • • • • • • • 264 Top Port Discards monitor Top Port Receive EOF monitor Top Port Underflow Errors monitor Top Port Overflow Errors monitor Top Port Runtime Errors monitor Top Port Too Long Errors monitor Top Port Alignment Errors monitor Brocade Network Advisor SAN + IP User Manual 53-1003155-01
Dashboard customization 7 Product Status and Traffic The Product Status and Traffic dashboard provides the following preconfigured status widgets and performance monitors: • • • • • • • • SAN Inventory widget Status widget Events widget Out of Range Violations widget Top Product Memory Utilization monitor Top Product CPU Utilization monitor Top Products with Unused Ports monitor Top Port Utilization Percentage monitor (includes details for all ports, Initiator ports, ISL ports, and Target ports) • Bott
7 Dashboard customization Status widgets The Management application provides the following preconfigured status widgets: • Access Point Status widget — Pie chart view of access point devices categorized by operational and reachability status. • Bottlenecked Ports widget — Table view of bottlenecked ports and number of violations for each bottlenecked port in the SAN. There are four versions of this monitor based on the type of port: All ports, initiator ports, ISL ports, and Target ports.
Dashboard customization 7 • AP7131 — Displays only AP 7131 products. • AP6511 — Displays only AP 6511 products. • AP650 — Displays only AP 650 products. Bottlenecked Ports widget The Bottlenecked Ports widget displays the bottlenecked port violations for the specified fabric and time range in a table. There are four bottlenecked port widgets: All, ISL, Initiator, and Target. The Bottlenecked Ports widget includes the following data: • Widget title — The name of the widget.
7 Dashboard customization Events widget The Events widget (Figure 100) displays the number of events by severity level for a specified time range as a stacked bar graph. FIGURE 100 Events widget The Events widget includes the following data: • Widget title — The name of the widget. • Widget summary — The product count for each status (worst to best order) with the associated icon displays underneath the widget title.
Dashboard customization 7 By default, Syslog events are included in the summary; however, because Syslog events occur at a much higher frequency than other events and therefore could skew the bars for the other events, you can exclude Syslog events. If they are excluded, they will not be displayed in the legend. Users’ selections are persisted (per user per server).
7 Dashboard customization Viewing additional details for the Host Adapter Inventory widget 1. Double-click a bar in the graph. The Host Inventory Detailed View page displays which includes the following data: • Scope — The scope configured for the dashboard. • Product — A product icon and the product name. Click to launch the Product Page (refer to “Product summary view” on page 316). When you launch the Product page, the detailed view closes.
Dashboard customization 7 • Widget summary — The product count for each status (worst to best order) with the associated icon displays underneath the widget title. • Time scope — The time scope. • Category list — Use to customize this widget to display a specific group of products. Options include: Firmware, Model, Product Type, Location, and Contact. • Bar chart — Displays each group as a separate bar on the graph.
7 Dashboard customization IP Status widget The IP Status widget (Figure 102) displays the device status as a pie chart. If you discover a DCB switch from the IP tab, the switch status only displays in the IP Status widget. However, if you discover a DCB switch from the SAN tab, the switch status displays in both the SAN Status and IP Status widgets. FIGURE 102 IP Status widget The IP Status widget includes the following data: • Widget title — The name of the widget.
Dashboard customization 7 Viewing additional IP product data 1. Double-click a section in the IP Status or IP Inventory widgets. The IP Inventory Detailed View page displays with the following fields and components: • Scope — The network and time scope. • Product — A product icon and the product name. Click to launch the Product Page (refer to “Product summary view” on page 316). When you launch the Product page, the detailed view closes.
7 Dashboard customization • Category list — Use to customize this widget to display a specific group of products. Options include: Firmware, Model, Location, and Contact. • Bar chart — The product status as a percentage of the total number of products. The bar chart displays each group as a separate bar on the graph. Displays the current state of all products discovered for a group in various colors on each bar. Tooltips showing the number of devices in that state are shown when you pause on the bar.
Dashboard customization • • • • • • • • 7 Status — The status for the product and the port. Tag — The tag number of the product. Serial — The serial number of the product. Model — The model number of the product. Port Count — The number of ports on the product. Firmware — The firmware version for the product. Location — The physical location of the product. Contact — The name of the person or group you should contact about the product. 2. Click the close (X) button.
7 Dashboard customization • Pie chart — The device status as a percentage of the total number of devices. The pie chart displays the percentage in various colors on each slice. Tooltips showing the number of devices in that state are shown when you pause on the slice. When there is one status category with less than one percent of the total number of devices, the status widget displays the number of devices in each category on each slice.
Dashboard customization 7 VM Alarms widget NOTE Viewing the VM Alarms widget requires discovery of vCenters in the Java client. The VM Alarms widget displays the vCenter alarms for the specified fabric and time range in a table. The VM Alarms widget includes the following data: • • • • Widget title — The name of the widget. VM — Virtual Machine name. Host — Host name.
7 Dashboard customization The MAPS/Fabric Watch widgets display on the main Dashboard tab. The Management application provides the following preconfigured MAPS/Fabric Watch widgets: • Out of Range Violations widget — Table view of all out of range threshold violations reported by your SAN devices and Network OS devices. • Port Health Violations widget — Table view of out of range port health violations.
Dashboard customization 7 NOTE Network OS Fabric Watch violations with appropriate counter values are displayed for Switch Status Policy, FRU Health, Security Violations, Switch Resources, and Port Health categories. Traffic Performance, FCIP Health, Fabric Health, and Virtual Machine Violations categories are not supported and display as blank. • Violation Count — The total number of MAPS and Fabric Watch rule violations for each category. Always displays whether or not there is a violation.
7 Dashboard customization Port Health Violations widget The Port Health Violations widget displays the number of violations for each product based on the selected fabric and a specified time range. There are four port health violation widgets: All, ISL, Initiator, and Target.
Dashboard customization 7 Network OS Fabric Watch violations with appropriate counter values are displayed for the following categories. For SAN violations, the following categories display as blank. • Abnormal Frame Terminations — The number of frames abnormally terminated. • Symbol Errors — The number of undefined or invalid symbols received. • IFG (InterFrame Gap) Errors — The interframe gap between successive frames that is violated.
7 Dashboard customization TABLE 28 Preconfigure performance monitors Monitor title Description Data collectors Top Port Too Long Errors Table view of the too long errors measure All SAN TE port collector Top Port Traffic Table view of the traffic measure All SAN FCIP tunnel collector, All SAN FC port collector, port throughput collector, All SAN TE port collector, Wireless ports collector Top Port Underflow Errors Table view of the underflow errors measure All SAN TE port collector Top Port
Dashboard customization 7 Top Port Alignment Errors monitor The Top Port Alignment Errors performance monitor displays the top ports with alignment errors in a table. The Top Port Alignment Errors performance monitor includes the following data: • Widget title — The name of the widget. • View Details icon — Click to launch the Detailed View page. • Widget summary — The product count for each status (worst to best) displays underneath the widget title. • Top value — The highest value in the table.
7 Dashboard customization Top Port C3 Discards monitor The Top Port C3 Discards monitor displays the top ports with Class 3 frames discarded in a table. There are four port widgets: All, ISL, Initiator, and Target. The Top Port C3 Discards monitor includes the following data: • Widget title — The name of the widget. • View Details icon — Click to launch the Detailed View page. • Widget summary — The product count for each status (worst to best) displays underneath the widget title.
Dashboard customization 7 Top Port C3 Discards RX TO monitor The Top Port C3 Discards RX TO monitor displays the top ports with receive Class 3 frames received at this port and discarded at the transmission port due to timeout in a table. The Top Port C3 Discards RX TO monitor includes the following data: • Widget title — The name of the widget. • View Details icon — Click to launch the Detailed View page.
7 Dashboard customization Top Port CRC Errors monitor The Top Port CRC Errors monitor displays the top ports with frames that contain cyclic redundancy check (CRC) errors in a table. The Top Port CRC Errors monitor includes the following data: • Widget title — The name of the widget. • Widget summary — The product count for each status (worst to best) displays underneath the widget title. • View Details icon — Click to launch the Detailed View page. • Top value — The highest value in the table.
Dashboard customization 7 • Widget title — The name of the widget. • View Details icon — Click to launch the Detailed View page. • Widget summary — The product count for each status (worst to best) displays underneath the widget title. • Top value — The highest value in the table. • Port — The port affected by this monitor. Click to launch the Port Page (refer to “Port summary view” on page 325). When you launch the Port page, the detailed view closes.
7 Dashboard customization • Widget title — The name of the widget. • View Details icon — Click to launch the Detailed View page. • Widget summary — The product count for each status (worst to best) displays underneath the widget title. • Top value — The highest value in the table. • Port — The port affected by this monitor. Click to launch the Port Page (refer to “Port summary view” on page 325). When you launch the Port page, the detailed view closes.
Dashboard customization 7 • Top value — The highest value in the table. • Port — The port affected by this monitor. Click to launch the Port Page (refer to “Port summary view” on page 325). When you launch the Port page, the detailed view closes. • Connected_Port (where Connected_Port is Connected Port, Initiator, or Target) — Displays the address of the port: • RX Errors/sec — The number (error rate) of receive errors per second for the duration specified in the monitor.
7 Dashboard customization Top Port Link Failures monitor The Top Port Link Failures monitor displays the top ports with link failures in a table. The Top Port Link Failures monitor includes the following data: • Widget title — The name of the widget. • View Details icon — Click to launch the Detailed View page. • Widget summary — The product count for each status (worst to best) displays underneath the widget title. • Top value — The highest value in the table.
Dashboard customization 7 Top Port Link Resets monitor The Top Port Link Resets monitor displays the top ports with link resets in a table. The Top Port Link Resets monitor includes the following data: • Widget title — The name of the widget. • View Details icon — Click to launch the Detailed View page. • Widget summary — The product count for each status (worst to best) displays underneath the widget title. • Top value — The highest value in the table. • Port — The port affected by this monitor.
7 Dashboard customization Top Port Overflow Errors monitor The Top Port Overflow Errors performance monitor displays the top ports with overflow errors in a table. The Top Port Overflow Errors performance monitor includes the following data: • Widget title — The name of the widget. • View Details icon — Click to launch the Detailed View page. • Widget summary — The product count for each status (worst to best) displays underneath the widget title. • Top value — The highest value in the table.
Dashboard customization 7 Top Port Receive EOF monitor The Top Port Receive EOF performance monitor displays the top ports with received end-of-frames in a table. The Top Port Receive EOF performance monitor includes the following data: • Widget title — The name of the widget. • View Details icon — Click to launch the Detailed View page. • Widget summary — The product count for each status (worst to best) displays underneath the widget title. • Top value — The highest value in the table.
7 Dashboard customization Top Port Runtime Errors monitor The Top Port Runtime Errors performance monitor displays the top ports with runtime errors in a table. The Top Port Runtime Errors performance monitor includes the following data: • Widget title — The name of the widget. • View Details icon — Click to launch the Detailed View page. • Widget summary — The product count for each status (worst to best) displays underneath the widget title. • Top value — The highest value in the table.
Dashboard customization 7 Top Port Sync Losses monitor The Top Port Sync Losses monitor displays the top ports with synchronization failures in a table. The Top Port Sync Losses monitor includes the following data: • Widget title — The name of the widget. • View Details icon — Click to launch the Detailed View page. • Widget summary — The product count for each status (worst to best) displays underneath the widget title. • Top value — The highest value in the table.
7 Dashboard customization Top Port Too Long Errors monitor The Top Port Too Long Errors performance monitor displays the top ports with frames longer than the maximum frame size allowed errors in a table. The Top Port Too Long Errors performance monitor includes the following data: • Widget title — The name of the widget. • View Details icon — Click to launch the Detailed View page. • Widget summary — The product count for each status (worst to best) displays underneath the widget title.
Dashboard customization 7 Top Port Traffic monitor The Top Port Traffic monitor (Figure 107) displays the top ports with receive and transmit traffic in a table. FIGURE 107 Top Port Traffic monitor The Top Port Traffic monitor includes the following data: • Widget title — The name of the widget. • View Details icon — Click to launch the Detailed View page. • Widget summary — The product count for each status (worst to best) displays underneath the widget title.
7 Dashboard customization • Port Number — The port number. • State — The port state (for example, Enabled). • Status — The port status (for example, Up). 2. Click the close (X) button. Top Port Underflow Errors monitor The Top Port Underflow Errors performance monitor displays the top ports with underflow errors in a table. The Top Port Underflow Errors performance monitor includes the following data: • Widget title — The name of the widget. • View Details icon — Click to launch the Detailed View page.
Dashboard customization 7 2. Click the close (X) button. Top Port Utilization Percentage monitor The Top Port Utilization monitor (Figure 108) displays the top port utilization percentages in a table. FIGURE 108 Top Port Utilization monitor The Top Port Utilization monitor includes the following data: • Widget title — The name of the widget. • View Details icon — Click to launch the Detailed View page.
7 Dashboard customization A more detailed widget displays which includes the following data: • Scope — The scope configured for the dashboard. • Port — The port affected by this monitor. Click to launch the Port Page (refer to “Port summary view” on page 325). When you launch the Port page, the detailed view closes.
Dashboard customization 7 Viewing additional details for the Bottom Port Utilization Percentage monitor 1. Click the View Details icon. FIGURE 111 Bottom Port Utilization Detailed View A more detailed widget displays which includes the following data: • Scope — The scope configured for the dashboard. • Port — The port affected by this monitor. Click to launch the Port Page (refer to “Port summary view” on page 325). When you launch the Port page, the detailed view closes.
7 Dashboard customization Top Product CPU Utilization monitor The Top Product CPU Utilization monitor (Figure 112) displays the top product CPU utilization percentages in a table. FIGURE 112 Top Product CPU Utilization monitor The Top Product CPU Utilization monitor includes the following data: • Widget title — The name of the widget. • View Details icon — Click to launch the Detailed View page. • Widget summary — The product count for each status (worst to best) displays underneath the widget title.
Dashboard customization 7 • Product — The product affected by this monitor. Click to launch the Product page for this device (refer to “Product summary view” on page 316). When you launch the Port page, the detailed view closes. • • • • • • • • • • • • • • Min — The minimum value of the measure in the specified time range. CPU Utilization Percentage — The CPU utilization percentages. Max — The maximum value of the measure in the specified time range. Fabric — The fabric to which the device belongs.
7 Dashboard customization • Memory Utilization Percentage — The top memory utilization percentages. Pause on a rown to display the minimum, current, and maximum vaules for the selected row. This field also displays minimum (black) and maximum (red) pointers. Viewing additional details for the Top Product Memory Utilization monitor 1. Click the View Details icon.
Dashboard customization 7 Top Product Response Time monitor The Top Product Response Time monitor (Figure 116) displays the top product response time in a table. FIGURE 116 Top Product Response Time monitor The Top Product Response Time monitor includes the following data: • Widget title — The name of the widget. • View Details icon — Click to launch the Detailed View page. • Widget summary — The product count for each status (worst to best) displays underneath the widget title.
7 Dashboard customization • Product — The product affected by this monitor. Click to launch the Product page for this device (refer to “Product summary view” on page 316). When you launch the Product page, the detailed view closes. • • • • • • • • • • • • • • Min — The minimum value of the measure in the specified time range. Response Time (ms) — The top response time in milliseconds. Max — The maximum value of the measure in the specified time range. Fabric — The fabric to which the device belongs.
Dashboard customization 7 • Temperature — The top temperatures. Pause on a rown to display the minimum, current, and maximum vaules for the selected row. This field also displays minimum (black) and maximum (red) pointers. • Fabric — The fabric to which the device belongs. Viewing additional details for the Top Product Temperature monitor 1. Click the View Details icon.
7 Dashboard customization Top Products with Unused Ports monitor The Top Products with Unused Ports monitor (Figure 112) displays the top products with ports not in use in a table. FIGURE 120 Top Product CPU Utilization monitor The Top Products with Unused Ports monitor includes the following data: • Widget title — The name of the widget. • View Details icon — Click to launch the Detailed View page.
Inventory • • • • • • • • • • 7 Product Type — The type of product (for example, switch). State — The product state (for example, Offline). Status — The product status (for example, Reachable). Tag — The product tag. Serial # — The serial number of the product. Model — The product model. Port Count — The number of ports on the product. Firmware — The firmware level running on the product. Location — The location of the product. Contact — A contact name for the product. 2. Click the close (X) button.
7 Inventory Inventory expand navigation bar The Inventory expand navigation bar (Figure 97) is located on the left side of the page and provides a list of discovered fabric and products. FIGURE 122 Expand navigation bar The expand navigation bar contains the following components: • Fabrics — List of discovered fabrics and products. Click a fabric to display the Fabric Page in the center pane (“Fabric summary view” on page 310). Click the expand arrow to display the products in the fabric.
Inventory 7 FIGURE 123 Fabric summary 3. Review the fabric summary data. FIGURE 124 Fabric Page area The Fabric Page area contains the following fields and components: • • • • Show/Hide pane arrow — Click to show or hide the Product List pane. Fabric Page — Displays the name of the selected fabric. Refreshed time — Displays the time of the last application update. Show/Hide pane arrow — Click to show or hide the Properties pane.
7 Inventory • • • • • • • Tag — Displays the tag number of the product. Serial # — Displays the serial number of the product. Model — Displays the model number of the product. Port Count — Displays the number of ports on the product. Firmware — Displays the firmware version of the product. Location — Displays the physical location of the product. Contact — Displays the name of the person or group you should contact about the product.
Inventory • • • • • • • 7 Collapse/Expand button — Click to collapse or expand the view. All — Displays the number of targets in the fabric. Port Name — Displays the port name. Connected Switch — Displays the name of the switch connected to the port. Symbolic Name — Displays the symbolic name (nickname) for the HBA port. Port Type — Displays the port type; for example, N_Port. Host Name — Displays the name of the host. The first three digits indicate the host’s operating system; for example, WIN or LIN.
7 Inventory • • • • Time — Displays the time and date the event last occurred on the server. Description — Displays a description of the event. Source Name — Displays the product on which the event occurred. Source Address — Displays the IP address (IPv4 or IPv6 format) of the product on which the event occurred. • Category — Displays the type of event that occurred (for example, client/server communication events). • • • • • 314 Count — Displays the number of times the event occurred.
Inventory 7 Viewing fabric properties To view fabric properties, complete the following steps. 1. Click the Inventory icon. 2. Select a fabric in the Product List pane. The fabric summary displays with two panes: Fabric Page and Properties. The fabric properties displays on the right side of the page. FIGURE 129 Fabric Properties pane The fabric properties pane contains the following fields: • Highlights area - Name — Displays the name of the selected fabric.
7 Inventory Product summary view The Product summary displays the Product List, summary, and properties panes for the selected product. Viewing the product summary To view product properties, complete the following steps. 1. Click the Inventory icon. 2. Select a product in the Product List pane. The product summary displays with two panes: Product Page and Properties. FIGURE 130 Product summary 3. Review the product summary data.
Inventory 7 FIGURE 132 Product Performance area The Product Performance area displays the following information for the selected product: • Collapse/Expand button — Click to collapse or expand the view. • Avg. CPU Utilization — Displays the average percentage of CPU utilization in graphical format. • Avg. Memory Utilization — Displays the average percentage of memory utilization in graphical format. • Up Time (in days) — Displays the number of days the product has been up and running.
7 Inventory • Show/Hide Legend button — Click to show or hide the performance graph legend. • Close Performance button — Click to close the performance graph or table. • Update button — Select or clear the ports in the table and click to update the graph or table. • Settings button — Click to change the port measure selection you want to include in the graph or table or to change the time scope for the graph or table.
Inventory 7 • Graph button — Click to show the performance data in a graph. The x-axis displays the time scope you selected. The y-axis display depends on the flow measure you selected. • Table button — Click to show the performance data in a table. The table includes the flow measures you selected and the time the flow measure was collected. • Unnamed check box — Select the check box for each flow you want to include in the graph.
7 Inventory The Violations table displays the Monitoring and Alerting Suite (MAPS) violations for the product over the selected time duration. • • • • • Collapse/Expand button — Click to collapse or expand the view. Time — Displays the time on the server when the violation was reported. Rule Condition — Displays the conditions defined in the MAPS policy that was triggered. Product — Displays the name of the product.
Inventory 7 • Info icon — Displays the total number of Information events triggered. Click to only display Information events in the table. • Debug icon — Displays the total number of Debug events triggered. Click to only display Debug events in the table. • Severity — Displays the severity icon for the event. When the same event (Warning or Error) occurs repeatedly, the Management application automatically eliminates the additional occurrences.
7 Inventory FIGURE 136 Settings dialog box 5.
Inventory 7 • 3 Days — Displays data for 3 days. • 1 Week — Displays data for 1 week. • 1 Month — Displays data for 30 days. 7. Click Apply. The port performance graph displays in the Port Details area. 8. Add ports to the graph by selecting the check box for each port you want to include in the graph. Select the check box in the table header to select all ports in the table. Remove ports from the graph by clearing the check box. 9. Click Update.
7 Inventory 7. Click Apply. The Flows performance graph displays in the Flows area. 8. Add flows to the graph by selecting the check box for each flow you want to include in the graph. Select the check box in the table header to select all flows in the table. Remove flows from the graph by clearing the check box. 9. Click Update. Viewing product properties To view product properties, complete the following steps. 1. Click the Inventory icon. 2. Select a product in the Product List pane.
Inventory • • • • • • • • • • • • • • • • • • 7 Name — Displays the name of the product. System Name — Displays the system name of the product. Fabric — Displays the fabric name in which the product is located. IP Address — Displays the IP address of the product. WWN — Displays the WWN of the product. Product Type — Displays the type of product. VCS Mode — Displays whether VCS mode is enabled or disabled. VCS ID — Displays the VCS identifier.
7 Inventory 1. Click the Inventory icon. 2. Select a product in the Product List pane. The product summary displays with two panes: Product Page and Properties. 3. Click the port link in the Port Details area. The port summary displays with two panes: Port Page and Properties. FIGURE 138 Port summary 4. Review the port summary data. The Ports Details area displays the following data for the selected product: • Collapse/Expand button — Click to collapse or expand the view.
Inventory 7 The Flows area displays the following data for the selected product: • Collapse/Expand button — Click to collapse or expand the view. • All — Displays the number of flows defined for the selected product. • Show Performance button — Select a flow in the table and click to show the performance graph or table. To configure a graph or table, refer to “Configuring a flows performance graph” on page 323. • • • • • Performance graph/table — Displays the performance data when configured.
7 Inventory FIGURE 139 Violations table The Violations table displays the Monitoring and Alerting Suite (MAPS) violations for the product over the selected time duration. • show arrow — Click to display the following additional detail for the associated violation: - Time — Displays the time on the server when the violation was reported. - Product — Displays the name of the product. - Object Name - Rule Condition — Displays the conditions defined in the MAPS policy that was triggered.
Inventory • • • • 7 - Fabric Name — Displays the Fabric name to which the object belongs. - Rule Name — Displays the name of the rule. A rule associates a condition with actions that need to be triggered when the specified condition is evaluated to be true. Category — Displays the MAPS category (such as Port, Switch Status, Fabric, FRU, Security, Resource, FCIP, and Traffic/Flows). Time — Displays the time on the server when the violation was reported.
7 Inventory FIGURE 140 Port Properties pane 4. Review the port properties data. The port Properties pane displays on the right side of the page. For FC and GigE port properties, the Highlights area displays the following data for the selected port. • • • • • • • • • Fabric — Displays the IP address of the fabric. Switch — Displays the name of the switch. Name — Displays the port name. Slot/Port# — Displays the slot and port number. User Port# — Displays the number of the user port.
Events • • • • Port Type — Displays the type of port, for example, U_port. • • • • • • • • Forward Error Correction(FEC) — Displays whether FEC is enabled or disabled. 7 Port WWN — Displays the port’s world wide name. Protocol — Displays the network protocol, for example, Fibre Channel. Long Distance Settings — Displays whether the connection is considered to be normal or longer distance. Encryption — Displays whether encryption is enabled or disabled.
7 Events FIGURE 141 Events page The Events page contains the following fields and components: • Scope — Only displays when you access this page from the Events widget. Displays the network scope and time scope configured for the dashboard. Click Clear Scope to clear the network and time scope and display all events. • All — Displays the total number of events triggered. • Emergency icon — Displays the total number of Emergency events triggered. Click to only display Emergency events in the table.
Reports 7 • Message ID — Displays the message ID of the event. • Fabric Name — Displays the name of the fabric on which the event occurred. • Port Name — Displays the name of the on which the event occurred. Table functions • Sort — Click a column head to sort the list. Click a column head again to reverse the sort orders. • Navigate through the table by using the following icons at the bottom of the table.
7 Reports FIGURE 142 Reports page The Reports page has three tabs: 1. Reports tab — Displays generated reports. Enables you to view generated reports. 2. Schedules tab — Displays configured schedules. Enables you to configure or delete schedules. 3. Templates tab — Displays default and custom report templates. Enables you to configure templates, generate reports, export reports, and import reports.
Reports 7 4. Imported Templates list — List of any external report design (.rptdesign) files you imported into the Management application. Reports toolbar The toolbar is located on the upper right side of each tab and provides buttons and fields to perform various functions. The buttons and fields that display in the toolbar change based on the selected tab.
7 Reports FIGURE 144 Select Fabric dialog box FIGURE 145 Select Switch dialog box 3. Double-click the fabric or switch in the Available list to move it to the Selected list. You can only select one fabric or switch on which you want to run a report. Remove the fabric or switch from the Selected list by double-clicking the fabric or switch. 4. Click OK. When report generation is complete, the report displays in a new browser tab and a new entry displays in the Generated Reports tab.
Reports 7 Generated reports The Reports tab provides quick access to all generated reports. Generated Reports toolbar The toolbar is located on the upper right side of the tab and provides buttons and fields to perform various functions. FIGURE 146 Generated Reports toolbar 1. Delete button — Select one or more reports that you want to remove from the list and click to delete. You can only delete reports that you generate.
7 Reports Downloading a generated report You can download data from a report to CSV, PDF, or XLS. 1. Run a report (refer to “Generating a report” on page 335). 2. Select the report in Generated Reports tab and click Download on the Generated Reports toolbar. The Export Report dialog box displays. 3. Select an export format (PDF or Word) from the Export Format list. • PDF -— Portable Document Format • XLS — Excel spreadsheet • CSV — comma-separated values 4. Click OK on the Export Report dialog box.
Reports 7 3. Delete button — Select one or more schedules that you want to remove from the list and click to delete. You can only delete schedules that you generate. For step-by-step instructions, refer to “Deleting reports, schedules, or templates” on page 338. 4. Activate button — Click to activate a report schedule. For step-by-step instructions, refer to “Activating a schedule” on page 344. 5. Deactivate button — Click to deactivate a report schedule.
7 Reports FIGURE 149 Add Schedule dialog box - General tab 4. Enter a unique name for the schedule in the Name field. The name can be up to 128 characters. 5. Select the report templates that you want to include in the schedule from the Available Templates list. 6. Click Add. 7. Select a report in the Selected Templates and Criteria list. Depending on the reports you selected, you may need to enter parameters.
Reports 7 FIGURE 150 Add Schedule dialog box - Schedule Settings tab 10. Select the frequency (Hourly, Daily (default), Weekly, Monthly, and Yearly) from the Frequency list. Depending on the frequency you select, different date and time fields display. 11. Enter the time (hour and minutes) that you want to generate the report in the Time field. 12. Enter the date that you want to generate the report in the Date field. 13. Select the format (PDF, XLS, or CSV) for the report from the Format list.
7 Reports FIGURE 151 Select Fabric dialog box 3. Double-click the fabric that you want to include in the report. 4. Click Ok on the Select Fabric dialog box. Selecting switches The Switch Report requires that you select a switch from a list of discovered switches. 1. Select one of the Switch reports in the Selected Templates and Criteria list. 2. Click Choose Switch. The Select Switch dialog box displays.
Reports 7 3. Double-click the switch that you want to include in the report. 4. Click Ok on the Select Switch dialog box. Viewing reports from a schedule 1. Click the Reports icon. 2. Click the Schedule tab. 3. Click the date and time of the reports in the Last Used column. The Last Run Reports for Schedule dialog box displays. 4. Click the name of the report you want to view from the list of reports in the schedule. The report launches in a new browser tab.
7 Reports 4. Configure a new schedule from an existing schedule by entering a unique name for the schedule in the Name field. The name can be up to 128 characters. 5. Select the report templates that you want to include in the schedule from the Available Templates list and clicking Add. Remove a report template from the schedule by selecting it in the Selected Templates and Criteria list and clicking Remove. 6. Select a report in the Selected Templates and Criteria list.
Reports 7 Deactivating a schedule To deactivate a schedule, complete the following steps. 1. Click the Reports icon. 2. Click the Schedules tab. A list of scheduled reports display. 3. Select the schedule you want to suspend and click Deactivate. Report templates The Templates page enables you to run, import, export, share, or delete reports. Templates toolbar The toolbar is located on the upper right side of the tab and provides buttons and fields to perform various functions.
7 Reports • Unnamed check box — Use to select a template. • Title — Displays the title of the report, which must be unique. Click to launch the selected report. For step-by-step instructions, refer to “Viewing a report” on page 346 • Data — Displays the date and time the report was last run. • Generated By — Displays the user (for example, System or Administrator) who modified the report last. • Shared icon — Displays whether the report is shared or not.
Reports 7 3. Select a report and click Export. The Save dialog box displays. If you want to change the name of the report, change the name of the file in the File Name field. 4. Browse to the location to which you want to export the report and click Save. If a report with the same file name already exists, click Yes on the overwrite message to overwrite the report. When the export is complete, click OK on the successful export message. Importing report templates You can import external report design (.
7 Reports Default reports The Management application web client provides default reports for both SAN and IP products. Presenting and archiving data about a network is equally as important as gathering the data. Through the web client, you can generate reports about the network. You can send the reports to network administrators, support consultants, and others interested in the network’s architecture, or archive the reports for future reference.
Reports TABLE 29 7 Fabric Summary report fields and components (Continued) Field/Component Description AG Port Count The number of ports on AG devices in the fabric. Location The location of the fabric. Description The description of the fabric. Contact The name of the person or group you should contact about the fabric. Discovered Time The date and time the fabric was discovered. Last Changed Time The date and time when there was a change in the fabric.
7 Reports TABLE 29 Fabric Summary report fields and components (Continued) Field/Component Description Node WWN The world wide name of the node. Port WWN The world wide name of the port. FC Address The FC address of the device. User Defined Device Name The user-defined device name for the switch. User Defined IP Address The user-defined IP address for the switch. Location The location of the switch. Contact The name of a contact person for the switch.
Reports TABLE 29 7 Fabric Summary report fields and components (Continued) Field/Component Description Switch WWN The world wide name of the virtual switch. Switch IP Address The IP address of the physical switch. Click to launch the Switch report. Port Name The port name. Port WWN The world wide name of the port. FC Address The FC address of the port. Domain ID The domain ID of the switch. Port Index The port index of the IFL port on the backbone or edge switch.
7 Reports TABLE 29 Fabric Summary report fields and components (Continued) Field/Component Description Port Type The AG port type. Physical/Logical Port Whether the AG port is Physical or Logical. Device Name The name of the connected device. Device Vendor The vendor of the connected device. Role The role of the connected device. Node WWN The node WWN of the connected device. Port WWN The port WWN of the connected device. IP Address The IP address of the backbone switch.
Reports TABLE 30 7 Fabric Ports report fields and components (Continued) Field/Component Description Fabric Ports/AG Port Details table IP Address The IP address of the switch. Switch Name The name of the switch. Click to launch the Switch Report. Domain ID/ Port # The domain ID and port number of the switch. Zone Whether the zone is online or offline. Connected Device Details about the connected device. Device Name The name of the connected device.
7 Reports TABLE 30 Fabric Ports report fields and components (Continued) Field/Component 354 Description Switch WWN The switch WWN of the AG. Slot #/Port # The slot and port number of the AG (typically the F_port). Port Index The port index for the F_port. Port Speed(Gbps) The port speed for the F_port. Port Status The switch port status. Port State The switch port state. Port Type The AG port type. Physical/Logical Port Whether the AG port is Physical or Logical.
Reports 7 Switch Report The Switch Report provides a information about the selected switch and ports. Table 31 describes the fields and components of the Switch Report. For general report content and table functions, refer to “Report content and functions” on page 361. TABLE 31 Switch Report fields and components Field/Component Description Switch Details table Name The name of the switch. WWN The world wide name of the switch.
7 Reports TABLE 31 Switch Report fields and components (Continued) Field/Component Description Connected Device/ Switch WWN The world wide name of the connected device. Port Name The port name of the connected device. Port Speed (GBPS) The port speed in gigabits per second. Port Status The port status. For example, Online, Offline, No light and so on. Port State The port state. For example, Online or Offline. Port Type The port type. For example, F-Port, L-Port, and so on.
Reports TABLE 31 7 Switch Report fields and components (Continued) Field/Component Description Role The role of the connected device. Node WWN The node WWN of the connected device. Port WWN The port WWN of the connected device. IP Address The IP address of the backbone switch. Switch WWN The switch WWN of the backbone switch. Switch Name The switch name of the backbone switch. Domain ID The domain ID of the switch to which the AG is connected.
7 Reports TABLE 32 Zoning Summary report fields and components (Continued) Field/Component Description WWN Members For zone_name/alias_name The name of this area is based on the zone name or alias name. Member Properties Logged In Whether the zone member is logged in or not. Port Name The port name. Port WWN The world wide name of the port. Node Name The node name. Node WWN The world wide name of the node. Connected Switch Properties Switch Name The name of the connected switch.
Reports TABLE 33 7 Host Adapter Inventory Report fields and components (Continued) Field/Component Description Server Location The server’s location. Server Contact A contact name for the server. Server Description A description of the server. HCM Agent/ CIM Provider Version The version of the Host Connectivity Manager (HCM) application and the CIM provider. Adapter Name The adapter’s name. Adapter HCM Name The adapter’s HCM name. Adapter Node The adapter’s node name.
7 Reports Host Adapter with Unsupported and Faulty SFP reports The Adapters Faulty SFP report lists all Brocade adapters with unsupported or faulty small form-factor pluggable (SFP) transceivers. This report is only available for Brocade adapters. For adapters with unsupported SFPs, this report is the same as the Adapters Inventory report filtered to show only those hosts with adapter ports that have unsupported SFPs.
Reports TABLE 34 7 Adapters Faulty SFP report fields and components (Continued) Field/Component Description Temperature (c) The port temperature, measured in Celsius. Bias Current (mA) The low-level DC current (the Bias Current), measured in mA. Tx Power (mW) The transmitted power, measured in mW. Rx Power (mW) The received power, measured in mW. Voltage (V) The voltage; for example, 1.8V, 3.3V, or 5.0V. Alarm/Warning Indicates whether an alarm has been triggered.
7 Reports Exporting data from the report You can export data from a report to CSV, PDF, or XLS. 1. Run a report (refer to “Generating a report” on page 335). 2. From the report, click the Export Report icon on the Report toolbar. The Export Report dialog box displays. 3. Select an export format (PDF or Word) from the Export Format list. • PDF -— Portable Document Format • XLS — Excel spreadsheet • CSV — comma-separated values 4.
Chapter 8 Dashboard Management In this chapter • Dashboard overview . . . . . . . . . . . . . . . . . . . . . . . . . . . . . . . . . . . . . . . . . . . • Default dashboards . . . . . . . . . . . . . . . . . . . . . . . . . . . . . . . . . . . . . . . . . . . . • Status widgets . . . . . . . . . . . . . . . . . . . . . . . . . . . . . . . . . . . . . . . . . . . . . . . . • Monitoring and Alerting Policy Suite/Fabric Watch widgets . . . . . . . . . . . . • Performance monitors . . . . . . . . . . . . .
8 Dashboard overview FIGURE 154 Dashboard tab 1. Menu bar — Lists commands you can perform on the dashboard. For a list of Dashboard tab menu commands, refer to “Dashboard main menus” on page 2101. The dashboard also provides a shortcut menu to reset the dashboard back to the defaults. Reset the dashboard back to the default settings by right-clicking in the white space and selected Reset to Default. 2. Toolbar — Provides buttons that enable quick access to dialog boxes and functions.
Dashboard overview 8 9. Status bar — Displays the connection, port, product, fabric, special event, Call Home, and backup status, as well as Server and User data. For more information about the status bar, refer to “Status bar” on page 480. Dashboard toolbar The toolbar (Figure 155) is located beneath the menu bar and provides icons and buttons to perform various functions. FIGURE 155 Toolbar The toolbar contains the following icons and buttons: 1.
8 Dashboard overview Dashboard messages The dashboard message bar (Figure 156) only displays when Scope (Network Scope and Time Scope) has changed in other clients. You can also view all dashboard messages and clear them. FIGURE 156 Dashboard message bar The toolbar contains the following fields and components: 1. Details button — Use to view dashboard messages. 2. Close button — Use to close the dashboard message bar.
Dashboard overview 8 6. Options button — Use to share, unshare, export, and import a user-defined dashboard. For more information, refer to “Sharing a user-defined dashboard definition” on page 369, “Unsharing a user-defined dashboard definition” on page 370, “Exporting a user-defined dashboard definition” on page 370, and “Importing a user-defined dashboard definition” on page 371.
8 Dashboard overview Accessing a dashboard From the Dashboards expand navigation bar, double-click the dashboard you want to view. Options include: • IP Port Health — Displays preconfigured IP performance monitors. You can display additional status widgets and performance monitors in this dashboard. • Product Status and Traffic — Displays preconfigured status widgets and performance monitors. You can display additional widgets and monitors in this dashboard.
Dashboard overview 7. 8 Press Enter. The filter results display in the Dashboards expand navigation bar. To stop the filter, click the stop filter (X) icon in the Filter text box. Creating a user-defined dashboard You can create a dashboard and customize it with the status widgets and performance monitors you need to monitor your network. 1. Click the Dashboards expand navigation bar. 2. Click Add. The Add Custom Dashboard dialog box displays. 3. Enter a name and description for the dashboard.
8 Dashboard overview 1. Click the Dashboards expand navigation bar. 2. Select a user-defined dashboard you want to share under My Dashboard, click Options and then select Share. The following message displays: “The selected dashboard will be shared with all users”. 3. Click OK. The selected user-defined dashboard is shared with all users and is displayed with a shared icon. NOTE You cannot share default dashboards and shared dashboards.
Dashboard overview 8 Importing a user-defined dashboard definition You can import a user-defined dashboard definition from the file system to the Management application. 1. Click the Dashboards expand navigation bar. 2. Select a user-defined dashboard you want to share under Dashboard, click Options, and then select Import. The Import dialog box displays. 3. Browse the path and click Select. A successfully imported information message displays. 4. Click OK.
8 Dashboard overview 4. Click the Performance tab (Figure 158). The preconfigured performance monitors display. You can create up to 100 performance monitors; however, you can only display up to 30 performance monitors. For more information about performance monitors, refer to “Performance monitors” on page 402. FIGURE 158 Customize Dashboard dialog box, Performance tab 5. Select the Display check box in the Performance Monitors list for each performance monitor you want to add to the dashboard.
Dashboard overview 8 Exporting the dashboard display You can export the current dashboard display (all widgets and monitors) or a selected widget or monitor in a .png format. 1. Select one of the following options from the Export list: • Dashboard — Exports the current dashboard. • Name — Exports the selected widget (where Name is the name of the widget or monitor on the dashboard). The Export Dashboard to PNG File or Export Name to PNG File dialog box displays. 2.
8 Dashboard overview Customizing the dashboard scope You can customize the dashboard display by setting the network scope and time scope in the Scope list (Figure 159). . FIGURE 159 Scope list Setting the network scope You can configure the dashboard to display all objects in your area of responsibility (AOR) or a subset of objects (fabrics, devices, or groups) using the network scope selection. Default network scopes are visible to all users.
Dashboard overview 8 The available network scopes include the following list of options: • • • • • • All Any SAN fabric Any Ethernet fabric Any system-defined group Any user-defined group (IP product and port group) Any user-defined customized network If you select a fabric scope, dashboard widgets display data for all products and ports in the fabric. If you select a product scope, dashboard widgets display data for the selected products and the ports that belong to the selected products.
8 Dashboard overview FIGURE 160 Edit Scopes dialog box 4. Click Add. A new network scope displays in the Network Scopes list. 5. Enter a name for the scope in the Name field. 6. Select one of the following options: • Fabrics — Select to create your network from one or more fabrics. • Products — Select to create your network from one or more products or product groups. • Ports — Select to create your network from one or more ports or port groups. 7.
Dashboard overview 8 The objects display in the Selected Targets list. 6. To remove an object from the Selected Targets list, select it and click the left arrow button. 7. Click OK to save your changes and close the Edit Scopes dialog box. Deleting a user-defined network scope You can delete any user-defined network scope. 1. Click the Scope list. 2. Click Manage Network Scopes. The Edit Scopes dialog box displays with a list of existing user-defined network scopes in the Network Scopes list. 3.
8 Dashboard overview FIGURE 161 Historical mode message bar You can click View current data on the message bar to view the current data. If you select the Stay current option, all the widgets will start refreshing data in the configured auto-refresh interval. Use the spin box to select a specific time for the selected date. NOTE If the start date is within 8 days of the current date, then the granularity of the spin box will be 5 minutes.
Dashboard overview 8 If you click the Rewind or Forward button for the first time, data refresh will be in 1x speed with 5 minutes or 30 minutes granularity based on the time scope. For example, consider the current time as September 9, 2013, 7:00 AM. In the Scope list, if you set the duration as 30 minutes and the time scope as September 9, 2013, 6:15 AM, data will be displayed for all the applicable widgets based on the given time range (September 9, 2013, 5:45 AM to September 9, 2013, 6:15 AM).
8 Default dashboards Default dashboards The Management application provides preconfigured dashboards which provide high-level overview of the network, the current states of managed devices, and performance of devices, ports, and traffic on the network.
Status widgets • • • • • • • 8 Top Port Discards monitor Top Port Receive EOF monitor Top Port Underflow Errors monitor Top Port Overflow Errors monitor Top Port Runtime Errors monitor Top Port Too Long Errors monitor Top Port Alignment Errors monitor Status widgets The Management application provides the following preconfigured status widgets: • Access Point Status widget — Pie chart view of access point devices categorized by operational and reachability status • Bottlenecked Ports widget — Table vi
8 Status widgets Access Point Status widget The Access Point Status widget displays the access point (AP) status as a pie chart. FIGURE 162 Access Point Status widget The Access Point Status widget includes the following data: • Severity icon/product count/widget title — The color of the worst status followed by the product count with that status displays before the widget title. • Show list — A list of available managed AP products.
Status widgets 8 Accessing additional data from the Access Point Status widget Double-click a section in the Access Point Status widget to navigate to a filtered view of the AP Products report. Bottlenecked Ports widget The Bottlenecked Ports widget (Figure 163) displays the bottlenecked port violations for the specified fabric and time range in a table. There are four bottlenecked port widgets: All, ISL, Initiator, and Target.
8 Status widgets • Violation Count — The number of bottleneck violations for the port during the selected time range. This is based on bottleneck configuration. Each trap or alert sent by the switch and the Management application counts as one violation. For more information, refer to “Bottleneck detection” on page 1633. - Congestion — The number of bottleneck violations caused due to congestion for the port during the selected time range.
Status widgets 8 FIGURE 164 Bottleneck Graph dialog box The Bottleneck Graph dialog box displays event information for a specific duration by selecting one of the following from the time period: • If the dashboard time period is 30 minutes, then the Display Range is 30 minutes and the Display Interval is 60 seconds. • If the dashboard time period is one hour, then the Display Range is 60 minutes and the Display Interval is 300 seconds.
8 Status widgets Events widget The Events widget (Figure 165) displays the number of events by severity level for a specified network scope, specified time scope, and duration as a stacked bar graph. FIGURE 165 Events widget The Events widget includes the following data: • Severity icon/widget title/event count — The color of the worst severity followed by the event count with that severity displays before the widget title.
Status widgets 8 The x-axis represents the number of occurrences of a particular event severity during the selected time period. If you pause on a bar, a tooltip shows the number of events with that severity level during the selected time period. Also, for each severity, the cumulative number of traps, application events, and security events is reported next to the horizontal bar. If Syslog messages are included, then they are included in the count.
8 Status widgets • Severity icon/Host product count/widget title — The color of the worst severity and the Host product count with that severity displays before the widget title. • Group By list — Use to customize this widget to display a specific grouping. Options include: Model (default), Location, Driver, BIOS, and OS Type. • Bar chart — Displays each group as a separate bar on the graph. Displays the current state of all Host products discovered for a group in various colors on each bar.
Status widgets 8 FIGURE 167 IP Inventory widget The IP Inventory widget includes the following data: • Severity icon/product count/widget title — The color of the worst severity followed by the IP product count with that severity displays before the widget title. • Group By list — Use to customize this widget to display a specific group of products. Options include: Firmware, Model, Product Type, Location, and Contact. • Bar chart — Displays each group as a separate bar on the graph.
8 Status widgets • Zoom in on an area of the widget by dragging the mouse (upper left corner to lower right corner) to select one or more bars. NOTE If the ratio between the longest and shortest bar reaches 5000:1, you should maximize the widget prior to using zoom. To return the widget to its original state, reverse the selection (drag from lower right corner to upper left corner).
Status widgets 8 • Pie chart — The device status as a percentage of the total number of devices. The pie chart displays the percentage in various colors on each slice. Tooltips showing the number of devices in that state are shown when you pause on the bar. When there is one status category with less than one percent of the total number of devices, the status widget displays the number of devices in each category on each slice.
8 Status widgets • Contact — The name of the person or group you should contact about the product. This field is editable at the fabric level. 2. Right-click any row in the table to access the corresponding shortcut menu for the device. For more information about shortcut menus, refer to “IP shortcut menus” on page 2134. 3. Click Close. SAN Inventory widget The SAN Inventory widget (Figure 169) displays the SAN products inventory as stacked bar graphs.
Status widgets 8 • Bar chart — The product status as a percentage of the total number of products. The bar chart displays each group as a separate bar on the graph. Displays the current state of all products discovered for a group in various colors on each bar. Tooltips showing the number of devices in that state are shown when you pause on the bar.
8 Status widgets NOTE It takes a few moments to populate newly discovered products in the SAN Products - Status dialog box (where Status is the section of the widget you selected). SAN Status widget The SAN Status widget (Figure 170) displays the device status as a pie chart. If you discover a DCB switch from the SAN tab, the switch status displays in both the SAN Status and IP Status widgets. However, if you discover a DCB switch from the IP tab, the switch status only displays in the IP Status widget.
Status widgets 8 Accessing additional data from the SAN Status widget Double-click a section in the SAN Status widget to navigate to the SAN Products - Status dialog box (where Status is the section of the widget you selected). For more information, refer to “Viewing additional SAN product data” on page 395. NOTE It takes a few moments to populate newly discovered products in the SAN Products - Status dialog box (where Status is the section of the widget you selected).
8 Status widgets Status widget The Status widget (Figure 171) displays the number of products managed and the number of events within the selected event time range, as well as various IP management processes and their current states. FIGURE 171 Status widget The Status widget displays the following items for each product license: • • • • • • • • • Fibre Channel Fabrics — The number of managed fabrics. SAN Switches — The number of managed SAN switches.
Monitoring and Alerting Policy Suite/Fabric Watch widgets 8 The VM Alarms widget displays the vCenter alarms for the specified fabric and time range in a table. The VM Alarms widget includes the following data: • • • • Severity icon/widget title — The worst severity of the data shown next to the widget title. VM — Virtual Machine name. Host — Host name. Total — Number of alarms triggered by the following violations: VM disk aborts, VM disk resets, VM disk usage (kbps), and VM total disk latency (ms).
8 Monitoring and Alerting Policy Suite/Fabric Watch widgets The widget also includes the Fabric Watch threshold violations for devices running Network OS 3.0.0 or later or Fabric OS 6.4.0 or later with the Fabric Watch license or FC devices running Fabric OS 7.2.0 or later with the Fabric Vision license, but not migrated to MAPS. The MAPS/Fabric Watch widgets display on the main Dashboard tab.
Monitoring and Alerting Policy Suite/Fabric Watch widgets 8 • Category — A list of the MAPS and Fabric Watch dashboard categories. Always displays whether or not there is an associated violation.
8 Monitoring and Alerting Policy Suite/Fabric Watch widgets • Double-click the Port Health category row (or right-click and select Port Health Violations) to navigate to the Port Health Violations widget. For more information, refer to “Port Health Violations widget” on page 400. • Double-click the Virtual Machine Violations category row to navigate to the VM Alarms widget. For more information, refer to the “VM Alarms widget” on page 396.
Monitoring and Alerting Policy Suite/Fabric Watch widgets 8 • Violation Count — The number of MAPS and Fabric Watch rule violations for the port. • CRC Errors — The number of times an invalid cyclic redundancy check error occurs on a port or a frame that computes to an invalid CRC. • • • • • • Invalid Tx Words — The number of times an invalid transmission word error occurs on a port. Loss of sync — The number of times a synchronization error occurs on the port.
8 Performance monitors • Right-click any row and select Locate to locate the particular device to which the port belongs in the Network Objects products list. • Double-click a row to navigate to the Violations dialog box. Performance monitors The performance monitors provide a high-level overview of the performance on the network. This allows you to easily check the performance of devices, ports, and traffic on the network.
Performance monitors TABLE 37 8 Preconfigure performance monitors Monitor title Description Data collectors Top Port Link Resets Table view of the top port link resets. There are four versions of this monitor based on the type of port: All ports, initiator ports, ISL ports, and Target ports.
8 Performance monitors Displaying performance monitors on the dashboard 1. From the Dashboards expand navigation bar, double-click the desired dashboard. The selected Dashboard displays. 2. Click the Customize Dashboard icon. The Customize Dashboard dialog box displays. 3. Select the check box in the Display column for each performance monitor you want to display on the Dashboard. 4. Click OK.
Performance monitors 8 Accessing additional data from top or bottom port monitors • Double-click a row or right-click a row and select Show Graph/Table to navigate to the Historical Graphs/Tables dialog box for the selected measures. For more information, refer to “Performance Data” on page 1601. Top Port C3 Discards monitor The Top Port C3 Discards monitor (Figure 174) displays the top ports with Class 3 frames discarded in a table. There are four port widgets: All, ISL, Initiator, and Target.
8 Performance monitors • • • • • • Type — The type of port (for example, U-Port). Identifier — The port identifier. Port Number — The port number. State — The port state (for example, Enabled). Status — The port status (for example, Up). Refreshed — The time of the last update for the monitor. To customize the monitor to display data by a selected time frame as well as customize the display options, refer to “Editing a preconfigured performance monitor” on page 431.
Performance monitors 8 • Connected_Port_Link (where Connected_Port_Link is Connected Port, Initiator, or Target) — Displays one of the following: - Connected Port — The ISL or IFL port on the connected device. Click to launch the switch port properties dialog box. - Initiator — The initiator port on the connected device. Click to launch the device properties dialog box. - Target — The target port on the connected device. Click to launch the device properties dialog box.
8 Performance monitors Top Port CRC Errors monitor The Top Port CRC Errors monitor (Figure 176) displays the top ports with frames that contain cyclic redundancy check (CRC) errors in a table. FIGURE 176 Top Port CRC Errors monitor The Top Port CRC Errors monitor includes the following data: • Severity icon/monitor title — The worst severity of the data based on the error count shown next to the monitor title. • Port — The port affected by this monitor.
Performance monitors • • • • 8 Port Number — The port number. State — The port state (for example, Enabled). Status — The port status (for example, Up). Refreshed — The time of the last update for the monitor. To customize the monitor to display data by a selected time frame as well as customize the display options, refer to “Editing a preconfigured performance monitor” on page 431.
8 Performance monitors • Connected_Port_Link (where Connected_Port_Link is Connected Port, Initiator, or Target) — Displays one of the following: - Connected Port — The ISL or IFL port on the connected device. Click to launch the switch port properties dialog box. - Initiator — The initiator port on the connected device. Click to launch the device properties dialog box. - Target — The target port on the connected device. Click to launch the device properties dialog box.
Performance monitors 8 Top Port Encode Error Out monitor The Top Port Encode Error Out monitor (Figure 178) displays the top ports with encoding errors outside of frames in a table. FIGURE 178 Top Port Encode Error Out monitor The Top Port Encode Error Out monitor includes the following data: • Severity icon/monitor title — The worst severity of the data based on the error count shown next to the monitor title. • Port — The port affected by this monitor.
8 Performance monitors • Status — The port status (for example, Up). • Refreshed — The time of the last update for the monitor. To customize the monitor to display data by a selected time frame as well as customize the display options, refer to “Editing a preconfigured performance monitor” on page 431. Accessing additional data from the Top Port Encode Out Errors monitor • Right-click a row in the monitor to access the shortcut menu available for the associated device.
Performance monitors 8 • RX Errors/sec — The number (error rate) of receive errors per second for the duration specified in the monitor. • RX Errors — The number (error count) of receive errors. • TX Errors/sec — The number (error rate) of transmit errors for the duration specified in the monitor. • • • • • • • • TX Errors — The number (error count) of transmit errors. Product — The product affected by this monitor per second. Type — The type of port (for example, U-Port).
8 Performance monitors • Severity icon/monitor title — The worst severity of the data based on the error count shown next to the monitor title. • Port — The port affected by this monitor. • Connected_Port_Link (where Connected_Port_Link is Connected Port, Initiator, or Target) — Displays one of the following: - Connected Port — The ISL or IFL port on the connected device. Click to launch the switch port properties dialog box. - Initiator — The initiator port on the connected device.
Performance monitors 8 Top Port Link Resets monitor The Top Port Link Resets monitor (Figure 181) displays the top ports with link resets in a table. FIGURE 181 Top Port Link Resets monitor The Top Port Link Resets monitor includes the following data: • Severity icon/monitor title — The worst severity of the data based on the error count shown next to the monitor title. • Port — The port affected by this monitor.
8 Performance monitors • Status — The port status (for example, Up). • Refreshed — The time of the last update for the monitor. To customize the monitor to display data by a selected time frame as well as customize the display options, refer to “Editing a preconfigured performance monitor” on page 431. Accessing additional data from the Top Port Link Resets monitor • Right-click a row in the monitor to access the shortcut menu available for the associated device.
Performance monitors 8 • Overflow Errors— The number (error count) of overflow errors for the duration specified in the monitor. • Overflow Errors/sec — The number (error rate) of overflow errors per second for the duration specified in the monitor. • • • • • • • Product — The product affected by this monitor. Type — The type of port (for example, U-Port). Identifier — The port identifier. Port Number — The port number. State — The port state (for example, Enabled).
8 Performance monitors Top Port Runtime Errors monitor The Top Port Runtime Errors performance monitor (Figure 185) displays the top ports with runtime errors in a table. The Top Port Runtime Errors performance monitor includes the following data: • Threshold icon/object count/monitor title — The color associated with the threshold and number of objects within that threshold displays next to the monitor title. • Port — The port affected by this monitor.
Performance monitors 8 Top Port Sync Losses monitor The Top Port Sync Losses monitor (Figure 183) displays the top ports with synchronization failures in a table. FIGURE 183 Top Port Sync Losses monitor The Top Port Sync Losses monitor includes the following data: • Severity icon/monitor title — The color of the worst severity of the data shown next to the monitor title. • Port — The port affected by this monitor.
8 Performance monitors • Status — The port status (for example, In_Sync, No_Sync). • Refreshed — The time of the last update for the monitor. To customize the monitor to display data by a selected time frame as well as customize the display options, refer to “Editing a preconfigured performance monitor” on page 431. Accessing additional data from the Top Port Link Resets monitor • Right-click a row in the monitor to access the shortcut menu available for the associated device.
Performance monitors 8 Top Port Traffic monitor The Top Port Traffic monitor (Figure 184) displays the top ports with receive and transmit traffic in a table. FIGURE 184 Top Port Traffic monitor The Top Port Traffic monitor includes the following data: • Severity icon/monitor title — Displays the worst severity of the data shown next to the monitor title. NOTE The Top Port Traffic widget displays the threshold colors based on the port speed.
8 Performance monitors • Status — The port status (for example, Up). • Refreshed — The time of the last update for the monitor. To customize the monitor to display data by a selected time frame as well as customize the display options, refer to “Editing a preconfigured performance monitor” on page 431. Accessing additional data from the Top Port Traffic monitor • Right-click a row in the monitor to access the shortcut menu available for the associated device.
Performance monitors 8 Top Port Utilization Percentage monitor The Top Port Utilization monitor (Figure 185) displays the top port utilization percentages in a table. FIGURE 185 Top Port Utilization monitor The Top Port Utilization monitor includes the following data: • Severity icon/monitor title — The worst severity of the data shown next to the monitor title. • Port — The port affected by this monitor.
8 Performance monitors Accessing additional data from the Top Port Utilization monitor • Right-click a row in the monitor to access the shortcut menu available for the associated device. For more information about shortcut menus, refer to “Application menus” on page 2101. • Double-click a row to navigate to the Historical Graphs/Tables dialog box. For more information, refer to “Performance Data” on page 1601.
Performance monitors 8 • State — The port state (for example, Enabled). • Status — The port status (for example, Up). • Refreshed — The time of the last update for the monitor. To customize the monitor to display data by a selected time frame as well as customize the display options, refer to “Editing a preconfigured performance monitor” on page 431.
8 Performance monitors • • • • • • • • Tag — The product tag. Serial # — The serial number of the product. Model — The product model. Port Count — The number of ports on the product. Firmware — The firmware level running on the product. Location — The location of the product. Contact — A contact name for the product. Refreshed — The time of the last update for the monitor.
Performance monitors • • • • • • • • • • • • • 8 Max — The maximum value of the measure in the specified time range. Fabric — The fabric to which the device belongs. Product Type — The type of product (for example, switch). State — The product state (for example, Offline). Status — The product status (for example, Reachable). Tag — The product tag. Serial # — The serial number of the product. Model — The product model. Port Count — The number of ports on the product.
8 Performance monitors The Top Product Response Time monitor includes the following data: • Severity icon/response time/monitor title — The worst severity of the data and the response time displays next to the monitor title. • • • • • • • • • • • • • • • • Product — The product affected by this monitor. Min — The minimum value of the measure in the specified time range. Response Time (ms) — The top response time in milliseconds. Max — The maximum value of the measure in the specified time range.
Performance monitors 8 Top Product Temperature monitor The Top Product Temperature monitor (Figure 190) displays the top product temperature in a table. FIGURE 190 Top Product Temperature monitor The Top Product Temperature monitor includes the following data: • Severity icon/temperature/monitor title — The worst severity of the data and the temperature displays next to the monitor title. • • • • • • • • • • • • • • • • Product — The product affected by this monitor.
8 Performance monitors Accessing additional data from the Top Product Temperature monitor • Right-click a row in the monitor to access the shortcut menu available for the associated device. For more information about shortcut menus, refer to “Application menus” on page 2101. • Double-click a row to navigate to the Historical Graphs/Tables dialog box. For more information, refer to “Performance Data” on page 1601.
Performance monitors 8 • Location — The location of the product. • Contact — A contact name for the product. • Refreshed — The time of the last update for the monitor. To customize the monitor to display data by a selected time frame as well as customize the display options, refer to “Editing a preconfigured performance monitor” on page 431.
8 User-defined performance monitors • To specify a color based on hue, saturation, and lightness, click the HSL tab. Specify the hue (0 through 360 degrees), saturation (0 through 100%), lightness (0 through 100%), and transparency (0 through 100%). • To specify a color based on values of red, green, and blue, click the RGB tab. Specify the values for red (0 through 255), green (0 through 255), blue (0 through 255), and alpha (0 through 255).
User-defined performance monitors 8 Measures Depending on the object (products, ports, traffic) you want to monitor, you can choose from the following measures: • Product - Memory Utilization Percentage — The memory utilization percentage for the product. - CPU Utilization Percentage — The CPU utilization percentage for the product. - Temperature — The temperature in Celsius for the product. - Fan Speed — The fan speed in RPM for the product.
8 User-defined performance monitors - FCIP - IP - Cumulative Compression Ratio — The cumulative compression ratio for the FCIP tunnel. Latency — The latency for the FCIP tunnel. Dropped Packets — The number of dropped packets. Link Retransmits — The number of retransmitted links. Timeout Retransmits — The number of retransmits due to timeout. Fast Retransmits — The number of fast retransmits triggered.
User-defined performance monitors - SCSI - 8 Read Frame Count (frames) — The SCSI read command frame count as reported in the last data point received for the flow. Write Frame Count (frames) — The SCSI write command frame count as reported in the last data point received for the flow. Read Frame Rate (f/s) — The SCSI write frame rate per second as reported in the last data point received for the flow.
8 User-defined performance monitors Top or bottom product performance monitors The top or bottom product performance monitors (Figure 192) display the top or bottom number of products (for example, top 10 products) for the selected measure in a table.
User-defined performance monitors 8 To configure a product performance monitor, refer to “Configuring a user-defined product performance monitor” on page 441. Accessing additional data from top or bottom product monitors In a Top N or Bottom N monitor, double-click a row or right-click a row and select Show Graph/Table to navigate to the Historical Graphs/Tables dialog box for the selected measures. For more information, refer to “Performance Data” on page 1601.
8 User-defined performance monitors By default, ports display sorted by the Measure_Type value (Top ports sort from highest to lowest and bottom ports sort lowest to highest). Click a column head to sort the columns by that value. • • • • • • • Product — The product affected by this monitor. Type — The type of port (for example, U-Port). Identifier — The port identifier. Port Number — The port number. State — The port state (for example, Enabled). Status — The port status (for example, Up).
User-defined performance monitors 8 • Number of Products/Ports (y-axis) — The y-axis always displays a numbered range (zero to the maximum number of objects) for the products or ports affected by the selected measure. • Measure_Type (x-axis) — The x-axis display depends on the Measure_Type you selected for this monitor. Each bar on the graph maps directly to one of the five percentage ranges defined for the monitor.
8 User-defined performance monitors Accessing additional data from the Distribution monitors • Place the cursor on a bar in the graph to display the number of products included in the count for the selected bar. For example, the tooltip “(Data Item 3, 22.6-33.8) = 6” means that there are six products within the third percentage range (displays the temperatures within the percentage range) for the selected measure (product temperature).
User-defined performance monitors 8 To configure a time series performance monitor, refer to “Configuring a user-defined product performance monitor” on page 441 or “Configuring a user-defined port performance monitor” on page 444. Top sFlows performance monitors The top sFlows performance monitors display the top sFlow measures based on available flow data in a table.
8 User-defined performance monitors • Time Series — Select to monitor a selected measure for a range of time and specified target. 6. Select the product measure for the monitor in the Measure area: • • • • • • • • • 7.
User-defined performance monitors 8 • To specify a color based on values of red, green, and blue, click the RGB tab. Specify the values for red (0 through 255), green (0 through 255), blue (0 through 255), and alpha (0 through 255). • To specify a color based on values of cyan, magenta, yellow, and black, click the CMYK tab. Specify the values for cyan (0 through 255), magenta (0 through 255), yellow (0 through 255), black (0 through 255), and alpha (0 through 255).
8 User-defined performance monitors The Performance Dashboard Monitor Targets dialog box displays. Depending on the type of measure you select, you can add IP products/ports, SAN products/ports, and FCIP tunnels to the list of targets. If you selected a product measure, continue with step 8. If you selected a SAN or IP port measure, continue with step 8. If you selected a FC IP port measure, go to step 14. 8. Click the SAN tab. 9. Select SAN targets from the Available SAN Sources list. 10.
User-defined performance monitors 8 • Time Series — Select to monitor a selected measure for a range of time and specified targets. 5.
8 User-defined performance monitors (Top N and Bottom N monitors only) The decreasing order defaults are as follows: 90 and above displays red, 75 and above displays orange, 60 and above displays yellow, and all others display blue. The maximum values allowed are -32,768 through 32,767 for SFP power and 0 through 32,767 for all other measures.
User-defined performance monitors 8 • (SAN ports) In a Top N or Bottom N C3 Discards TX TO and C3 Discards RX TO monitors, right-click an FC-port row (Fabric OS device running 7.1.0 or later) and select Discarded Frames to navigate to the Discarded Frames dialog box. For more information, refer to “Viewing discarded frames from a port” on page 667.
8 User-defined performance monitors The new performance monitors display at the bottom of the dashboard. Accessing additional data from user-defined sFlow performance monitors • In a Top N sFlow monitor, double-click a device row to navigate to the sFlow Monitor Report dialog box. For more information, refer to “Interpreting an sFlow traffic report” on page 1709.
User-defined performance monitors 8 Viewing port distribution data details Each bar on the port distribution graph maps directly to one of the five percentage ranges defined for the distribution monitor (refer to “Distribution performance monitors” on page 438). 1. Double-click a bar in the graph. The Monitor_Title Data Details dialog box displays. 2. Review the data. The port distribution data details include the following fields and components: • Port — The port affected by the selected measure.
8 User-defined performance monitors - Cumulative Compression Ratio — The cumulative compression ratio for the FCIP tunnel. - Latency — The latency for the FCIP tunnel. Timeout Retransmits — The number of retransmits due to timeout. Fast Retransmits — The number of fast retransmits triggered. Duplicate Ack Received — The number of duplicate acknowledgements received. Window Size RTT — The window size round trip time. TCP Out of Order Segments — The number of segments received out of order.
Traffic flow dashboard monitors 8 Configuring a monitor from a performance graph 1. Configure the performance graph. To configure a real-time performance graph, refer to “Monitoring real-time performance” on page 1650. To configure a historical performance graph, refer to “Performance Data” on page 1601. 2. Click Save As Widget to create a monitor of the graph data for the dashboard. The Performance Dashboard Monitor Title dialog box displays.
8 Traffic flow dashboard monitors Traffic flow measures You can use the following measures to create your traffic flow monitors: • SCSI - Read Frame Count (frames) — The SCSI read command frame count as reported in the last data point received for the flow. 452 - Write Frame Count (frames) — The SCSI write command frame count as reported in the last data point received for the flow.
Traffic flow dashboard monitors 8 • Frame - Transmit Frame Count (frames) — The transmit frame count as reported in the last data point received for the flow. - Receive Frame Count (frames) — The received frame count as reported in the last data point received for the flow. - Transmit Frame Rate (f/s) — The transmit frame rate per second as reported in the last data point received for the flow.
8 Traffic flow dashboard monitors Traffic flow performance graph monitor The traffic flow performance monitors display (Figure 196) the selected measures in a chart. FIGURE 196 Traffic flow performance graph monitor example The traffic flows performance monitor includes the following data: • • • • Monitor title — The user-defined monitor title. Value (y-axis) — The number of objects affected by the selected measure. Time (x-axis) — The time the monitor collected the data.
Traffic flow dashboard monitors 8 Top or bottom traffic flow performance monitor The top or bottom traffic flow performance monitors (Figure 197) top or bottom number of flows for the selected measure in a table. FIGURE 197 Top traffic flow monitor example The top or bottom flow performance monitor includes the following data: • Threshold icon/object count/monitor title — The color associated with the threshold and the number of objects within that threshold are displayed next to the monitor title.
8 Traffic flow dashboard monitors Accessing additional data from traffic flow performance monitors • Right-click a row in the table to access the shortcut menu and select one of the following options: - Show Graph/Table — Launches the Flow Graphing dialog box with the selected measures (sub-flows) to be plotted. - Locate — Move the focus to the SAN tab with the associated switch highlighted. Monitor — Launches the Monitor - Flow Vision dialog box with the selected sub-flows in the Active Flows list.
Traffic flow dashboard monitors 8 Configuring a traffic flows monitor from a performance graph 1. Configure the performance graph. To configure a traffic flows performance graph, refer to //link to flow vision//. 2. Click Save As Widget to create a monitor of the graph data for the dashboard. The Historical Chart Monitor - Date_Time dialog box displays (where Date_Time is the date and time the monitor was created). 3. Modify the title, if necessary, and click OK. 4. Click OK on the message.
8 Traffic flow dashboard monitors 5. Select the traffic measure for the monitor in the Measure area: For Time Series monitors, you can select more than one measure.
Traffic flow dashboard monitors 8 • To specify a color based on values of red, green, and blue, click the RGB tab. Specify the values for red (0 through 255), green (0 through 255), blue (0 through 255), and alpha (0 through 255). • To specify a color based on values of cyan, magenta, yellow, and black, click the CMYK tab. Specify the values for cyan (0 through 255), magenta (0 through 255), yellow (0 through 255), black (0 through 255), and alpha (0 through 255).
8 Traffic flow dashboard monitors • Bi-direction — Whether or not the flow is bi-directional. Valid values are Yes or No. 8. Select the flow targets from the Available Flow list and click the right arrow button to move the targets to the Selected Flow list. Remove targets from the monitor by selecting one or more targets in the Selected Flow list and clicking the left arrow button. 9. Click OK on the Performance Dashboard Monitor Targets dialog box.
Chapter 9 View Management In this chapter • SAN tab overview. . . . . . . . . . . . . . . . . . . . . . . . . . . . . . . . . . . . . . . . . . . . . . • IP tab overview. . . . . . . . . . . . . . . . . . . . . . . . . . . . . . . . . . . . . . . . . . . . . . . . • Master Log . . . . . . . . . . . . . . . . . . . . . . . . . . . . . . . . . . . . . . . . . . . . . . . . . . . • Minimap . . . . . . . . . . . . . . . . . . . . . . . . . . . . . . . . . . . . . . . . . . . . . . . . . . . . . • Status bar.
9 SAN tab overview SAN tab overview The SAN tab displays the Product List, Topology Map, Master Log, Utilization Legend, and Minimap. NOTE When you launch the Management application or navigate to a new view, the SAN tab displays with a gray screen over the Product List and Topology Map while data is loading. You can change the default size of the display by placing the cursor on the divider until a double arrow displays. Click and drag the adjoining divider to resize the window.
SAN tab overview 9 6. Port Display buttons — Provides buttons that enable quick access to configuring how ports display. Not enabled until you discover a fabric or host. For more information, refer to “Port Display buttons” on page 465. 7. IP tab — Displays the Master Log, Minimap, Connectivity Map (topology), and Product List. For more information, refer to the “IP tab overview”. 8.
9 SAN tab overview 7. View Utilization — Displays or hides the utilization legend. 8. View Report — Displays the View Reports dialog box. Use to view available reports. 9. Flow Vision — Displays the Flow Vision dialog box. Use to configure Flow Vision. 10. MAPS — Displays the MAPS dialog box. Use to configure MAPS. 11. Domain ID/Port # — Use to set the domain ID or port number to display as decimal or hex in the Product List. 12.
SAN tab overview 9 Port Display buttons The Port Display buttons are located at the top right of the Product List and enable you to configure how ports display. You have the option of viewing connected (or occupied) product ports, unoccupied product ports, or attached ports. Not enabled until you discover a fabric or host. NOTE Occupied/connected ports are those that originate from a device, such as a switch. Attached ports are ports of the target devices that are connected to the originating device.
9 SAN tab overview Product List The Product List, located on the SAN tab, displays an inventory of all discovered devices and ports. The Product List is a quick way to look up product and port information, including serial numbers and IP addresses. To display the Product List, select View > Show Panels > Product List or press F9. Note that the Product List can only display up to 9000 ports at a time.
SAN tab overview • • • • • • • • • • • 9 Protocol — Displays the protocol for the port. Serial # — Displays the serial number of the product. Speed Configured (Gbps) — Displays the actual speed of the port in Gigabits per second. State — Displays the state for the product and the port. Status — Displays the status for the product and the port. Symbolic Name — Displays the symbolic name for the port. TAG — Displays the tag number of the product. Vendor — Displays the name of the product’s vendor.
9 SAN tab overview FIGURE 203 Connectivity Map The Management application displays all discovered fabrics in the Connectivity Map by default. To display a discovered Host in the Connectivity Map, you must select the Host in the Product List. You can only view one Host and physical and logical connections at a time. Connectivity Map functions • Two-way selection — When you select an icon on the Topology Map, that device is highlighted in the Product List and vice versa.
IP tab overview 9 FIGURE 204 Utilization Legend The colors and their meanings are outlined in the following table. TABLE 40 Line Color Utilization Defaults Red line 80% to 100% utilization Yellow line 40% to 80% utilization Blue line 1% to 40% utilization Gray line 0% to 1% utilization Black line Utilization disabled For more information about the utilization legend, refer to “SAN connection utilization” on page 1646.
9 IP tab overview FIGURE 205 Main Window - IP tab 1. Menu bar — Lists commands you can perform on the IP tab. Some menu items display as disabled unless you select the correct object from the product list or topology map. For a list of the many functions available on each menu, refer to “IP main menus” on page 2112. 2. IP main toolbar — Provides buttons that enable quick access to dialog boxes and functions. For more information, refer to “IP main toolbar” on page 471. 3.
IP tab overview 9 12. Status bar — Displays data regarding the connection, port, product, special event, call home, and backup status, as well as Server and User data. For more information, refer to “Status bar” on page 480. IP main toolbar The toolbar is located beneath the Menu bar and provides icons to perform various functions. 1 2 3 4 5 6 7 8 9 10 11 12 13 FIGURE 206 Main toolbar The icons on your toolbar vary based on the licensed features on your system. 1.
9 IP tab overview 1 2 3 4 FIGURE 207 Product list toolbar 1. View list — Use to select the one of the following view types: Network Objects, IP Topology, L2 Topology, and VLAN Topology. The areas of the main display vary depending on the display type you select. • Network Objects — Displays the Product List toolbar, Product List, and Master Log. • L2 Topology — Displays the Product List toolbar, Product List, Topology Map toolbar, Topology Map, Master Log, and Minimap.
IP tab overview 9 Host Product List toolbar The Port Display buttons are located at the top right of the Product List and enable you to configure how ports display. You have the option of viewing connected (or occupied) product ports, unoccupied product ports, or attached ports. Not enabled until you discover a fabric or host. NOTE Occupied/connected ports are those that originate from a device, such as a switch. Attached ports are ports of the target devices that are connected to the originating device.
9 IP tab overview 7. Reset zoom list — Use to reset the zoom (Actual Size, Fit Content, 25%, 50%, 75%, 100%, 125%, 150%, 200%, or 500%) of the Topology Map. 8. Zoom In icon — Use to zoom in on the Topology Map. Host topology map toolbar The Host Topology map toolbar is located at the top right side of the View window and provides tools to export the topology, to zoom in and out of the Topology Map, collapse and expand groups, and fit the topology to the window. Not enabled until you discover a host.
IP tab overview 9 • Status — Displays the status for the produc, such as Reachable, Marginal, Degraded Link, or Not Reachable. • • • • • • • • • • State (Ethernet Fabrics only) — Displays the Ethernet Fabric state, such as online or offline. Vendor — Displays the name of the product’s vendor. Model — Displays the model number of the product. Port Count — Displays the number of ports on the product. Firmware — Displays the firmware version of the product.
9 IP tab overview FIGURE 211 Topology Map Topology Map functions • Two-way selection — Select an icon on the topology map and that device is highlighted in the Product List and vice versa. For more information about icons, refer to “Icon legend” on page 481. • Node/Device double-click — Double-click a node (subnet) to display the devices beneath it. Double-click a device to display the Properties dialog box for the selected device.
Master Log TABLE 41 9 Topology keyboard shortcuts Keyboard Shortcut Description Control + 0 Set the zoom level to 100%. Control + P Launch the Print dialog box. Control + E Launch the Export dialog box. Control + , Launch the Topology Display dialog box. Right Arrow Move the selection to the node on the right (if available). Left Arrow Move the selection to the node on the left (if available). Up Arrow Move the selection to the node above the current selection (if available).
9 Minimap • • • • • Product Address — The IP address of the product on which the event originated. • • • • • • First Event Product Time — The time and date the event first occurred on the product. Contributor — The name of the contributor on which the event occurred. Node WWN — The world wide name of the node on which the event occurred. Fabric Name — The name of the fabric on which the event occurred.
Minimap 9 FIGURE 213 IP Minimap Anchoring or floating the Minimap You can anchor or float the Minimap to customize your main window. • To float the Minimap and view it in a separate window, click the Detach icon ( ) in the upper right corner of the Minimap. • To anchor the Minimap and return the Minimap to its original location on the main window, do one of the following steps: - Click the Attach icon ( Click the Close icon ( ) in the upper right corner of the Minimap.
9 Status bar Status bar The status bar displays at the bottom of the main window. The status bar provides a variety of information about the SAN and the application. The icons on the status bar change to reflect different information, such as the current status of products, fabrics, and backup. FIGURE 214 Status Bar The icons on your status bar will vary based on the licensed features on your system. 1. Connection Status — Displays the Server-Client connection status.
Icon legend 9 8. Configuration Deviation Status (IronWare and Network OS products only) — Displays whether or not product’s have deviated from their baseline configuration. Click this icon to open the Change Tracking tab of the Configuration Repository dialog box. 9. Policy Monitor Status — Displays whether or not a policy monitor has failed or partially failed. Click to launch the Policy Monitor dialog box.
9 Icon legend TABLE 42 Icon Description Icon Description Fabric OS DCB Switch in Access Gateway mode (single-fabric connected) Fabric OS DCB Switch in Access Gateway mode (multiple-fabric connected) VC module Multi-fabric VC module iSCSI Target iSCSI Initiator IP product icons The following table lists the manageable IronWare and Network OS product icons that display on the topology. Manageable devices display with blue icons. Unmanageable devices display with gray icons.
Icon legend 9 Host product icons The following table lists the manageable Host product icons that display on the topology. Fabric OS manageable devices display with blue icons. Unmanageable devices display with gray icons. Some of the icons shown only display when certain features are licensed.
9 Icon legend Host group icons The following table lists the manageable Host product group icons that display on the topology. TABLE 46 Icon Description Icon Description Host Group IP group icons The following table lists the manageable IP product group icons that display on the topology. TABLE 47 Icon Description Icon Description Switch Group, Product Group SAN port icons The following table lists the SAN port icons that display in the Product List.
Icon legend 9 IP port icons The following table lists the IP port icons that display in the Product List. TABLE 49 Icon Description IP Port Virtual IP Port IP Port Group SAN product status icons The following table lists the product status icons that display on the topology.
9 Customizing the main window TABLE 51 Icon Status Degraded Link Not Reachable Unknown/Link Down Unhealthy Event icons The following table lists the event icons that display on the topology and Master Log. For more information about events, refer to “Fault Management” on page 1907.
Customizing the main window 9 Zooming in To zoom in on the Connectivity Map, use one of the following methods: • Click the zoom-in icon ( ) on the Connectivity Map toolbar. • Press CTRL and the plus sign on the number pad on the keyboard. • Use the Zoom dialog box. a. Select View > Zoom. The Zoom dialog box displays. FIGURE 215 Zoom dialog box b. Select a zoom percentage. c. Click OK to save your changes and close the Zoom dialog box.
9 Customizing the main window Viewing products To view products, groups, and fabrics, select View > Show> All Products. Viewing ports To view all ports, select View > Show> All Ports. Exporting the topology You can save the topology to an image (PNG format). 1. Click Export in the toolbar. The Export Topology To PNG File dialog box displays. 2. Browse to the directory where you want to export the image. 3. Edit the name in the File Name field, if necessary. 4. Click Save.
Customizing the main window 9 FIGURE 216 Customize Columns dialog box 2. Choose from the following options: • Select the check box to display a column. OR Select the column name and click Show. • Clear the check box to hide a column. OR Select the column name and click Hide. • Click Select All to select all check boxes. • Click Deselect All to clear all check boxes. • Click Restore Defaults to restore the table to the original settings. 3. Click OK.
9 Customizing the main window Resizing the columns You can resize a single column or all columns in the table. To resize a single column, right-click the column header and select Size Column to Fit or Table > Size Column to Fit. To resize all columns in the table, right-click anywhere in the table and select Size All Columns to Fit or Table > Size All Columns to Fit. Sorting table information To sort the table by a single column, click the column header.
Product List customization 9 Searching for information in a table You can search for information in the table by any of the values found in the table. 1. Right-click anywhere in the table and select Table > Search. The focus moves to the Search field. FIGURE 217 Search field 2. Enter all or part of the search text in the Search field and press Enter. The first instance is highlighted in the table. 3. Press Enter to go to the next instance of the search text.
9 Product List customization 1. Right-click any column heading on the Product List and select Add Column. The Add Property dialog box displays. 2. Enter a label and description for the property. The label must be unique and can be up to 30 characters. The description can be up to 126 characters. 3. Select the property type from the Type list. Options include: Fabric, Product, or Port. 4. Click OK.
Search 9 The column you selected is deleted from the Product List as well as the Properties dialog box. Search You can search for a objects by text or regular expression. • Text — Enter a text string in the search text box. This search is case sensitive. For example, if you are searching for a device in the Product List, you can enter the first five characters in a device name. All products in the Product List that contain the search text display highlighted.
9 Search 1. Enter your search criteria in the search field. NOTE To search for a device, the device must be discovered and display in the topology. 2. Choose one of the following options: • Select Text from the search list and enter a text string in the search text box. This search is case sensitive. • Select Regular Expression from the search list and enter a Unicode regular expression in the search text box. This search is case insensitive 3. Press Enter or click the search icon.
Address Finder 9 The search results display highlighted. Searching for an exact match NOTE Search does not search automatically collapsed fabrics. You must expand the fabric (right-click and select Expand) and repeat the search. To search for an exact match, complete the following steps. 1. Choose one of the following options: • Select Text from the search list. • Select Regular Expression from the search list. 2. Enter your search criteria in the search field.
9 Address Finder Address Finder locates where hosts are connected to your network from traffic on the network. The list of interfaces provides information on the location of the source of the address, relative to each network device, although the source may be directly or indirectly connected to the listed interfaces.
Address Finder 9 FIGURE 218 Address Finder dialog box 3. Select the IP Address option and enter the IP address (IPv4 or IPv6 format) that you want to find. NOTE IPv6 address search is only supported on Ethernet router products running IronWare OS 5.4 or later. NOTE IPv6 address search is not supported on Network OS products. 4. Select the Find only in the selected products check box to limit the search to selected products.
9 Address Finder • Target MAC Address — The MAC address you wanted to find. • Target IP Address — The IP address you wanted to find. Sort the search results by clicking the column header. Click the same column header again to reverse the sort order. NOTE Address Finder cannot detect IP addresses assigned to POS or ATM ports. However, Address Finder will find IP addresses across a POS or ATM port. You can sort the search results by a specific column by clicking the column header.
Address Finder 9 FIGURE 219 Address Finder dialog box 3. Select the MAC Address option and enter the address in hexadecimal characters in the field. You can use any of the following methods to separate the characters in the address: • • • • • Hyphens (for example: aa-bb-cc-dd-ee-ff) Periods (for example: aa.bb.cc.dd.ee.
9 SAN view management overview NOTE When you find targets using the MAC address wildcard, the Products Found table shows the IP addresses of hosts connected to the routers. IP addresses of hosts connected to L2 switches are blank because Layer 2 switches typically do not learn the IP addresses of end nodes attached to the Layer 2 switch as it is not in the ARP table of the switch. NOTE You cannot use special addresses (such as a broadcast MAC address (FFFF.FFFF.
SAN view management overview 9 If you discover or import a network with more than approximately 2,000 devices, the devices display on the Product List, but not on the Topology Map. Instead, the Topology Map shows a message stating that the topology cannot be displayed. To resolve this issue, create a new view to filter the number of devices being discovered. Refer to “Creating a customized view” on page 501 for instructions.
9 SAN view management overview The Available Fabrics table displays the names and the number of products in the available fabrics. If this table is blank, it may be because all fabrics have been selected and are displayed in the Selected Fabrics and Hosts table. To select more than one row, press CTRL and click individual rows. To select multiple sequential rows, press SHIFT and click on a sequence of rows. 5. Click the Hosts tab. FIGURE 221 Create View dialog box - Hosts tab 6.
SAN view management overview 9 FIGURE 222 Edit View dialog box - Fabrics tab 2. Click the Fabrics tab. 3. In the Available Fabrics table, select the fabrics you want to include in the view and use the right arrow button to move your selections to the Selected Fabrics and Hosts table. The Available Fabrics table displays the names and the number of products in the available fabrics.
9 SAN view management overview 7. Confirm that all the fabrics and hosts you selected display in the Selected Fabrics and Hosts table. The Selected Fabrics and Hosts table displays the name, type (host or fabric), number of products in the selected host or fabric. 8. Click OK to save your changes and close the Edit View dialog box. 9. Verify your changes on the main window of the Management application. Deleting a customized view To delete a customized view, use the following procedure. 1.
SAN topology layout 9 4. In the Available Hosts table, select the fabrics you want to include in the view and use the right arrow button to move your selections to the Selected Fabrics and Hosts table. The Available Hosts table displays the name, IP address, network address of the available hosts and the fabric in which the host is located. If this table is blank, it may be because all hosts have been selected and are displayed in the Selected Fabrics and Hosts table.
9 SAN topology layout • Port Label. Select to configure which port labels display. NOTE Changes apply to the selected fabric or the fabric to which the selected item belongs. - Name. Displays the name as the port label. If the port has not been given a name, the WWN of the port displays. - Port. Displays the slot and port as the port label for a chassis switch and the port number for a switch. - Port Address. Displays the port address as the port label. Port WWN.
SAN topology layout 9 FIGURE 225 Map Display Properties dialog box 2. Select one of the following options from the Map Display Layout list: • Free Form. Select to display the devices in the default format for Switch Groups and Router Groups. When the Free Form map display layout is selected, the View > Show Ports menu command is unavailable. • Fabric. Only available for the group type “Fabric”. Select to display the devices in the default format. • Custom Grid.
9 SAN topology layout • Straight. Select to display connections using straight lines. • Orthogonal. Select to display connections in orthogonal grid lines. Disabled if Free Form is selected in Map Display Layout area. • None. Select to hide the connections between devices. 3. Select the Set as Default Line Type check box. 4. Click OK on the Map Display Properties dialog box to change the line type on the topology.
SAN topology layout 9 6. Click OK on the Map Display Properties dialog box. Reverting to the default background color To revert back to the default background color, complete the following steps. 1. Right-click a group and select Map Display. The Map Display Properties dialog box displays. 2. Select the Default option. 3. Click OK on the Map Display Properties dialog box. Changing the product label To change the product label, complete the following steps. 1.
9 Grouping on the topology NOTE Connected (or occupied) ports are those that originate from a device, such as a switch. Attached ports are ports of the target devices that are connected to the originating device. 1. Select View > Port Display, and select one of the following options: • Occupied Product Ports. Select to display the ports of the devices in the fabrics (present in the Connectivity Map) that are connected to other devices. • Unoccupied Product Ports.
Grouping on the topology 9 NOTE Selecting Hide All disables the Include Virtual Devices option. Configuring custom connections NOTE Active zones must be available on the fabric. To create a display of the connected end devices participating in a single zone or group of zones, complete the following steps. 1. Select a fabric on the topology and select View > Connected End Devices > Custom.
9 IP topology view manager IP topology view manager The topology view manager enables you to choose how to view devices in your network. Topology views only contain devices included in your area of responsibility (AOR). To display topology views in the Management application, make sure you meet the following requirements.
Network Objects view 9 Network Objects view The Network Objects view displays a list of discovered products in a table (Product List). This view allows you to manage user authentications and permissions on discovered devices. In addition, you can place devices into management groups, which are used for configuration, deployment, accounting, monitoring, and reporting processes. The following columns (presented here in alphabetical order) are included in the Product List: • Build Label.
9 Network Objects view 1. Select Network Objects from the view list on the Product List toolbar. 2. Click Filter. The Product Filter dialog box displays. Only the categories or objects listed under the Selected Categories list display on the Network Objects Product List. Available categories include: • • • • • Contact — Lists the contact name for the discovered products. Firmware — Lists the firmware on the discovered products. Location — Lists the location of the discovered products.
IP Topology view 9 IP Topology view The IP Topology view displays a map of the devices on your network. To display the topology map for IP, you must have the IP - Main Display - IP privilege. For more information about privileges, refer to “User Privileges” on page 2151. For more information about the components and customization of the topology map, refer to the following sections: • “IP topology map components” on page 521. • “Topology map elements” on page 521. • “Topology map layout” on page 523.
9 Ethernet Fabrics view Ethernet Fabrics view The Ethernet Fabrics view displays a map of the traffic for VCS devices on your network. To view the fabric members and TRILL (Transparent Interconnection of Lots of Links) connections for a fabric, double-click the fabric in the Product List. To display the topology map for Ethernet Fabrics, you must have the Main Display - Ethernet Fabric privilege. For more information about privileges, refer to “User Privileges” on page 2151.
VLAN Topology view 9 • “Viewing STP/RSTP topology” on page 517. • “Topology map layout” on page 523. For more information about functions you can perform on the topology map, refer to “Topology Map functions” on page 476. STP/RSTP topology You can display topology maps for STP or RSTP configurations from the VLAN Topology view. Before you display the STP or RSTP topology, make sure you meet the following requirements: • The devices are running FDP or LLDP.
9 VLAN Topology view TABLE 53 STP/RSTP Topology map elements Element Description The port is in a blocking state or discarding. link with block The port is in a disabled state. link with diamond # (U) # (T) # (D) The port or interface number used to create the link and one of the following: • (U) — Untagged port • (T) — Tagged port • (D) — Dual-mode port tool tips Link tool tips — identifies the devices at each end of the link to help you locate the devices on the map.
Host Topology view 9 6. Click Save. The Save As dialog box displays. 7. Browse to the location where you want to save the report. 8. Enter a name for the report in the File Name field. 9. Click Save. E-mailing an STP/RSTP Report To export an STP/RSTP report, complete the following steps. 1. Select VLAN Topology from the view list on the Product List toolbar. Mouse over the STP button. A tool tip appears, indicating whether STP is on or off. 2. If STP is off, click STP to turn it on. 3.
9 Host Topology view • Description. Displays the description of the product. This field is editable at the fabric level. • Domain ID. Displays the Domain ID for the product in the format xx(yy), where xx is the normalized value and yy is the actual value on the wire. • • • • • • FC Address. Displays the Fibre Channel address of the port. • • • • • • • • • • • • • • • Port #. Displays the number of the port. Firmware. Displays the firmware version of the product. IP Address.
IP topology map components 9 IP topology map components Topology maps are divided into three sections: • Product List — The top left pane displays a list of all devices (topology tree) in your AOR. Devices display in topology groups. The Management application has a Search tool that you can use to find a device quickly. (Refer to “Using the Search tool” on page 53 for more information.
9 IP topology map components Table 54 displays the elements included in the topology.
IP topology map components 9 • Layer 2 Clouds — This node displays as a blue cloud. When two or more devices with FDP or LLDP enabled connect to a device or network without FDP or LLDP capability, the L2 cloud icon is displayed to represent the connection between the device types. This icon means that IronWare OS or Network OS devices are not directly connected to each other and each IronWare OS or Network OS device does not have Layer 2 information from other devices.
9 IP topology map components The following examples show the differences between the layouts. They may or may not match the map drawn for your network. Also, some of the examples may look alike; however, the layouts may look different on networks with more devices. Organic The Organic layout distributes the nodes evenly, makes connection lengths uniform, minimizes crisscrossing of connections, and tries to prevent nodes from touching each other.
IP topology map components 9 Orthogonal (Merge Lines) The Orthogonal (Merge Lines) layout displays the nodes in a concise tree-like structure using vertical and horizontal line segments. Hierarchical The Hierarchical layout is best for a complex map. This layout might have a start point and end point, with some overall flow between those points.
9 IP topology map components Circular The Circular layout distributes all nodes in a circle, with equal spacing between each neighbor node. Free Form This layout is the one you customize by repositioning the nodes on the map. Selecting a topology map layout To change the topology layout, complete the following steps. 1. Select one of the following view types from the view list on the Product List toolbar. • • • • L2 Topology Ethernet Fabrics IP Topology VLAN Topology 2.
IP topology map components 9 FIGURE 228 Topology Display dialog box 3. Select one of the following topology layouts in the Layout area. • • • • • • Organic Orthogonal Orthogonal (Merge Lines) Hierarchical Circular Free Form 4. Click Recompute Layout Now. The Management application redraws the Topology Map. 5. Click OK on the Topology Display dialog box. Creating a customized layout You can create one customized layout for each group node in each topology view.
9 IP topology map components a. Use Ctrl + click to select one or more nodes or click in an empty part of the topology and drag a box around the nodes you want to move. b. Select one of the highlighted nodes and drag the selected nodes to a new position on the map. 3. Repeat step 2 until you have repositioned all nodes. Navigation to another view topology or tab or exiting the application automatically saves your changes.
IP topology map components 9 Device_One_IP_Address|Interface_Name Device_Two_IP_Address|Interface_Name where Device_One_IP_Address is the IP address for the device at one end of the link, Interface_Name the is the exact format returned by the ifName MIB variable for the device, and Device_Two_IP_Address is the IP address for the device at the other end of the link. 3. Save and close the topology_data.txt file. The customized topology links display during the next L2 neighbor collection for the devices.
9 IP topology map components • To specify a color based on values of cyan, magenta, yellow, and black, click the CMYK tab. Specify the values for cyan, magenta, yellow, black, and alpha (0 to 255). c. Click OK on the Choose a Color dialog box. 3. Add an image to the background by selecting an image from the Image list. To import an image, refer to “Adding a background image to a map” on page 530. 4.
IP topology map components 9 3. Browse to the map image. 4. Click Open. The imported image displays in the Image list. 5. Set the background image mode by selecting one of the following from the Mode list: • Dynamic — Select when the background image is considered to be part of the displayed contents and not a decoration. In this mode, an object on a specific point of the image, stays on that specific point during zooming or scrolling on the topology.
9 IP topology map components 2. Browse to the location where you want to save the map image. 3. Enter a name for the map in the File Name field. 4. Select the export file type in the File of Type list. Options include: PNG, GIF, JPG, BMP, PDF, and EMF. 5. Click Save. Printing a map To print a Topology Map, complete the following steps. 1. Click the Print icon on the Topology Map tool bar. The Print dialog box displays. 2. To configure the page setup, click Page on the Print dialog box.
Port actions 9 m. Enter a footer in the Text field. n. Select a color for the footer from the Footer Color list. o. Select a color for the title from the Text Color list. p. Enter a title in the Text area. q. Enter the font size in the Font size field. r. Click OK on the Print Options dialog box. 6. Click Print. The Print dialog box displays. 7. Select a printer from the Name list. 8. Click OK on the Print dialog box. 9. Click the close (X) button on the Print dialog box.
9 Port actions Disabling port actions To disable port actions, complete the following steps. 1. Select one of the following view types from the view list on the Product List toolbar. • • • • • Network Object IP Topology L2 Topology Ethernet Fabrics VLAN Topology 2. Right-click the device in the Product List and select Properties. The Device_Name Properties dialog box displays. 3. Click the Port tab. 4. Select Disable from the Port Actions list. 5. Click OK to close the dialog box.
Port actions 9 1. Select one of the following view types from the view list on the Product List toolbar. • • • • • Network Object IP Topology L2 Topology Ethernet Fabrics VLAN Topology 2. Right-click the device in the Product List and select Properties. The Device_Name Properties dialog box displays. 3. Click the Port tab. 4. Select one of the following from the Performance list. • Real Time Graph/Table • Historical Graph/Table The Real Time Graph/Table or Historical Graph/Table dialog box displays.
9 536 Port actions Brocade Network Advisor SAN + IP User Manual 53-1003155-01
Chapter 10 MRP Topology In this chapter • MRP Topology overview . . . . . . . . . . . . . . . . . . . . . . . . . . . . . . . . . . . . . . . . . • Viewing a MRP Topology map . . . . . . . . . . . . . . . . . . . . . . . . . . . . . . . . . . . . • Viewing a MRP ring . . . . . . . . . . . . . . . . . . . . . . . . . . . . . . . . . . . . . . . . . . . . • Configuring the application to show a dashed line . . . . . . . . . . . . . . . . . . . • Selecting a topology map layout. . . . . . . . . . . . . . .
10 Viewing a MRP Topology map You can use the CLI Configuration Manager to deploy MRP configurations to devices. You can also configure MRP using the device CLI. You can use the Element Manager to access the device or go directly to the device CLI. You must enable the MRP trap on the devices so that the Management application can monitor MRP ring status. For more information about MRP rings and configuration instructions, refer to your hardware’s configuration guide.
Viewing a MRP ring 10 When you select a device on the Topology Map, the application highlights the device in the Product List. Viewing a MRP ring To view a MRP ring, click a ring in the Product List. The selected ring displays in the Topology Map. FIGURE 231 MRP Topology dialog box MRP Topology maps are comprised of nodes (rings) and connections (devices). Table 55 displays the basic elements included in a MRP topology map.
10 Viewing a MRP ring TABLE 55 MRP Topology map elements Element Description The port is in a blocking state or discarding. link with block MRP is disabled on the port. link with solid black circle # or # / # The forwarding or receiving port number of slot/port number. To make the forwarding and receiving port number data visible on the map, you must enable Link Information Visibility (default is disabled) on the MRP Topology Options dialog box.
Configuring the application to show a dashed line • • • • • • 10 Options button. Use to configure topology options. Fit Window icon. Use to scale the map to fit within the Topology Map area. Actual Size icon. Use to scale the map to fit within the Topology Map area. Zoom In icon. Use to zoom in on the Topology Map. Zoom Out icon. Use to zoom out on the Topology Map. Export icon. Use to export the topology to a PNG file. For export instructions, refer to “Exporting the topology” on page 531.
10 Selecting a topology map layout • Organic The Organic layout distributes the nodes evenly, makes connection lengths uniform, minimizes criss-crossing of connections, and tries to prevent nodes from touching each other. • Hierarchical The Hierarchical layout is best for a complex map. This layout might have a start point and end point, with some overall flow between those points.
Selecting a topology map layout 10 • Self Organizing The Self Organizing layout distributes nodes and connections evenly on the display area in a linear layout. • Circular The Circular layout distributes all nodes in a circle, with equal spacing between each neighbor node.
10 Creating a customized layout • Saved This layout is the one you customized by repositioning the nodes on the map. If you have not customized the layout, this Saved option is disabled. Also, if you select the Saved Layout Preferred check box on the Topology Options dialog box, this layout takes precedence over the default layout. The Management application redraws the MRP Topology map. For more information about layout types, refer to “Topology map layout” on page 523.
Customizing the MRP Topology map 10 3. Repeat step 2 until you have repositioned all nodes. 4. Click Save on the MRP Topology map toolbar to retain the changes you made. Customizing the MRP Topology map To customize the MRP Topology map, complete the following steps. 1. Click Options on the MRP Topology map tool bar. The MRP Topology Options dialog box displays. FIGURE 232 Topology Options dialog box 2. Change the background color by completing the following steps: a.
10 Refreshing MRP Topology data 7. Click the Layout row and select the layout you want from the list. 8. Select the Saved Layout Preferred check box to set the customized layout as the default for the topology group. This parameter supersedes the Layout parameter. If you select this parameter, the Saved layout displays even if a different layout is indicated in the Layout parameter. 9. Click Close on the MRP Topology Options dialog box.
Viewing MRP properties • • • • • Ring Name — The MRP ring name. • • • • Secondary Port Type — The secondary port type (Regular or Tunnel). 10 Role — The role (Master or Member) of the device. Secondary Port — The secondary port of the device. Secondary Port Active — The port number receiving RHPs. Secondary Port State — The state (Pre-forwarding, Forwarding, Blocking, or Disabled) of the secondary port. State — Whether MRP is enabled or disabled on the device.
10 548 Viewing MRP properties Brocade Network Advisor SAN + IP User Manual 53-1003155-01
Chapter 11 Call Home In this chapter • Call Home overview . . . . . . . . . . . . . . . . . . . . . . . . . . . . . . . . . . . . . . . . . . . . • Viewing Call Home configurations . . . . . . . . . . . . . . . . . . . . . . . . . . . . . . . . • Showing a Call Home center. . . . . . . . . . . . . . . . . . . . . . . . . . . . . . . . . . . . . • Hiding a Call Home center . . . . . . . . . . . . . . . . . . . . . . . . . . . . . . . . . . . . . . • Editing a Call Home center . . . . . . . . . . . . . . .
11 Call Home overview Call Home notification allows you to configure the Management application server to automatically send an e-mail alert or dial in to a support center to report system problems on specified devices (Fabric OS, IronWare, and Network OS switches, routers, and directors). If you are upgrading from a previous release, all of your Call Home settings are preserved.
Viewing Call Home configurations 11 Call Home allows you to perform the following tasks: • Assign devices to and remove devices from the Call Home centers. • Define filters from the list of events generated by Fabric OS, IronWare, and Network OS devices. • Edit and remove filters available in the Call Home Event Filters table. • Apply filters to and remove filters from the devices individually or in groups.
11 Viewing Call Home configurations The Call Home dialog box contains the following fields and components: • Products List — Displays all discovered products. The list allows for multiple selections and manual sorting of columns. This list displays the following information: Product Icon — The status of the products’ manageability. Name — The name of the product. IP Address — The IP address (IPv4 or IPv6 format) of the product. Node WWN — The node world wide name of the product.
Viewing Call Home configurations 11 • Left arrow button (bottom) — Click to remove the selected event filter (refer to “Removing all event filter from a Call Home center” on page 568 or “Removing an event filter from a device” on page 569) from the selected Call Home center or product. Disabled when no event filter, product, or Call Home center is selected in the Call Home Centers list.
11 Showing a Call Home center Showing a Call Home center To show a Call Home center, complete the following steps. 1. Select Monitor > Event Notification > Call Home. The Call Home dialog box displays. 2. Click Show/Hide Centers (beneath the Call Home Centers list). The Centers dialog box displays with a predefined list of Call Home centers (Figure 234). FIGURE 234 Centers dialog box 3. Select the check boxes of the Call Home centers you want to display. Clear the check box to hide the Call Home center.
Editing a Call Home center 11 Editing a Call Home center To edit a Call Home center, select from the following procedures: • Editing the IBM Call Home center . . . . . . . . . . . . . . . . . . . . . . . . . . . . . . . . • Editing an e-mail Call Home center . . . . . . . . . . . . . . . . . . . . . . . . . . . . . . . • Editing the EMC Call Home center . . . . . . . . . . . . . . . . . . . . . . . . . . . . . . . . • Editing the HP LAN Call Home center. . . . . . . . . . . . . . . . . . . . . . . . . .
11 Editing a Call Home center 8. Enter how often you want to retry the heartbeat interval in the Retry Interval field. The default is 10 seconds. 9. Enter the maximum number of retries in the Maximum Retries field. The default is 3. 10. Enter the primary phone number or extension of the Call Home center in the Call Home Center - Primary Connection field. 11. Enter the backup phone number or extension of the Call Home center in the Call Home Center - Backup Connection field. 12.
Editing a Call Home center 11 FIGURE 236 Configure Call Home Center dialog box (Brocade, IBM, NetApp, or Oracle E-mail option) 4. Make sure the Call Home center type you selected displays in the Call Home Centers list. If the Call Home center type is incorrect, select the correct type from the list. 5. Select the Enable check box to enable this Call Home center. 6. Enter your contact name in the Customer Details - Name field. 7. Enter your company name in the Customer Details - Company field. 8.
11 Editing a Call Home center 16. Enter an e-mail address in the E-mail Notification Settings - Send To Address field. For Brocade E-mail Call Home centers, enter callhomeemail@brocade.com. 17. Click Send Test to test the mail server. The selected Call Home center must be enabled to test the mail server. A faked event is generated and sent to the selected Call Home center. You must contact the Call Home center to verify that the event was received and in the correct format.
Editing a Call Home center - Source — Details about the product. Includes the following data: - Event Time Event Severity Event Reason Code FRU Code/Event Type Event Description Event Data — Information about the triggered event.
11 Editing a Call Home center Editing the EMC Call Home center To edit an EMC Call Home center, complete the following steps. 1. Select Monitor > Event Notification > Call Home. The Call Home dialog box displays. 2. Select the EMC Call Home center you want to edit in the Call Home Centers list. 3. Click Edit Centers (beneath the Call Home Centers list). The Configure Call Home Center dialog box displays (Figure 237). FIGURE 237 Configure Call Home Center dialog box (EMC option) 4.
Editing a Call Home center 11 13. Click OK. The Call Home dialog box displays with the Call Home center you edited highlighted in the Call Home Centers list. 14. Click OK to close the Call Home dialog box. Editing the HP LAN Call Home center To edit an HP LAN Call Home center, complete the following steps. 1. Select Monitor > Event Notification > Call Home. The Call Home dialog box displays. 2. Select the HP LAN Call Home center you want to edit in the Call Home Centers list. 3.
11 Enabling a Call Home center 8. Click Send Test to test the address. The selected Call Home center must be enabled to test the IP address. A faked event is generated and sent to the selected Call Home center. You must contact the Call Home center to verify that the event was received and in the correct format. NOTE The HP LAN Call Home alert displays the directory separation characters with a double backslash (\\) instead of a single backslash (\). 9. Click OK to close the “Test Event Sent” message.
Testing the Call Home center connection 11 Testing the Call Home center connection Once you add and enable a Call Home center, you should verify that Call Home is functional. To verify Call Home center functionality, complete the following steps. 1. Select Monitor > Event Notification > Call Home. 2. Click Edit Centers (beneath the Call Home Centers list). The Configure Call Home Center dialog box displays. 3. Select the Call Home center you want to check in the Call Home Centers list. 4.
11 Viewing Call Home status Viewing Call Home status You can view Call Home status from the main Management application window or from the Call Home Notification dialog box. The Management application enables you to view the Call Home status at a glance by providing a Call Home status icon on the status bar. Table 57 illustrates and describes the icons that indicate the current status of the Call Home function.
Assigning a device to the Call Home center 11 Assigning a device to the Call Home center Discovered devices (switches, routers, and directors) are not assigned to a corresponding Call Home center automatically. You must manually assign each device to a Call Home center before you use Call Home. To assign a device or multiple devices to a Call Home center, complete the following steps. 1. Select Monitor > Event Notification > Call Home. The Call Home dialog box displays. 2.
11 Defining an event filter 3. Click the left arrow button. A confirmation message displays. 4. Click OK. All devices assigned to the selected Call Home center display in the Products List. Any assigned filters are also removed. 5. Click OK to close the Call Home dialog box. Defining an event filter To define an event filter, complete the following steps. 1. Select Monitor > Event Notification > Call Home. The Call Home dialog box displays. 2. Click Add beneath the Call Home Event Filter list.
Assigning an event filter to a Call Home center 11 Assigning an event filter to a Call Home center Event filters allow Call Home center users to log in to a Management server and assign specific event filters to the devices. This limits the number of unnecessary or “acknowledge” events and improves the performance and effectiveness of the Call Home center. You can only select one event filter at a time; however, you can assign the same event filter to multiple devices or Call Home centers.
11 Overwriting an assigned event filter Overwriting an assigned event filter A device can only have one event filter at a time; therefore, when a new filter is applied to a device that already has a filter, you must confirm the new filter assignment. To overwrite an event filter, complete the following steps. 1. Select Monitor > Event Notification > Call Home. The Call Home dialog box displays. 2. Select the event filter you want to apply in the Call Home Event Filters list.
Removing an event filter from a device 11 Removing an event filter from a device To remove an event filter from a device, complete the following steps. 1. Select Monitor > Event Notification > Call Home. The Call Home dialog box displays. 2. Choose one of the following options in the Call Home Centers list: • Right-click a device to which the event filter is assigned and select Remove Filter. • Select an event filter assigned to a device and click the left arrow button.
11 570 Searching for an assigned event filter Brocade Network Advisor SAN + IP User Manual 53-1003155-01
Chapter 12 Third-party tools In this chapter • About third-party tools . . . . . . . . . . . . . . . . . . . . . . . . . . . . . . . . . . . . . . . . . . • Starting third-party tools from the application . . . . . . . . . . . . . . . . . . . . . . • Launching a Telnet session . . . . . . . . . . . . . . . . . . . . . . . . . . . . . . . . . . . . . • Launching an Element Manager . . . . . . . . . . . . . . . . . . . . . . . . . . . . . . . . . • Launching Web Tools. . . . . . . . . . . . . . . . . . . .
12 Starting third-party tools from the application Starting third-party tools from the application You can open third-party tools from the Tools menu or a device’s shortcut menu. Remember that you cannot open a tool that is not installed on your computer. You must install the tool on your computer and add the tool to the Tools menu or the device’s shortcut menu. NOTE Installing tools is only available with the Trial and Licensed version versions. To open an application, complete the following steps. 1.
Launching an Element Manager 12 1. Select the switch to which you want to connect. 2. Select Tools > Product Menu > Telnet. The Telnet session window displays. NOTE On Linux systems, you must use CTRL + BACKSPACE to delete text in the Telnet session window. Launching an Element Manager Element Managers are used to manage Fibre Channel switches and directors. You can open a device’s Element Manager directly from the application. To launch a device’s Element Manager, complete the following steps.
12 Launching FCR configuration NOTE You must have Element Manager - Product Administration privileges for the selected device to launch Web Tools. If you do not have Element Manager - Product Administration privileges, you will need to enter those credentials to launch Web Tools. For more information about privileges, refer to “User Privileges” on page 2151. On the Connectivity Map, double-click the Fabric OS device you want to manage. Web Tools displays.
Launching Name Server 12 Note that on the FC 8 Gbps 48-port Blade, the Shared Area ports, for example, 16-47, cannot be configured as EX_ports NOTE You must have Element Manager - Product Administration privileges for the selected device to launch Web Tools. If you do not have Element Manager - Product Administration privileges, you will need to enter those credentials to launch Web Tools. For more information about privileges, refer to “User Privileges” on page 2151.
12 Launching HCM Agent Launching HCM Agent Use Fabric OS HCM Agent to enable and manage Fabric OS HBAs. You can open HCM Agent directly from the application. For more information about HCM Agent, refer to the HCM Agent Administrator’s Guide. For more information about Fabric OS HBAs, refer to the documentation for the specific device. To launch a Fabric OS HBA’s Element Manager, complete the following steps.
Adding a tool 12 OR 1. Select a Fabric OS device. 2. Select Monitor > Fabric Watch > Configure. Fabric Watch displays. Adding a tool You can specify third-party tools so they appear on the Setup Tools dialog box. From there, you can add them to the Tools menu and then open the tools directly from the Management application. To add a tool, complete the following steps. 1. Select Tools > Setup. The Setup Tools dialog box displays. 2. Click the Tools Menu tab. 3. Click Define.
12 Entering the server IP address of a tool Entering the server IP address of a tool If the third-party tool is a web-based application, you must enter the IP address of the applications server as a parameter to be able to open the application. To enter the server IP address, complete the following steps. 1. Select Tools > Setup. The Setup Tools dialog box displays. 2. Click the Tools Menu tab.
Changing an option on the Tools menu 12 FIGURE 240 Setup Tools dialog box (Tools menu tab) 3. Type a label for the option as you want it to appear on the Tools menu in the Menu Text field. 4. Select the application from the Tool list, or click Define if you want to specify a new tool. To specify a new tool, refer to “Adding a tool” on page 577. 5. (Optional) Enter parameters, such as a URL, in the Parameters field. 6. (Optional) Select a keyboard shortcut in the Keystroke list.
12 Removing an option from the Tools menu The Tool Menu Items table displays all configured tools, including the tool name as it displays on the Tools menu, parameters, and keystroke shortcuts. 3. Select the tool you want to edit in the Tool Menu Items table. The settings for the selected tool display in the fields at the top of the dialog box. 4. Edit the label for the option as you want it to appear on the Tools menu in the Menu Text field. 5. Select the application from the Tool list. 6.
Changing an option on a device’s shortcut menu 12 4. Choose one of the following options: - To display the menu option only for devices that meet the conditions listed, select the Match Conditions option. - To display the menu option on the shortcut menus for all devices, select the All option. If you select All, skip to step 8. Otherwise, continue to step 5. 5. Select the appropriate type in the Condition 1 Property name list. 6.
12 Removing an option from a device’s shortcut menu 5. Choose one of the following options: - To display the menu option only for devices that meet the conditions listed, select the Match Conditions option. - To display the menu option on the shortcut menus for all devices, select the All option. If you select All, skip to step 8. Otherwise, continue to step 5. 6. Change the type in the Condition 1 Property name list. 7. Change the value for the selected property in the Condition 1 Value field. 8.
Microsoft System Center Operations Manager (SCOM) plug-in 12 Microsoft System Center Operations Manager (SCOM) plug-in NOTE The System Center Operations Manager (SCOM) plug-in is only supported on Windows. NOTE The SCOM plug-in is only available on Professional Plus and Enterprise. NOTE You must have SCOM Management privileges to access the Plug-in for SCOM dialog box. For more information about privileges, refer to “User Privileges” on page 2151.
12 Microsoft System Center Operations Manager (SCOM) plug-in 1. Select Tools > Plug-in for SCOM. The Plug-in for SCOM dialog box displays. 2. Click Add. The Add SCOM Server dialog box displays. 3. Enter an IP address or fully qualified domain name for the SCOM host in the Host field. The Management application accepts IP addresses in IPv4 and IPv6 formats. The IPv4 format is valid when the operating system has IPv4 mode only or dual stack mode.
Chapter 13 Server Management Console In this chapter • Server Management Console overview . . . . . . . . . . . . . . . . . . . . . . . . . . . . • Services tab . . . . . . . . . . . . . . . . . . . . . . . . . . . . . . . . . . . . . . . . . . . . . . . . . . • Ports tab. . . . . . . . . . . . . . . . . . . . . . . . . . . . . . . . . . . . . . . . . . . . . . . . . . . . . • AAA Settings tab . . . . . . . . . . . . . . . . . . . . . . . . . . . . . . . . . . . . . . . . . . . . . . • Restore tab. . . .
13 Services tab Launching the SMC on Linux NOTE The Server Management Console is a graphical user interface and should be launched from the XConsole on Linux systems. Perform the following steps to launch the Server Management Console on Linux systems. 1. On the Management application server, go to the following directory: Install_Directory/bin 2. Type the following at the command line: .
Services tab 13 3. Review the following information for each available service. • • • • Name — The name of the server; for example, FTP Server or Database Server. Process Name — The name of the process; for example, postgres.exe (Database Server). Status — The status of the service; for example, started or stopped. Start Time — The date and time the service started. The Start Time for Service Location Protocol displays as ‘Not Available’. 4. Click Close to close the Server Management Console.
13 Services tab Starting all services NOTE The Start button restarts running services in addition to starting stopped services which causes client-server disconnect. To start all services, complete the following steps. 1. Launch the Server Management Console. 2. Click the Services tab. 3. Click Start to start all services. NOTE If the server is configured to use an external FTP server, the Server Management Console does not attempt to start the built-in FTP service. 4.
Ports tab 13 6. Select the database user name for which you want to change the password in the User Name field. Options include dcmadmin and dcmuser. Changing the dcmadmin password requires all Management application services, except for the database server, to be stopped and then re-started. Changing the dcmuser password requires all ODBC remote client sessions to be restarted. 7. Enter your current password in the Old Password field. 8.
13 AAA Settings tab AAA Settings tab Authentication enables you to configure an authentication server and establish authentication policies. You can configure the Management application to authenticate users against the local database (Management application server), an external server (RADIUS, LDAP, CAC or TACACS+), or a switch. Authentication is configured to the local database by default.
AAA Settings tab 13 1. Select the AAA Settings tab (Figure 242). FIGURE 242 AAA Settings tab 2. Select Radius Server from the Primary Authentication list. 3. Add or edit a Radius server by referring to “Configuring a Radius server” on page 592. 4. Rearrange the Radius servers in the table by selecting a server and click the Up or Down button to move it. 5. Delete a Radius server by selecting the server and click Delete. 6. Test the established active connection with the Radius server by clicking Test.
13 AAA Settings tab Configuring a Radius server To add or edit a Radius server, complete the following steps. 1. Choose one of the following options from the AAA Settings tab: • Click Add. • Select an existing Radius server and click Edit. The Add or Edit Radius Server dialog box displays (Figure 243). FIGURE 243 Add or Edit Radius Server 2. Enter the radius server’s IP address in the IP Address field. 3. Enter the TCP port, if necessary, used by the Radius server in the TCP Port field. Default is 1812.
AAA Settings tab 13 Configuring LDAP server authentication NOTE You cannot configure multiple Active Directory groups (domains) for the LDAP server. NOTE You cannot enter Domain\User_Name in the Management application dialog box for LDAP server authentication.
13 AAA Settings tab FIGURE 244 AAA Settings tab - LDAP server 3. Add or edit an LDAP server by referring to “Configuring an LDAP server” on page 595. The LDAP Servers and Sequence table displays the following information: • • • • • Network Address — The network address of the LDAP server. Authentication Type — The authentication type (such as CHAP). Security — Whether or not security is enabled. TCP Port — The TCP port number of the LDAP server.
AAA Settings tab 13 • LDAP Servers Not Reachable • LDAP Authentication Failed • User Not Found in LDAP 10. Set the authorization preference by selecting one of the following options from the Authorization Preference list: • Local Database Use the LDAP server for authentication and the Management application local database for authorization. The user name in the local database must match the LDAP user name (password does not need to match) and must have the appropriate roles and AORs.
13 AAA Settings tab FIGURE 245 Add or Edit LDAP server 4. Enter the LDAP server’s hostname in the Network address field. If DNS is not configured in your network, provide an IP address instead of the hostname. 5. Enable security by selecting the Security Enabled check box. When you enable security, the TCP port number automatically changes to port 636 and you must enable certificate services on the LDAP server. 6. Enter the TCP port used by the LDAP server in the TCP Port field.
AAA Settings tab 13 FIGURE 246 AAA Settings tab - TACACS+ server 3. Add or edit a TACACS+ server by referring to “Configuring a TACACS+ server” on page 598. 4. Rearrange the TACACS+ servers in the table by selecting a server and click the Up or Down button to move it. 5. Delete a TACACS+ server by selecting the server and click Delete. 6. Test the established active connection with the TACACS+ server by clicking Test. The Test Authentication dialog box displays. 7.
13 AAA Settings tab Configuring a TACACS+ server To add or edit a TACACS+ server, complete the following steps. 1. Choose one of the following options from the AAA Settings tab: • Click Add. • Select an existing TACACS+ server and click Edit. The Add or Edit TACACS+ Server dialog box displays (Figure 245). FIGURE 247 Add or Edit TACACS+ Server 2. Enter the TACACS+ server’s hostname in the Network Address field. If DNS is not configured in your network, provide an IP address instead of the hostname. 3.
AAA Settings tab 13 Configuring Common Access Card authentication NOTE Common Access Card (CAC) authentication does not support SMI Agent and launch-in-context dialog boxes. NOTE CAC authentication is only supported on Windows systems. Common Access Card (CAC) authentication requires the following preparations: • Make sure to connect the CAC reader to the Management application client workstation. • Make sure to obtain and install the active client library on the client workstation.
13 AAA Settings tab FIGURE 248 AAA Settings tab - CAC server 3. Set the authorization preference by selecting one of the following options from the Authorization Preference list: • Local Database — Uses the AD server for authentication and the Management application local database for authorization. • Primary Authentication Server — Uses the AD server for authentication and authorization.
AAA Settings tab 13 Configuring switch authentication Switch authentication enables you to authenticate a user account against the switch database and the Management application server. You can configure up to three switches and specify the fall back order if one or more of the switches is not available. NOTE Switch authentication is only supported on Fabric OS devices. To configure switch authentication, complete the following steps. 1. Select the AAA Settings tab. 2.
13 AAA Settings tab 1. Select the AAA Settings tab. 2. For Primary Authentication, select Windows Domain. 3. Enter the domain name in the Windows Domain Name field. 4. Set secondary authentication by selecting one of the following options from the Secondary Authentication list: • Local Database • None 5. Click Test. The Test Authentication dialog box displays. 1. In the User ID field, choose one of the following options: • To authenticate a user account against the current domain, enter your user name.
Radius server configuration 13 Displaying the client authentication audit trail All responses to authentication requests coming from clients are logged to an audit trail log file. This file is automatically backed up on the first day of every month. 1. Select the AAA Settings tab. 2. Click Display next to Authentication Audit Trail. The Login dialog box displays. 3. Enter your username and password in the appropriate fields and click OK. The defaults are Administrator and password, respectively.
13 Radius server configuration secret shortname = password = GVM1 server } 3. Save and close the file. Configuring user authorization for the Radius server The user configuration file contains the individual user profiles. 1. Open the user configuration file (such as users.conf) a text editor (such as Notepad). 2.
LDAP server configuration 13 2. Change the attribute to use the sequence number 9 as follows. ATTRIBUTE NM-Roles-AORs-List 9 string 3. Save and close the file. 4. Open the Radius server dictionary file in a text editor (such as Notepad). 5. Enter the following to add the Management application dictionary file to the Radius server dictionary file: $INCLUDE dictonary.NM_AAA_dictionary 6. Save and close the file.
13 LDAP server configuration 4. Enter a name in the Full name field 5. Enter a log on name in the User logon name field. 6. Click Next. 7. Select the Password Never Expires option and click Next. 8. Click Finish. The new user displays in the Users pane. 9. Right-click the new user in the Users pane and select Reset Password. 10. Assign a new password with at least one special character and one number and click OK.. 11. Close the Active Directory Users and Computers dialog box.
LDAP server configuration 13 If Active Directory Schema does not display the Available standalone snap-ins list, you must configure it on the LDAP server (refer to “Configuring the Active Directory Schema on the LDAP server” on page 608). 6. Click Close on the Add Standalone Snap-in dialog box. 7. Click OK on the Add/Remove Snap-in dialog box. 8. Right-click the Attributes folder (Console Root/Active Directory Schema/Attributes) and select New > Attribute. The Create a New Attribute dialog box displays.
13 LDAP server configuration After you restart the AD server, go to “Configuring authorization details on the external LDAP server” on page 608. Configuring the Active Directory Schema on the LDAP server 1. Select Start > Run. 2. Type regsvr32 schmmgmt.dll and press Enter. Make sure that the following message displays: Dll register Server in schmmgmt.dll succeeded. 3. Select Start > Run. 4. Type mmc and press Enter. 5. Select File > Add/Remove Snap-in. The Add/Remove Snap-in dialog box displays. 6.
LDAP server configuration 13 The String Attribute Editor dialog box displays. 5. Enter the areas of responsibility (such as, All Fabrics, All IP Products, and All Hosts) in the Value field and click OK.. 6. Select NmRoles in the Attributes list and click Edit. 7.
13 LDAP server configuration Select multiple roles and AORs by holding down the CTRL key and clicking more than one role and AOR. 4. Select the AD group to which you want to assign the selected roles and AORs in the Active Directory Groups table. If the AD group you want does not display in the table, refer to “Loading an AD group” on page 610. 5. Click the right arrow button. The selected roles and AORs are moved to the Active Directory Groups table. 6.
LDAP server configuration 13 FIGURE 250 Fetch AD Group dialog box 4. Select the LDAP server network address from the Network Address list. 5. Enter the TCP port number in the TCP Port field, if necessary. The default TCP port number is 389 if security is not enabled. The default TCP port number is 636 if security is enabled. 6. Select the authentication protocol MD5 from the Authentication Type list. 7. Enter your LDAP server user login name in the User Name field. 8.
13 Restore tab Deleting an AD group Deleting an AD group deletes the roles and AORs assigned to the group and removes the group from the Active Directory Groups table. To delete an AD group, complete the following steps. 1. Select one or more AD groups that you want to delete from the Active Directory Groups table. 2. Click Delete. 3. Click Yes on the confirmation message. 4. Click OK on the deletion successful message. 5. Click OK to save your work.
Technical Support Information tab 13 FIGURE 251 Restore tab 4. Click Browse to select the path (defined in the Output Directory field on the Options dialog box - Backup pane) to the database backup location. 5. Click Restore. Upon completion, a message displays the status of the restore operation. Click OK to close the message and the Server Management Console. For the restored data to take effect, re-launch the Configuration Wizard using the instructions in “Launching the Configuration Wizard” on page 6.
13 Technical Support Information tab 1. Select the Technical Support Information tab. FIGURE 252 Technical Support Information tab 2. Select the Include database check box to capture database server support save files and choose one of the following options: • Select the Partial option to exclude historical data and events from the database capture. • Select the Full option to include historical data and events from the database capture.
HCM Upgrade tab 13 HCM Upgrade tab The HCM Upgrade tab enables you to upgrade the Management application to include a new version of HCM. Upgrading HCM on the Management server To upgrade HCM, complete the following steps. 1. Select the HCM Upgrade tab. FIGURE 253 HCM Upgrade tab 2. Click Browse to select the HCM installation folder location (for example, C:\Program Files\BROCADE\Adapter on Windows systems and /opt/brocade/adapter on Linux systems). 3. Click Upgrade. 4. Click Close.
13 SMI Agent Configuration Tool • Certificate Management tab — enables you to import Client and Indication certificates, export Server certificates, as well as view and delete current certificates. • Summary tab — enables you to view the CIMOM server configuration and current configuration. Launching the SMIA configuration tool on Windows NOTE All Management application services must be running before you can log into the SMIA Configuration Tool.
SMI Agent Configuration Tool 13 FIGURE 255 SMIA Configuration Tool dialog box Launching the SMIA configuration tool on Unix NOTE All Management application services must be running before you can log into the SMIA Configuration Tool. To start the Management application services, click Start on the Server Management Console dialog box. Perform the following steps to launch the Server Management Console on Unix systems. 1.
13 SMI Agent Configuration Tool Launching a remote SMIA configuration tool To launch a remote SMIA configuration tool, complete the following steps. 1. Open a web browser and enter the IP address of the Management application server in the Address bar. If the web server port number does not use the default (443 if is SSL Enabled; otherwise, the default is 80), you must enter the web server port number in addition to the IP address. For example, IP_Address:Web_Server_Port_Number.
SMI Agent Configuration Tool 13 By default, the Management application SMI Agent is configured to advertise itself as a Service Agent (SA). The advertised SLP template shows its location (IP address) and the WBEM Services it supports.
13 SMI Agent Configuration Tool ,(RegisteredProfilesSupported=SNIA:SMI-S,DMTF:Profile Registration,SNIA:FC HBA,DMTF:LaunchInContext,SNIA:Fan,SNIA:Fabric,SNIA:Switch,DMTF:Role Based Authorization,SNIA:Power Supply,SNIA:Sensors,SNIA:Server) • slptool findattrs service:wbem:http://IP_Address:Port NOTE Where IP_Address:Port is the IP address and port number that display when you use the slptool findsrvs service:wbem command.
SMI Agent Configuration Tool 13 4. Type # Install_Home/cimom/bin/slptool findsrvs service:wbem and press Enter to verify the SLP service is advertising its WBEM services. 5. Choose one of the following options to verify the SLP service is advertising the WBEM SLP template over its configured client protocol adapters. • Type # Install_Home/cimom /bin/slptool findattrs service:wbem:http://IP_Address:Port and press Enter.
13 SMI Agent Configuration Tool Home tab The Home tab of the SMIA Configuration Tool enables you to access the following Management application features or information: • Fabric Discovery — enables you to view discovered fabrics, discover new fabrics, as well as edit the default SNMP configuration. For step-by-step instructions, refer to “Discovering fabrics” on page 40. • Host Discovery — enables you to view discovered hosts, discover new hosts, as well as edit the default SNMP configuration.
SMI Agent Configuration Tool 13 Authentication tab NOTE You must have User Management Read and Write privileges to make changes on the CIMOM tab. For more information about privileges, refer to “User Privileges” on page 2151. The Authentication tab enables you to configure mutual authentication for Client and Indication using a secure protocol.
13 SMI Agent Configuration Tool 4. Click Apply. NOTE Changes on this tab take effect after the next CIMOM server restart. NOTE You can only restart the server using the Server Management Console (Start > Programs > Management_Application_Name 12.X.X > Server Management Console). 5. Click Close to close the SMIA Configuration Tool dialog box. Configuring CIMOM server authentication CIMOM server authentication is the authentication mechanism between the CIM client and the CIMOM Server.
SMI Agent Configuration Tool 13 CIMOM tab NOTE You must have SAN - SMI Operation Read and Write privileges to view or make changes on the CIMOM tab. For more information about privileges, refer to “User Privileges” on page 2151. The CIMOM tab enables you to configure the CIMOM server port, the CIMOM Bind Network Address, and the CIMOM log. Configuring the SMI Agent port number To configure the SMI Agent port number, complete the following steps. 1. Click the CIMOM tab. FIGURE 257 CIMOM tab 2.
13 SMI Agent Configuration Tool 4. Click Apply. NOTE Changes on this tab take effect after the next CIMOM server restart. NOTE You can only restart the server using the Server Management Console (Start > Programs > Management_Application_Name 12.X.X > Server Management Console). If you disabled SSL, a confirmation message displays. Click Yes to continue. 5. Click Close to close the SMIA Configuration Tool dialog box.
SMI Agent Configuration Tool 13 Configuring the CIMOM log NOTE You must have SAN - SMI Operation Read and Write privileges to view or make changes on the CIMOM tab. For more information about privileges, refer to “User Privileges” on page 2151. To configure the CIMOM log, complete the following steps. 1. Click the CIMOM tab. 2. Select a log category from the Log Level list to start logging support data for the server. Options include the following: • Off — select to turn off logging support data.
13 SMI Agent Configuration Tool Certificate Management tab NOTE You must have SMI Operation Read and Write privileges to view or make changes on the Certificate Management tab. For more information about privileges, refer to “User Privileges” on page 2151. The Certificate Management tab enables you to manage your CIM client and Indication authentication certificates.
SMI Agent Configuration Tool 13 5. Click Import. The new certificate displays in the Certificates list and text box. If the certificate location is not valid, an error message displays. Click OK to close the message and reenter the full path to the certificate location. If you did not enter a certificate name, an error message displays. Click OK to close the message and enter a name for the certificate. If the certificate file is empty or corrupted, an error message displays.
13 SMI Agent Configuration Tool Deleting a certificate NOTE You must have SMI Operation Read and Write privileges to view or make changes to the Certificate Management tab. For more information about privileges, refer to “User Privileges” on page 2151. To delete a certificate, complete the following steps. 1. Click the Certificate Management tab. 2. Select Client or Indication from the Authentication list. The appropriate certificates display in the Certificates list. 3.
SMI Agent Configuration Tool 13 1. Click the Summary tab. FIGURE 259 Summary tab 2. Review the summary. NOTE When the CIMOM server is stopped, the server configuration information does not display on the Summary tab. The following information is included in the summary. Field/Component Description Client Mutual Authentication Displays whether or not the client mutual authentication is enabled or disabled for the Server Configuration and the Current Configuration.
13 SMI Agent Configuration Tool Field/Component Description Log Level Displays the log level for the Server Configuration and the Current Configuration. Options include the following: • 10000 — Off • 1000 — Severe • 900 — Warning • 800 — Info (default) • 700 — Config • 500 — Fine • 400 — Finer • 300 — Finest • 0 — All Managed Ports Displays the number of managed ports. For more information about managed port count rules, refer to “Managed count” on page 35.
Chapter 14 SAN Device Configuration In this chapter • Configuration file management . . . . . . . . . . . . . . . . . . . . . . . . . . . . . . . . . . • Enhanced group management . . . . . . . . . . . . . . . . . . . . . . . . . . . . . . . . . . . • Firmware management . . . . . . . . . . . . . . . . . . . . . . . . . . . . . . . . . . . . . . . . . • Frame viewer . . . . . . . . . . . . . . . . . . . . . . . . . . . . . . . . . . . . . . . . . . . . . . . . . • Ports . . . . . . . . . . . . . . . . .
14 Configuration file management • Defining a schedule (Configuration File > Schedule Backup) (refer to “Scheduling switch configuration backup” on page 636) • Defining adaptive backup (Discovery or Event-triggered) (refer to “Adaptive backup” on page 635) Saving switch configurations on demand or manually Configuration files are uploaded from the selected switches and stored in individual files only for the Professional edition. Files are named with the convention cfg_switch_name_Date_Time.
Configuration file management 14 Adaptive backup Adaptive backup is triggered based on fabric discovery and when configuration change events is received from a switch. Discovery backup Switch or fabric discovery automatically triggers discovery backup for all switches in the fabric which have the correct user credentials. To discover a switch, refer to “Discovering fabrics” on page 40. Discovery configuration files display in the Configuration File Manager dialog box with the Backup Type as Discovery.
14 Configuration file management To restore a switch configuration, complete the following steps. 1. Right-click a device in the Product List or the Connectivity Map, and select Configuration File > Restore. The Restore Switch Configuration dialog box displays. FIGURE 261 Restore Switch Configuration dialog box 2. Select the switch configuration you want to download from the Saved Switch Configurations table. 3. Click OK. The configuration is downloaded to the device.
Configuration file management 14 1. Select Configure > Configuration File > Schedule Backup. The Schedule Backup of Switch Configurations dialog box displays. FIGURE 262 Schedule Backup of Switch Configurations dialog box 2. Select the Enable scheduled backup check box. 3. Set the Schedule parameters. These include the following: - The desired Frequency for backup operations (daily, weekly, monthly). The Day you want backup to run. If Frequency is Daily, the Day list is unavailable.
14 Configuration file management • Clear the Backup all fabrics check box and select the specific fabric Backup check boxes in the Selected Fabrics table to back up individual fabrics. The Selected Fabrics table includes the following information: • Fabric Name — The world wide name of the fabric selected for backup configuration. • Status — The status of the fabric selected for backup configuration; for example, unknown or marginal.
Configuration file management 14 FIGURE 263 Switch Configurations tab The Switch Configurations tab contains the following fields and components: • Trigger Backup on Events check box — Select to collect backup configurations triggered by events (refer to “Event -triggered backup”). Clear the check box to not collect backup configurations triggered by events. Trigger Backup on Events is only supported on Fabric OS devices running 7.2.1 or later.
14 Configuration file management • Restore button — Select one or more configuration files from the Configurations table and click to restore that configuration. To restore a configuration, refer to “Restoring a configuration from the repository” on page 640. • View button — Select a row in the Configurations table and click to display the contents of the selected configuration. Refer to “Viewing configuration file content” on page 642.
Configuration file management 14 FIGURE 264 Saved Switch Configurations dialog box The Saved Switch Configurations table displays the following information: • Keep check box — Select to keep the associated configuration past the defined age limit. The configuration will be kept until it is manually deleted, or until the Keep check box is cleared to enable the age limit again.
14 Configuration file management The configuration is downloaded to the device. If necessary, the restoration process prompts you to disable and reboot the device before the configuration begins. This lets you determine whether the configuration backup should be performed immediately or at a later time. If you confirm the restoration, the entire configuration is restored; you cannot perform selective download for specific configuration sections.
Configuration file management 14 FIGURE 265 Configuration file content 5. Click Close to close the dialog box. Searching the configuration file content NOTE This feature requires a Trial or Licensed version. To search the configuration file content, complete the following steps. 1. Right-click a device in the Product List or the Connectivity Map, and select Configuration File > Configuration File Manager. The Configuration File Manager dialog box displays. 2. Click the Switch Configuration tab.
14 Configuration file management FIGURE 266 Searching Configuration file content 6. Click Close to close the dialog box. Deleting a configuration NOTE This feature requires a Trial or Licensed version. NOTE Baseline configurations and the latest configurations will not be deleted. 1. Right-click a device in the Product List or the Connectivity Map, and select Configuration File > Configuration File Manager. The Configuration File Manager dialog box displays. 2. Click the Switch Configurations tab.
Configuration file management 14 2. Select the configuration you want to export, and click Export. The file appropriate to your operating system displays. 3. Click the file to select the location into which you want to export the configuration. 4. Click Export. The configuration is automatically named (cfg_Switch_name_Date_and_Time) and exported to the location you selected. Importing a configuration NOTE This feature requires a Trial or Licensed version. 1.
14 Configuration file management FIGURE 267 Compare dialog box The Compare dialog box displays the following information: • Product — The name of the switch. • Date — Displays the date the switch configuration was taken. • Change Navigator buttons/legend — The Change Navigator buttons and legends are enabled when there is at least one change between two compared files.
Configuration file management 14 • Find — Enter a text string and take one of the following actions: - Click Find Next — Searches for the next matching string in the configuration. - Click Find Previous — Searches for the previous matching string in the configuration. • Highlight button — Click to highlight the text string. • Match Case check box — Click to render the search case-sensitive. • Repeats check box — Click to continue the search at the top when the bottom is reached.
14 Configuration file management Tracking changes from the baseline configuration Use change tracking to compare the latest backup configuration file with the configuration that is designated as the baseline. NOTE Change Tracking tab is not displayed for imported, unmanaged, or unmonitored switches. 1. Click the SAN tab. 2. Select Configure > Configuration File > Configuration File Manager. The Configuration File Manager dialog box displays. 3. Click the Change Tracking tab.
Configuration file management 14 • Backup Type — Backup options include the following types: - Discovery — The discovery backup is obtained after the discovery process. - Event Triggered— Occurs when a trap is generated by the device during a configuration change. - Manual — Occurs when you click the Save Running/Startup Configuration button. Scheduled — Occurs when backup is obtained at the scheduled time. 4.
14 Configuration file management TABLE 58 Step 2. Configuration Type Field/Component Description All FC option Replicates the entire configuration, including security settings. Warning: This is a disruptive operation and selected destination switches will be disabled prior to downloading the configuration. Partial FC option Replicates a part of the FC configuration. Select one of the following options: • Fabric Watch option — Lists switches with Fabric Watch configurations that you can replicate.
Configuration file management TABLE 60 14 Step 4. Source Configuration (Continued) Field/Component Description Additional Port Info Additional information about the port. Attached Port # The number of the attached port. BB Credit The BB Credit of the port. Class The class value of the FICON device port. Contact The primary contact at the customer site. Description A description of the customer site. Domain ID The switch port’s top-level addressing hierarchy of the domain.
14 Configuration file management TABLE 61 Step 5. Destination Switches (Continued) Field/Component 652 Description Attached Port # The number of the attached port. BB Credit The BB Credit of the port. Class The class value of the FICON device port. Contact The primary contact at the customer site. Description A description of the customer site. Domain ID The switch port’s top-level addressing hierarchy of the domain. FC Address The Fibre Channel address of the port.
Configuration file management TABLE 62 14 Step 6. Validation Field/Component Description Validation Settings table The replication settings that have been configured in previous steps; for example, the configuration type, source configuration, and destination settings. Click Finish to approve the settings. Disable Destination Switch check box Select to disable the destination switch during replication. TABLE 63 Step 7.
14 Configuration file management TABLE 64 Field/Component Description AD/LDAP Server option Select to replicate the Active Directory/Lightweight Directory Access Protocol (AD/LDAP) Server security policy. If both the source and destination devices are running Fabric OS 7.1 or later, also replicates the LDAP Role mapping configuration. DCC Policy option Select to replicate the Device Connection Control (DCC) security policy.
Configuration file management TABLE 66 14 Step 4. Select Destination Switches Field/Component Description Available Switches table Lists the available switches you can select to be applied to the selected switches table. Name The name of the available switch. Device Type The type of device port. Tag The tag number of the port. Serial # The serial number of the switch. WWN The switch port’s world wide name. IP Address The switch port’s IP address.
14 Enhanced group management Enhanced group management Use Enhanced Group Management (EGM), a separate licensed feature, to control access to specific features on Fabric OS devices. The features affected include the following: • Firmware Download - enables you to perform group firmware download. For specific instructions for firmware download, refer to “Firmware management” on page 656. • Security - enables you to perform Group Security Policy Replication.
Firmware management 14 Downloading firmware NOTE Non-disruptive firmware download (HCL) is not supported when downgrading from Fabric OS version 6.2 to 6.1. You must remove all non-default logical switches and disable Virtual Fabrics before downgrading. NOTE You cannot use Fabric OS firmware download with command line options in the Management application. You can download firmware using the Firmware Management dialog box. 1. Select Configure > Firmware Management.
14 Firmware management If you have your FTP server configured to use an external FTP server, the Firmware to Download column is empty. 6. (External FTP, SCP, or SFTP server) If you configured an external FTP, SCP, or SFTP server, choose from one of the following options in the External FTP/SCP/SFTP Server area: • Select the FTP server option to download from the external FTP server and configure the following on the FTP server: a. Create a user name and password. b.
Firmware management 14 Displaying the firmware repository The firmware repository is available on the Firmware Management dialog box. The Management application supports .zip and .gz compression file types for firmware files. Initially, the firmware repository is configured to use the built-in FTP, SCP, or SFTP server. To use an external FTP server, refer to “Configuring an external FTP, SCP, or SFTP server” on page 220.
14 Firmware management • Release Notes View button — Click to view the release notes, if imported, which contain information about downloading firmware. For internal built-in FTP, SCP, or SFTP servers or external SCP or SFTP servers running on the same system as the Management application, if there is a space in the release note file name, you will not be able to view the release notes.
Switch password management 14 6. Enter or browse to the location of the MD5 file (.md5 file type). If the MD5 checksum file is located in the same directory as the firmware file and has the same file name (with the md5 extension), this field is auto-populated. The MD5 checksum file can be obtained from the Fabric OS product download site in the same location as the firmware file.
14 Switch password management NOTE You should change the switch password before the expiriration date; however, if the switch password expires, you must provide valid credentials in the Discovery dialog box. Changing the switch password To change the switch password, complete the following steps. 1. Select Configure > Switch Password. The Manage Switch Password dialog box displays, as shown in Figure 272.
Switch password management 14 If you select an unmanaged switch, an error messages displays. Click OK to close the error message. 4. Click Fetch User. The Filter field in the Results table of the Manage Switch Password dialog box supports text, regular expressions, multiple values delimited with commas, and wildcards. The users for the selected switches display in the Results table (as shown in Figure 273). FIGURE 273 Manage Switch Password dialog box - Results table 5.
14 Switch password management NOTE Passwords must be from 8 through 40 characters long and cannot contain a colon (:). 8. Click OK. The Change Password Summary dialog box displays. NOTE If the password change is sucessful for the “admin” (account used for discovery), the password is updated in the database. Resetting the switch password To reset the switch password, complete the following steps. 1. Select Configure > Switch Password.
Frame viewer 14 6. Enter the new password in the New Password and Confirm Password fields. 7. Click OK. The Reset Password Summary dialog box displays. Frame viewer NOTE Frame viewer is only supported on devices running Fabric OS 7.1.0 or later. Frame viewer enables you to view a list of devices with discarded frames due to c3 timeout, destination unreachable, and not routable. You can also view a summary of discarded frames for each device and clear the discarded frame log on the device.
14 Frame viewer • Discarded Frames — Whether the device frame log contains discarded frame records. Valid values include yes or no. 3. Select a device in the top table to view detailed data about the discarded frames on that device. • Discarded Frame History for the Selected Product table — Summary of the discarded frames for the selected device.
Frame viewer 14 NOTE Only frame logs of the discard types that are enabled on the switch are displayed. 4. Click Close. Viewing discarded frames from a port 1. Select a port on a Fabric OS device running 7.1.0 or later and select Monitor > Discarded Frames. The Discarded Frames dialog box displays. 2. Review the data for the discarded frames from the selected port. • Discarded Frame History for the Selected Product table — Summary of the discarded frames for the selected port.
14 Ports • Refresh button — Click to fetch new data from the frame log on the switch (“Refreshing the discarded frame log” on page 668). Frame log records are not stored in the database. • Add Flow button — Select a device in the upper table and click to add a flow definition (refer to “Flow Monitor” on page 1737). NOTE Flow Vision is supported on platforms running Fabric OS 7.2 and later. 3. Click Close. Clearing the discarded frame log 1.
Ports 14 FIGURE 277 Port Connectivity View dialog box The following details the information located (in default order) on the Port Connectivity View dialog box. • Fabric / Switch Name — If launched from a fabric, displays the fabric name. If launched from a switch, displays the fabric name and the switch name. • Filter check box / link — Select to filter results (refer to “Filtering port connectivity” on page 672) in the Port Connectivity View dialog box.
14 670 Ports - Area ID /Port Index — The area ID and the port index of the port. - Port WWN — The world wide name of the port. - Status — The port’s status; for example, Enabled, Faulty, Healthy, Unknown, and so on. - Long Distance — Whether the connection is considered to be normal or longer distance. - Device FC Address — The port FC address of the connected Host or target device. - Device Node WWN — The world wide name of the device node. - Port IP Address — The port’s IP address.
Ports 14 - Parameter — Device parameters. - Vendor — The hardware vendor’s name. - Switch Status — The operational status. There are four possible operation status values: Unit Type — The switch unit type. Capability — The device capability of the connected device port. The value is mapped depending on whether it is a name server (NS) or a FICON device. Host Name — The name of the Host. Switch IP — The switch’s IP address. Switch Version — The switch’s version number.
14 Ports Enabling a port To enable a port from the port connectivity view, right-click the port you want to enable from the Port Connectivity View dialog box and select Disable/Enable Port > Enable. Disabling a port To disable a port from the port connectivity view, right-click the port you want to disable from the Port Connectivity View dialog box and select Disable/Enable Port > Disable. Filtering port connectivity To filter results from the port connectivity view, complete the following steps. 1.
Ports 14 The Port Connectivity View dialog box displays. If filtering is already enabled, only those ports that meet the filter requirements display. To enable the filter, select the Filter check box. Resetting the filter Reset immediately clears all existing definitions. You cannot cancel the reset. To reset the Filter dialog box, complete the following steps. 1. Click the Filter link from the Port Connectivity View dialog box. The Filter dialog box displays. 2. Click Reset.
14 Ports 3. Sort the results by clicking on the column header. 4. Rearrange the columns by dragging and dropping the column header. 5. Click the close (X) button to close this dialog box. Viewing ports To view ports on the Connectivity Map, right-click a product icon and select Show Ports. NOTE Show Ports is not applicable when the map display layout is set to Free Form (default). NOTE This feature is only available for connected products.
Ports 14 2. Right-click a port and select Connected Port. The focus jumps to the connected port and the connection is highlighted. Viewing port connection properties You can view the information about products and ports on both sides of the connection. 1. Right-click the connection between two end devices on the Connectivity Map and select Properties. OR Double-click the connection between two devices on the Connectivity Map. The Connection Properties dialog box displays.
14 Ports TABLE 70 Port connection properties (Continued) Field Description 1-Tunnel ID The tunnel ID of the first switch. 1-Circuit ID The circuit ID of the first switch. 2-Port # The port number of the second switch. 2-Port Type The port type of the second switch. 2-WWPN The world wide port number of the second switch. 2-MAC Address The MAC address of the second switch. 2-IP Address The IP address of the second switch. 2-Trunk Whether there is a trunk on the second switch.
Ports TABLE 70 14 Port connection properties (Continued) Field Description FCIP Capable Whether the switch is FCIP capable or not. Flag (FICON related) Whether a FICON-related flag is on or off. Forward Error Correction (FEC) Whether FEC is enabled or disabled. GE Port # The GE port number of the switch. InBand Management State Whether inband management is enabled or disabled. iSCSI Capable Whether the switch is iSCSI capable or not. L2 Mode Whether the switch is in L2 mode or not.
14 Ports TABLE 70 Port connection properties (Continued) Field Description Switch The switch name. Tag The tag number of the switch. Trunking Enabled Whether trunking is enabled on the switch. Tunnel Count The number of tunnels on the switch. Tunnel ID The tunnel ID number of the switch. User Port # The user port number of the switch. VLAN ID The VLAN identifier. VPWWN State Whether the VPWWN state is enabled or disabled. VPWWN Type The VPWWN type: Auto or User.
Ports 14 Viewing port optics NOTE QSFP ports do not display in the Port Optics dialog box. Enables you to view port optics for FC, TE, GE, and XGE ports. To view port optics, complete the following steps. 1. Right-click the switch for which you want to view port optic information on the Connectivity Map and select Port Optics (SFP). The Port Optics (SFP) dialog box displays (Figure 280). FIGURE 280 Port Optics dialog box 2. Review the port optics information.
14 Ports Status icons: Warning icon — One of the five parameters exceeds the threshold of that parameter. The corresponding parameter field displays with a yellow background. No icon — No parameters exceed the threshold of that parameter. Unknown icon — The port is not a 16 Gbps capable port or the device is running Fabric OS 6.4.X or earlier. Error icon — Unable to retrieve status of the supported port. Slot/Port # — The slot and port number of the selected fabric.
Port commissioning 14 4. Sort the results by clicking on the column header. 5. Rearrange the columns by dragging and dropping the column header. 6. Click Close to close the Port Optics (SFP) dialog box. Refreshing port optics To refresh port optics, click Refresh. The Management application retrieves updated port optic information. Port commissioning NOTE Port commissioning is only supported on FICON devices running Fabric OS 7.1 or later.
14 Port commissioning • Make sure you have the following IBM Authorized Program Analysis Reports (APARs) for z/OS CIM (CIMOM) and port decommissioning on z/OS version 1, release 13: - OA38145 — z/OS CIM APAR in support of port decommissioning OA38303 and HA42524 — IOS port decommissioning APARs NOTE OA38303 requires OA40538 and OA40037.
Port commissioning 14 You can also configure port commissioning for E_Ports (“E_Port commissioning” on page 690), all ports on a blade (“Port commissioning by blade” on page 692), or all ports on a switch (“Port commissioning by switch” on page 691). CIMOM servers Before you can decommission or recommission an F_Port, you must register the CIMOM servers within the fabric affected by the action.
14 Port commissioning The application validates the mandatory fields. 9. Select the new CIMOM server in the Systems List and click Test to check connectivity. When testing is complete, the updated status displays in the Status column of the Systems List for the selected CIMOM server. 10. Click OK to save your work and save the CIMOM server details in the database. Viewing existing CIMOM servers NOTE Port commissioning is only supported on FICON devices running Fabric OS 7.1 or later.
Port commissioning 14 • Status — The system connectivity status. Updates when you test the reachability of the CIMOM server and when you contact the CIMOM server to respond to the F_Port decommission or recommission request. Valid status options include: OK — CIMOM server contact successful with current credentials. Not Contacted Yet — CIMOM servers configured, connectivity not tested yet. Credentials Updated — Credentials changed, connectivity not tested yet.
14 Port commissioning 9. Click OK to save your work and save the CIMOM server details in the database. Importing CIMOM servers and credentials You can import one or more CIMOM servers (system and credentials) using a CSV-formatted file. You can import a maximum of 2,000 CIMOM servers. 1. Select Configure > Port Commissioning > Setup. The Port Commissioning Setup dialog box displays (Figure 281). 2. Click Import to import CIMOM server information from a file.
Port commissioning 14 Changing CIMOM server credentials You can edit the CIMOM server credentials for one or more CIMOM servers at the same time. 1. Select Configure > Port Commissioning > Setup. The Port Commissioning Setup dialog box displays (Figure 281). 2. Select one or more CIMOM servers from the Systems List and click Change Credentials. The Edit Credentials dialog box displays. If you selected one CIMOM server, the credentials for the selected server display in the dialog box.
14 Port commissioning Deleting CIMOM server credentials 1. Select Configure > Port Commissioning > Setup. The Port Commissioning Setup dialog box displays (Figure 281). 2. Select one or more CIMOM servers from the Systems List and click the left arrow button. The details for the last selected CIMOM server row displays in the Add/Edit System and Credentials area. 3. Confirm that this is the CIMOM server you want to delete and click OK to delete the CIMOM server from the Port Commissioning Setup dialog box.
Port commissioning 14 NOTE If the CIMOM server is not reachable or the credentials fail, F_Port decommissioning do not occur. If all CIMOM servers are reachable, the Management application sends a CAL request to decommission the port. If some CIMOM servers are reachable and some CIM servers are not reachable, decommissioning fails and the Management application recommissions the decommissioned CIM instances.
14 Port commissioning E_Port commissioning Although you can use any of the following methods to access the E_Port commissioning commands, individual procedures only include one method. • From the main menu, select the E_Port in the Product List, and then select Configure > Port Commissioning > Decommission/Recommission > Port. • From the Product List, right-click the E_Port and select Decommission/Recommission > Port.
Port commissioning 14 Decommissioning an E_Port trunk Select the E_Port trunk in the Product List, and then select Configure > Port Commissioning > Decommission > Port or right-click E_Port trunk and select Decommission. The decommission request is sent to all the trunk members including the master, If a decommissioning request is triggered on a trunk level. An error message displays, if the trunk group is the only connection between the switches.
14 Port commissioning NOTE If the CIMOM server is not reachable or the credentials fail, port decommission does not occur. If all CIMOM servers are reachable, the Management application sends a CAL Request to decommission the port. If all the CIMOM servers are not reachable, decommissioning fails. If some CIMOM servers are reachable and some CIM servers are not reachable, decommissioning fails and the Management application recommissions the decommissioned CIM instances.
Port commissioning 14 Decommissioning all ports on a blade NOTE (Virtual Fabrics only) All ports on the blade must be managed by the Management application. NOTE Fabric tracking must be enabled (refer to “Enabling fabric tracking” on page 226) to maintain the decommissioned port details (such as port type, device port WWN, and so on). Do not accept changes in the Management application client. 1.
14 Port commissioning NOTE You can only recommission ports from the logical switch, not the physical chassis. While recommissioning is in progress, an up arrow icon displays next to the port icon in the Product List. You can view the port commissioning results in the deployment reports (refer to “Viewing a port commissioning deployment report” on page 695). When the recommission is complete, an application event displays in the Master Log detailing success or failure.
Port commissioning 14 • Date and Time — The date and time of the deployment. • Export — Select to export the results to CSV or HTML (refer to “Exporting and saving a report to a file” on page 696). • Email — Select to e-mail the results (refer to “E-mailing a report” on page 696). • Configuration Name — Name of the deployment. For example, Decommission/Recommission - switch_name, Decommission/Recommission switch_name - blade, or Decommission/Recommission - switch_name - Ports.
14 Port commissioning • Status — Status of the deployment. • Creator — Name of the user that performed the deployment. The Deployment Results contains the following parameters: • Configuration Name — Name of the deployment. For example, Decommission/Recommission - switch_name, Decommission/Recommission - switch_name - blade, or Decommission/Recommission switch_name - Ports. • Product — The product name. • Status — The status of the deployment. For example, Allowed or Failed.
Port commissioning 14 8. Browse to the location where you want to save the file and click Save. CIMCLI trouble shooting Use the following sections to obtain data to support trouble shooting. Obtaining FCPort and PCCUPort data To obtain CIMOM supporting documentation for troubles hooting, complete the following steps. 1. Log onto the TSO. NOTE You need a very large TSO user region size for the cimcli command. 2. From the ISPF Primary Option Menu, select option 6. 3.
14 Port commissioning 1. Select Monitor > Technical Support > SupportSave. The SupportSave dialog box displays. 2. Select the Server SupportSave check box to run supportsave on the server. 3. Enter a file name for the server support save file in the File Name field. The default file name is DCM-SS-Time_Stamp. 4. Select the Include Database check box to include the database in the support save and choose one of the following options.
Administrative Domain-enabled fabric support 14 Administrative Domain-enabled fabric support The Management application provides limited support for AD-enabled fabrics. An Administrative Domain (Admin Domain or AD) is a logical grouping of fabric elements that defines which switches, ports, and devices you can view and modify. An Admin Domain is a filtered administrative view of the fabric. NOTE If you do not implement Admin Domains, the feature has no impact on users and you can ignore this section.
14 Administrative Domain-enabled fabric support • If you try to enable Virtual Fabrics on an AD-enabled switch, that operation fails with the following message: “Failed to enable Virtual Fabric feature for Chassis (Remove All ADs before attempting to enable VF).” • Performs performance management (including Advance Performance Monitoring and Top Talkers) data collection and reports in a physical fabric context.
Port Auto Disable TABLE 71 14 Feature support for AD-enabled fabrics (Continued) Feature AD context ADO AD255 Not supported All AD User interface impact Performance Management > Configure Thresholds End-to-End Monitors Clear Counters X Filters AD-enabled fabric from the Fabrics list. Port Auto Disable X Filters AD-enabled fabric from the dialog box. Port Connectivity X Disables menu for a switch in an AD-enabled fabric. Port Fencing X Filters AD-enabled fabrics from the product tree.
14 Port Auto Disable Port Auto Disable (PAD) allows you to enable and disable Port Auto Disable on individual FC_ports or on all ports on a selected device, as well as unblock currently blocked ports.
Port Auto Disable 14 An information message displays the number of block ports for the fabric, if any. 3. Select one of the following from the Show list to determine what ports to display: • • • • All Ports (default) Disabled PAD Ports Enabled PAD Ports Blocked Ports 4. Review the port information: • Products/Ports tree — Displays devices and associated ports. Also, displays a Warning icon for blocked FC ports (displayed with the port icon).
14 Port Auto Disable • LIP (Loop Initialization Primitive Sequence) To configure the PAD event triggers, complete the following steps. 1. Select Monitor > Port Auto Disable. The Port Auto Disable dialog box displays. 2. Select the fabric on which you want to configure the PAD event triggers from the Fabric list. 3. Select All Ports from the Show list to filter the port list: 4. Select one or more ports or devices on which you want to configure the PAD event triggers. 5. Click Edit.
Port Auto Disable 14 Enabling Port Auto Disable on all ports on a device NOTE Port Auto Disable requires devices running Fabric OS 6.3 or later. To enable PAD on all ports on a device, complete the following steps. 1. Select Monitor > Port Auto Disable. The Port Auto Disable dialog box displays. 2. Select the fabric on which you want to configure PAD from the Fabric list. 3. Select All Ports from the Show list. 4. Select the device on which you want to enable PAD on all ports.
14 Port Auto Disable Disabling Port Auto Disable on all ports on a device NOTE Port Auto Disable requires devices running Fabric OS 6.3 or later. To disable port auto disable on all ports on a device, complete the following steps. 1. Select Monitor > Port Auto Disable. The Port Auto Disable dialog box displays. 2. Select the fabric on which you want to configure PAD from the Fabric list. 3. Select All Ports from the Show list. 4. Select the device on which you want to disable PAD on all ports.
Port Auto Disable 14 1. Select Monitor > Port Auto Disable. The Port Auto Disable dialog box displays. 2. Select the fabric on which you want to configure PAD from the Fabric list. 3. Select All Ports from the Show list, if necessary. 4. Select the device on which you want to resume PAD. Press CTRL and click to select multiple devices. 5. Click Enable (under Switch). PAD resumes on the selected device. 6. Click OK on the Port Auto Disable dialog box.
14 708 Port Auto Disable Brocade Network Advisor SAN + IP User Manual 53-1003155-01
Chapter 15 Host Port Mapping In this chapter • Host port mapping overview . . . . . . . . . . . . . . . . . . . . . . . . . . . . . . . . . . . . . • Creating a new Host . . . . . . . . . . . . . . . . . . . . . . . . . . . . . . . . . . . . . . . . . . . • Renaming an HBA Host. . . . . . . . . . . . . . . . . . . . . . . . . . . . . . . . . . . . . . . . . • Deleting an HBA Host . . . . . . . . . . . . . . . . . . . . . . . . . . . . . . . . . . . . . . . . . . • Viewing Host properties . . . . . . . .
15 Creating a new Host Creating a new Host To create a new Host, complete the following steps. 1. Right-click an HBA icon in the Fabric topology and select Host Port Mapping. The Host Port Mapping dialog box displays. FIGURE 284 Host Port Mapping dialog box The Host Port Mapping dialog box includes the following details: • HBAs table — All unassigned HBAs. Lists the following information for all available HBAs. You can sort the table by clicking once on any of the column titles.
Renaming an HBA Host 15 Renaming an HBA Host To rename a Host, complete the following steps. 1. Right-click an HBA icon in the Fabric topology and select Host Port Mapping. The Host Port Mapping dialog box displays. 2. Click the Host you want to rename in the Hosts table, wait a moment, and then click it again. The Host displays in edit mode. 3. Type a new name for the Host. The name of the Host appears in the Hosts table in alphabetical order with the new name.
15 Associating an HBA with a Host Associating an HBA with a Host ATTENTION Discovered information overwrites your user settings. To associate an HBA with a Host, complete the following steps. 1. Right-click an HBA icon in the Fabric topology and select Host Port Mapping. The Host Port Mapping dialog box displays. 2. Select the Host to which you want to assign HBAs in the Hosts table or click New Host to create a new Host. 3. Select the HBA from the HBAs table on the left and click the right arrow.
Importing HBA-to-Host mapping 15 4. Click Open on the Import dialog box. The file imports, reads, and applies all changes line-by-line and performs the following: • Checks for correct file structure and well-formed WWNs, and counts number of errors. If more than 5 errors occur, import fails and a ‘maximum error count exceeded’ message displays. Edit the Host port mapping file and try again. • Checks for duplicate HBAs. If duplicates exist, a message displays with the duplicate mappings detailed.
15 Removing an HBA from a Host Removing an HBA from a Host To remove an HBA from a Host, complete the following steps. 1. Right-click an HBA icon in the Fabric topology and select Host Port Mapping. The Host Port Mapping dialog box displays. 2. Select the HBA from the Hosts table on the right and click the left arrow. The HBA you selected is removed from the Hosts table and the HBA is no longer associated with the Host.
Exporting Host port mapping 15 4. Browse to the location where you want to save the export file. Depending on your operating system, the default export location are as follows: • Desktop\My documents (Windows) • \root (Linux) 5. Enter a name for the files and click Save. 6. Click OK to close the Host Port Mapping dialog box.
15 716 Exporting Host port mapping Brocade Network Advisor SAN + IP User Manual 53-1003155-01
Chapter 16 Storage Port Mapping In this chapter • Storage port mapping overview . . . . . . . . . . . . . . . . . . . . . . . . . . . . . . . . . . • Creating a storage array . . . . . . . . . . . . . . . . . . . . . . . . . . . . . . . . . . . . . . . . • Adding storage ports to a storage array. . . . . . . . . . . . . . . . . . . . . . . . . . . . • Unassigning a storage port from a storage array . . . . . . . . . . . . . . . . . . . . • Reassigning mapped storage ports . . . . . . . . . . . . . . . .
16 Creating a storage array Creating a storage array To create a storage array, complete the following steps. 1. Select a storage port icon in the topology view, then select Discover > Storage Port Mapping. The Storage Port Mapping dialog box displays with the following information. • Storage Ports table — Lists the following information for all available storage ports. You can sort the table by clicking once on any of the column titles. Fabric Name — The fabric name.
Unassigning a storage port from a storage array 16 4. Click the right arrow. The storage port is added to the Storage Array. 5. Click OK to save your work and close the Storage Port Mapping dialog box. If the storage device is part of more than one fabric, a message displays: The selected Storage_Name/Storage_WWN is part of more than one fabric. The port nodes associated with the other fabrics will automatically be moved to the storage array. Click OK to close the message.
16 Editing storage array properties 6. Click the right arrow button. The storage port moves from the Storage Ports table to the selected storage array. 7. Click OK to save your work and close the Storage Port Mapping dialog box. Editing storage array properties To edit storage array properties, complete the following steps. 1. Select a storage port icon in the topology view, then select Discover > Storage Port Mapping. The Storage Port Mapping dialog box displays. 2.
Viewing storage array properties 16 4. Review the properties. 5. Click OK on the Properties dialog box. 6. Click OK on the Storage Port Mapping dialog box. Viewing storage array properties To view storage array properties, complete the following steps. 1. Select a storage port icon in the topology view, then select Discover > Storage Port Mapping. The Storage Port Mapping dialog box displays. 2. Select a storage array from the Storage Array list. 3. Click Properties. The Properties dialog box displays.
16 Importing storage port mapping 4. Click Open on the Import dialog box. The file imports, reads, and applies all changes line-by-line and performs the following: • Checks for correct file structure (first entry must be the storage node name (WWN) and second entry must be the storage array name), well formed WWNs, and counts number of errors If more than 5 errors occur, import automatically cancels. Edit the storage port mapping file and try again.
Exporting storage port mapping 16 Exporting storage port mapping The Storage Port Mapping dialog box enables you to export a storage port array. The export file uses the CSV format. The first row contains the headers (Storage Node Name (WWNN), Storage Array Name) for the file. Example Storage Node Name (WWNN), Storage Array Name 20000004CFBD7100,New Storage Array 20000004CFBD896E,New Storage Array 20000037E19CED,New Storage Array To export a storage port array, complete the following steps. 1.
16 724 Exporting storage port mapping Brocade Network Advisor SAN + IP User Manual 53-1003155-01
Chapter 17 Wireless Management In this chapter • Wireless management overview. . . . . . . . . . . . . . . . . . . . . . . . . . . . . . . . . . • Wireless devices . . . . . . . . . . . . . . . . . . . . . . . . . . . . . . . . . . . . . . . . . . . . . . • Wireless device discovery . . . . . . . . . . . . . . . . . . . . . . . . . . . . . . . . . . . . . . . • Wireless devices on the dashboard . . . . . . . . . . . . . . . . . . . . . . . . . . . . . . . • Port groups. . . . . . . . . . . . . . . . . .
17 Wireless devices Wireless devices The Management application supports the following models of wireless controllers. TABLE 74 Wireless controller models Device Name Firmware required Aruba 3200XM ArubaOS_MMC_6.3.1.3_42233 Aruba 3400XM ArubaOS_MMC_6.3.1.3_42233 Aruba 3600XM ArubaOS_MMC_6.3.1.3_42233 Aruba 7210 ArubaOS_MMC_6.3.1.3_42233 Aruba 7220 ArubaOS_MMC_6.3.1.3_42233 Aruba 7240 ArubaOS_MMC_6.3.1.3_42233 RFS 4000 Mobility 5.3 or later RFS 6000 Mobility 5.
Wireless device discovery 17 Wireless device discovery The Management application enables you to discover individual wireless devices or multiple wireless devices using a discovery profile. NOTE Wireless access points in adaptive mode cannot be discovered by the Management application.
17 View management You can see all port groups; however, under each group, you can only see devices that belong to your area of responsibility (AOR). You can only see user-defined port groups that belong to your AOR.
Element Manager 17 Element Manager NOTE Wireless access points in adaptive mode do not display in the Management application. The Management application enables you to perform additional configuration of the wireless devices using an Element Manager (web-based graphical user interface (GUI)) or command line interface (CLI). The Element Manager (Brocade Mobility) is a software management application that allows full control of all managed features for the wireless devices in your IP network.
17 Element Manager If the device credentials do not match the credentials provided in discovery, the Element Manager login dialog box displays. Continue with step 2. 2. Enter your user name in the Username field. The default user name is admin. 3. Enter your password in the Password field. The default password admin123. 4. Click Login. The Element Manager displays. OR 1. Select a device in the Product List. 2. Select Configure > Element Manager > Web. The Element Manager login dialog box displays. 3.
Configuration repository and backup management 17 The Telnet session window displays. Configuration repository and backup management NOTE Requires Mobility 5.3 or later. Configuration repository and backup allows you to display each product configuration, including the name of the product, the version number of the configuration, the software release the product is running, and the product type, compare configurations, and backup configurations to the management server.
17 Cluster mode # you can pass either yes(1) or no(2) or stop the execution(3) # CLIConfigManager.ValueForConfirmationCLICommands=1 CLIConfigManager.ValueForConfirmationCLICommands.MinInt=1 CLIConfigManager.ValueForConfirmationCLICommands.MaxInt=3 CLIConfigManager.ValueForConfirmationCLICommands.IsDisplay=false 3. Save and close the file. Cluster mode A cluster is a set of wireless controllers working collectively to provide redundancy and load sharing.
Performance management 17 “Displaying VLANs in the VLAN view” on page 1443 “Displaying VLANs by products” on page 1445 Performance management NOTE Wireless access points in adaptive mode do not display in the Management application. Historical performance enables you to collect data from managed wireless devices. You can use the provided data collectors or create your own data collectors.
17 AP Products report AP Products report The AP Products report displays general and detailed configuration information about AP products that are under the management server. The information on the report comes from the software image version that is in the management application for that product. To ensure that the latest configuration information is in the management application, run the Discovery process or resynchronize the product.
AP Products report 17 The Detailed AP Products report contains the fields and components detailed in Table 77. TABLE 77 Detailed AP Products report Field/Component Description Status Whether the AP is online (green icon), offline (red icon), or pending adoption (gray icon). Name The device name used to identify AP. MAC Address The AP device MAC. Model The model of the AP. Serial Number The serial number of the AP. Firmware version The firmware level of the AP.
17 736 AP Products report Brocade Network Advisor SAN + IP User Manual 53-1003155-01
Chapter 18 VCS Management In this chapter • VCS . . . . . . . . . . . . . . . . . . . . . . . . . . . . . . . . . . . . . . . . . . . . . . . . . . . . . . . . . • Logical chassis cluster operations . . . . . . . . . . . . . . . . . . . . . . . . . . . . . . . . • Serial firmware update and activation for Network OS devices . . . . . . . . . • Support for Network OS VDX 2740 embedded switch . . . . . . . . . . . . . . . . • Network OS . . . . . . . . . . . . . . . . . . . . . . . . . . . . . . . . . . .
18 VCS VCS mode types Beginning with Network OS 4.0, VCS mode encompasses two mode types: • Fabric cluster mode (shown in Figure 285)—The data path for nodes is distributed, but the configuration path is not distributed. Each node maintains its configuration database independently. • Logical chassis cluster mode (shown in Figure 286)—Both the data and configuration paths are distributed. The entire cluster can be configured from the principal node. Logical chassis mode requires Network OS 4.0 or later.
Logical chassis cluster operations 18 Ethernet Fabrics view management The Ethernet Fabrics view displays a map of the traffic for VCS devices on your network. To view the fabric members and Transparent Interconnection of Lots of Links (TRILL) connections for a fabric, double-click the fabric in the Product List. To display the topology map for Ethernet Fabrics, you must have the Main Display - Ethernet Fabric privilege. For more information about privileges, refer to “User Privileges” on page 2151.
18 Logical chassis cluster operations • If the cluster is configured with a virtual IP address after it is discovered by the Management application, the virtual IP address is collected and saved in the database for the next lazy polling or next adaptive collection. • If another switch becomes the principal switch, the Management application sets the cluster IP address to that of the new principal switch at the next lazy polling or next adaptive collection.
Logical chassis cluster operations 18 FIGURE 288 Discover Setup - IP dialog box before removal of node Figure 289 shows the Discover Setup - IP dialog box after the administrator has removed the node with the IP address of 172.26.5.130 from its logical chassis cluster. FIGURE 289 Discover Setup - IP dialog box after disabling the node from logical chassis cluster Figure 290 shows the Discover Setup - IP dialog box after The Management application has performed rediscovery.
18 Serial firmware update and activation for Network OS devices NOTE All cluster-specific configurations are lost during a cluster-mode change. On refresh collection, the Management application detects the mode change and retains all database entries related to the cluster. Serial firmware update and activation for Network OS devices With Network OS release 4.
Support for Network OS VDX 2740 embedded switch 18 Support for Network OS VDX 2740 embedded switch The Network OS VDX 2740 switch is a 10GB VDX, embedded Network OS switch module for IBM Pure System Chassis. The VDX 2740 switch gets discovered by the Management application in the same manner as any other device. Upon discovering this switch, the Management application registers as the Element Manager for the VDX 2740 switch.
18 VCS product groups VCS product groups The standalone Network OS switches and the VCS fabric are treated as a single Layer 2 (L2) switch for both static and dynamic product groups. The product group membership cannot contain fabric members. The standalone Network OS VDX switches are shown in Table 78. TABLE 78 Network OS-supported hardware Device name Firmware level required Network OS VDX 2730 10 Gbps connection blade v2.1.1_fuj Network OS VDX 2740 switch nos4.0.
Port profiles 18 Port profile VLAN profile QoS profile Security profile FIGURE 291 Port profile contents NOTE A port profile does not contain some of the interface-level configurations, such as LLDP, SPAN, LAG, and so on. AMPP characteristics Note the following points regarding the Automatic Migration of Port Profiles (AMPP) feature: • Port groups and port profiles are collections of network policies. The vNICs inherit these network policies. • Port profiles are associated with physical switches.
18 Port profiles • Associated — This state specifies that one or more MAC addresses have been associated with this port profile within the fabric. • Applied — This state indicates that the port profile is applied on the profiled port where the associated MAC address appears. Configuration of two different port profiles can coexist on a profiled port, but the application of the later port profile fails if there is a conflict.
Port profiles 18 Port profile configuration using the Management application You can manage MAC addresses and port profiles from the Port Profiles tab of the Fabric_Name Properties dialog box, as shown in Figure 292. FIGURE 292 Fabric_Name Properties dialog box — Port Profile tab Assigning MAC addresses to a port profile Use the Assign MACs dialog box to select discovered Media Access Control (MAC) addresses and assign them to the selected port profiles.
18 Port profiles FIGURE 293 Assign MACs dialog box 6. From the Source list, select Virtual Machine Managers or Switch Port Connectivity as the source of the discovered MAC address. 7. Select a discovered MAC address to assign to the port profile and click the right arrow button to add it to the Selected MACs list. 8. Click OK. Managing offline MAC addresses To add unique MAC addresses to the Discovered MACs list where you can assign them to a port profile, complete the following steps. 1.
Port profiles 18 FIGURE 294 Assign Offline MACs dialog box 7. To manage offline MAC addresses, perform one of the following tasks: • To assign an offline MAC address to the selected, activated profile, enter the MAC address in the MAC list and click Add. Alternatively, select an offline MAC address from the MAC List and click Add to assign it to the Port Profile list. • To remove a MAC address from the MAC List, select it from the list and click Remove. • To select and import a CSV file, click Import.
18 Port profiles 5. Click Compare. The Profile Comparison Summary dialog box displays, as shown in Figure 295. NOTE A green circle icon in the comparison summary indicates a complete match to the MAC address on the target switch; a yellow triangle icon indicates a partial match. FIGURE 295 Profile Comparison Summary dialog box 6. Select a product from the Available Products with Profiles list and click one of the following match options as the comparison criteria.
Port profiles 18 • Name Match — Compares the original profile with the profile with the same name on the target switch. • Network Match — Finds a profile on the target switch to provide the same networking settings on the target switch. NOTE Select a column or multiple columns in the Comparison Summary list, as shown in Table 80, and click Remove to remove it as matching criteria. The Reference Profile column cannot be removed.
18 Port profiles TABLE 80 Profile Comparison Summary list (Continued) Field/Component Description QoS Settings • • • • • • • • ACL Settings FCoE Settings NOTE: FCoE sub-profiles can be applied on default port profiles only and are supported on Network OS version 2.1 and later. You can view the FCoE profile association on Network Advisor version 11.3.0 and later. • • • • • • • • • • • • Mode — The mode of Quality of Service (QoS) assigned to the port Flow Control — Non-DCB mode.
System Monitor support on Network OS VDX platforms 18 FIGURE 296 Deploy Port Profiles to Products dialog box 5. Select an available target from the Available Targets list and click the right arrow button to move the target selected for configuration deployment to the Selected Targets list. NOTE If a fabric is selected and moved in a VCS fabric, all members are moved to the Selected Targets list. Individual members of a VCS fabric can be added and removed from the Selected Targets list. 6. Click OK.
18 System Monitor support on Network OS VDX platforms • • • • • • • • • Fan — Configures fan settings Power — Configures power settings Temp — Displays the threshold for the temperature sensor component CID-card — Displays the threshold for the CID card component SFP — Displays the threshold for the small form factor pluggable (SFP) device compact-flash — Displays the threshold for the compact flash device MM — Displays the threshold for the management module LineCard — Displays the threshold for the lin
System Monitor support on Network OS VDX platforms 18 • Limit — Specifies the default CPU limit. When the limit is exceeded, System Monitor sends out a RASlog WARNING message. When usage returns below the limit, System Monitor sends a RASlog INFO message. Valid values range from 0 to 80 percent, and the default value is different for different systems. • Low_limit — Specifies a lower usage limit for memory as a percentage of available memory.
18 Ethernet fabric traceroute Interface error types Table 82 describes the interface counters that System Monitor monitors on external interfaces. TABLE 82 Interface errors monitored by System Monitor Interface error Description Port Fence support Threshold defaults CRC Align Errors The total number of frames received that had a length (excluding framing bits but including Frame Check Sequence (FCS) octets) of from 64 through 1518 octets.
Ethernet fabric traceroute 18 • Right-click the VM and select Diagnostics > Traceroute. • Right-click the VCS and select Diagnostics > Traceroute. The Traceroute dialog box displays (see Figure 297). The Source field displays the corresponding VM MAC addresses by default and the Destination field is blank. If you do not have the privilege to lauch traceroute, the following warning message displays: You do not have privilege to perform this operation. Click OK to close the warning message.
18 Ethernet fabric traceroute FIGURE 298 Select Source - Traceroute dialog box In the Select Source - Traceroute dialog box, you can either search from the Available MAC Addresses list or select a row containing the required source MAC address, VM name, or IP address and click OK. This list contains all the discovered port MAC addresses (host or device) connected to the VCS cluster. The format of the selected source address is displayed based on the conditions in the following table.
Ethernet fabric traceroute 18 4. Choose one of the following options: • Assign appropriate RBridge ID — Select this option to use Address Finder to identify the RBridge ID of the source. The Management application finds the RBridge ID on which the MAC address is learned. • Select RBridge ID — Select this option to select an RBridge ID from the list of the RBridge IDs currently present in the cluster.
18 Ethernet fabric traceroute TABLE 83 Trace Route example Request Source port number Destination port number 1 5 7 2 10 12 3 15 17 4 20 22 5 25 27 14. Click Start to initiate the traceroute request. Click Stop to cancel the traceroute request. NOTE The traceroute request is not automatically cancelled on the switch. The switch continues until the request is complete.
Ethernet fabric traceroute 18 • Status: Whether the traceroute succeeded or failed. NOTE A failed status indicates that the destination is not reachable from the outgoing port of this RBridge after the switch initiates the traceroute command. 16. To review the average round trip delay for the RBridge across the requests, click the Average Round Trip Delay tab.
18 762 Ethernet fabric traceroute Brocade Network Advisor SAN + IP User Manual 53-1003155-01
Chapter 19 Host Management In this chapter • Host management. . . . . . . . . . . . . . . . . . . . . . . . . . . . . . . . . . . . . . . . . . . . . • Supported adapters . . . . . . . . . . . . . . . . . . . . . . . . . . . . . . . . . . . . . . . . . . . • HCM software . . . . . . . . . . . . . . . . . . . . . . . . . . . . . . . . . . . . . . . . . . . . . . . . • Host adapter discovery . . . . . . . . . . . . . . . . . . . . . . . . . . . . . . . . . . . . . . . . . • VM Manager. . . . . . . . . . .
19 Supported adapters The Management application, in conjunction with HCM, provides end-to-end management capability. For information about configuring, monitoring, and managing individual adapters using the HCM GUI or the Brocade Command Utility (BCU), refer to the Adapters Administrator’s Guide.
Supported adapters 19 Converged Network Adapters Table 85 describes available Converged Network Adapters (CNAs) for PCIe x 8 host bus interfaces, hereafter referred to as CNAs. These adapters provide reliable, high-performance host connectivity for mission-critical SAN environments.
19 HCM software • HBA or Fibre Channel mode — This mode utilizes the Brocade Fibre Channel storage driver. An 8 or 16 Gbps Fibre Channel SFP transceiver can be installed for the port. The port provides Host Bus Adapter (HBA) functions on a single port so that you can connect your host system to devices on the Fibre Channel SAN. Ports with 8 Gbps SFP transceivers configured in HBA mode can operate at 2, 4, or 8 Gbps.
Host adapter discovery 19 HCM features Common HBA and CNA management software features include the following: • Discovery using the agent software running on the servers attached to the SAN, which enables you to contact the devices in your SAN. • Configuration management, which enables you to configure local and remote systems.
19 VM Manager NOTE Pure Fabric discovery alone shows adapters behind Access Gateway and all adapter ports as virtual. When you discover an adapter and ports using host discovery, the adapter and all its ports are shown as physical. Instructions for discovering hosts are detailed in Chapter 3, “Discovery”. VM Manager A vCenter server can be discovered by adding a VM Manager to the Management application. Refer to Chapter 3, “Discovery” for information about discovering VM Managers.
HCM and Management application support on ESXi systems 19 1. Click Edit on the Discover VM Managers dialog box. The Edit VM Manager dialog box displays. 2. Enter the VMM server port number into the Port field. The valid port number range is from 0 through 65536. 3. Enter the user ID into the User ID field to identify the user of the VMM. The maximum number of supported characters is 64. 4. Enter the password into the Password field. The maximum number of supported characters is 64. 5.
19 HCM and Management application support on ESXi systems Adding host adapter credentials for ESXi CIM-based discovery is available for ESXi versions 4.1 and later. The CIM server transport does not support operating systems other than ESXi. NOTE CIM server credentials are optional. If you do not provide credentials, basic authentication on the CIM server is disabled and the Management application attempts discovery without authentication.
Connectivity map 19 3. Select CIM server (ESXi only) as the Contact option. 4. (Optional) Select HTTP or HTTPS from the Protocol list. HTTPS is the default. 5. Click OK. Connectivity map The Connectivity Map, which displays in the upper right area of the main window, is a grouped map that shows physical and logical connectivity of Fabric OS components, including discovered and monitored devices and connections. These components display as icons in the Connectivity Map.
19 Adapter software If you create a new host and associate HBAs to it, and then you try to discover a host with the same HBAs using Host discovery, the HBAs discovered using host discovery must match the HBAs associated to the host exactly; otherwise, host discovery will fail. Instructions for mapping a host to HBAs are detailed in Chapter 15, “Host Port Mapping”.
Adapter software 19 • Name — The name of the host. The first three digits indicate the host’s operating system; for example, WIN or LIN. • Operating System — The host operating system; for example, Microsoft Windows or Red Hat Linux. • Driver Version — The host’s current driver version. • Architecture — The host’s architecture; for example, 32-bit or 64-bit. 3. Select one or more hosts from the Selected Hosts list.
19 Adapter software FIGURE 303 Driver Repository dialog box 2. Click Import on the Driver Repository dialog box. The Import Driver Repository dialog box displays. 3. Locate the driver file using one of the following methods: • Search for the file you want from the Look In list. • Enter the name of the image file you want to import in the File Name field. 4. Click Open. After the import completes, you see a message that the driver imported successfully. 5. Click OK.
Adapter software 19 Importing a boot image into the repository Boot images are required for adapters that are shipped without a boot image or when it is necessary to overwrite images on adapters that contain older or corrupted boot image versions. 1. From the Management application menu bar, select Configure > Host > Adapter Software. 2. Click the Boot Image tab. The Boot Image Management dialog box, shown in Figure 304, displays. FIGURE 304 Boot Image Management dialog box 3.
19 Adapter software 6. Locate the boot image file using one of the following methods: • Search for the file you want from the Look In list. Boot image files version 2.0.0.0 and 2.1.0.0 are .zip files and other boot image files are .tar files. • Enter the name of the image file you want to import in the File Name field. 7. Click Open. After the import completes, you see a message that the boot image imported successfully.
Bulk port configuration 19 The boot image is removed from the boot image repository. Backing up boot image files You can back up the boot image files from the repository using the Options dialog box. Refer to “Backup support” on page 791 for instructions. Bulk port configuration Use the Adapter Host Port Configuration dialog box to create and assign port-level configurations to either a single or multiple adapter ports at a time. You can save up to 50 port-level configurations.
19 Bulk port configuration FIGURE 306 Configure Host Adapter Ports dialog box Adding a port configuration The Add Port Configuration dialog box allows you to create a maximum of 50 customized port configurations which you can then select and assign to ports. 1. Click Add on the Configure Host Adapter Ports dialog box. The Add Port Configuration dialog box, shown in Figure 307, displays.
Bulk port configuration 19 FIGURE 307 Add Port Configuration dialog box 2. Enter a name for the port configuration in the Configuration Name field. A maximum of 128 alphanumeric characters is supported. 3. Configure at least one of the following port properties: - Port — Enable or disable the port. Enable is the default. - Target Rate Limiting — Enable the Target Rate Limiting feature to minimize congestion at the adapter port.
19 Bulk port configuration Boot Speed — Set the port speed. Possible values are Auto Negotiate (to auto-negotiate the speed) and 1, 2, 4, 8, and 16 Gbps and unknown speeds. Boot Option — From the list, select one of the following: • Auto Discovered From Fabric — Enables Boot over SAN using boot LUN information stored in the fabric. This is the default setting. • First Visible LUN — Enables Boot over SAN from the first discovered LUN in the SAN. Bootup Delay — Enter a bootup delay value.
Adapter port WWN virtualization 19 Editing a port configuration The Edit Port Configuration dialog box allows you to modify port configuration parameters that were configured using the Add Port Configuration dialog box. 1. Click Edit on the Configure Host Adapter Ports dialog box. The Edit Port Configuration dialog box displays. 2. Modify the parameters that are described in “Adding a port configuration” on page 778. 3. Click OK to save the changes. Duplicating a port configuration 1.
19 Adapter port WWN virtualization • Set the type value to auto or user-defined. When the User button is clicked, the WWN is cleared from the table and editing is enabled. • Delete the Fabric Assigned WWN from the Fabric Assigned WWN - Configuration list. FIGURE 308 Configure Fabric Assigned WWNs dialog box Enabling the FAWWN feature on a switch or AG ports 1. Select Configure > Fabric Assigned WWN. or Right-click the switch and select Fabric Assigned WWN.
Adapter port WWN virtualization 19 The Configure Fabric Assigned WWNs dialog box displays. 2. Select a switch port from the Fabric Assigned WWN - Configuration list. 3. Click the Disable button. The selected switch’s FAWWN feature status is disabled. 4. Click OK. Auto-assigning a FAWWN to a switch or AG port 1. Select Configure > Fabric Assigned WWN. or Right-click the switch and select Fabric Assigned WWN. The Configure Fabric Assigned WWNs dialog box displays. 2.
19 Adapter port WWN virtualization Deleting a FAWWN from a switch or AG port 1. Select Configure > Fabric Assigned WWN. or Right-click the switch and select Fabric Assigned WWN. The Configure Fabric Assigned WWNs dialog box displays. 2. Select a switch port or AG port from the Fabric Assigned WWN - Configuration list. 3. Click the Delete button. The Fabric Assigned WWN row is deleted from the Fabric Assigned WWN - Configuration list for the selected switch port or AG port.
Adapter port WWN virtualization 19 Adding AG port FAWWNs 1. Select Configure > Fabric Assigned WWN. or Right-click the switch and select Fabric Assigned WWN. The Configure Fabric Assigned WWNs dialog box displays. 2. Click the Attached AG Ports tab. 3. Select a row in the Fabric Assigned WWN Configuration - AG Ports list. 4. Click Add. The Add AG Fabric Assigned WWN Configuration dialog box displays. 5. Enter a valid world wide name (WWN), with or without colons, for the Access Gateway node.
19 Role-based access control The Configure Fabric Assigned WWNs dialog box displays. 2. Click the Attached AG Ports tab. 3. Right-click the WWN row you want to move, select the Copy Row option, and paste the contents into a text editor. 4. Select an online AG FAWWN row and click the Delete button. 5. Select a switch from the Switch list and click Add to launch the Add AG Fabric Assigned WWN Configuration dialog box. 6.
Host performance management 19 • Port Mapping • Virtual Network Management Instructions for managing resource groups and users using roles and privileges are detailed in “User accounts,”“Roles,” and “Areas of responsibility,” in Chapter 6, “User Account Management”. Host performance management Real-time performance enables you to collect data from managed HBA and CNA ports. You can use real-time performance to configure the following options: • Select the polling rate from 20 seconds up to 1 minute.
19 Host security authentication TABLE 87 Counters (Continued) FC port measures HBA port measures CNA port measures Invalid ordered sets Non-frame coding error Received paused frames Transmitted paused frames Received FCoE pause frames Transmitted FCoE pause frames Received FCS error frames Transmitted FCS error frames Received alignment error frames Received length error frames Received code error frames Instructions for generating real-time performance data are detailed in “Generating a real-time p
Host security authentication 19 FIGURE 310 Fibre Channel Security Protocol Configuration dialog box 3. Configure the following parameters on the Fibre Channel Security Protocol Configuration dialog box: a. Select the Enable Authentication check box to enable the authentication policy. If authentication is enabled, the port attempts to negotiate with the switch. If the switch does not participate in the authentication process, the port skips the authentication process. b.
19 supportSave on adapters supportSave on adapters Host management features support capturing support information for managed Brocade adapters, which are discovered in the Management application. You can trigger supportSave for multiple adapters at the same time. supportSave cannot be used to collect support information for ESXi hosts managed by a CIM Server. Refer to the Brocade Adapters Administrator’s Guide for information about supportSave on ESXi hosts.
Backup support 19 Filtering event notifications The Management application provides notification of many different types of SAN events. If a user wants to receive notification of certain events, you can filter the events specifically for that user. NOTE The e-mail filter in the Management application is overridden by the firmware e-mail filter.
19 Backup support 1. Select Server > Options. The Options dialog box displays. 2. Select Server Backup in the Category list. The currently defined directory displays in the Output Directory field. 3. Select the Enable Backup check box, if necessary. 4. Choose one or more of the following options: • Select the Include Adapter Boot Image check box to back up boot image files from the boot image repository. • Select the Include FTP Root directory check box.
Backup support 19 3. Clear the Enable Backup check box. 4. Click Apply or OK.
19 794 Backup support Brocade Network Advisor SAN + IP User Manual 53-1003155-01
Chapter 20 Fibre Channel over Ethernet In this chapter • FCoE overview . . . . . . . . . . . . . . . . . . . . . . . . . . . . . . . . . . . . . . . . . . . . . . . . • Enhanced Ethernet features. . . . . . . . . . . . . . . . . . . . . . . . . . . . . . . . . . . . . • FCoE protocols supported. . . . . . . . . . . . . . . . . . . . . . . . . . . . . . . . . . . . . . . • FCoE licensing . . . . . . . . . . . . . . . . . . . . . . . . . . . . . . . . . . . . . . . . . . . . . . . .
20 Enhanced Ethernet features DCBX protocol Data Center Bridging Exchange (DCBX) protocol allows enhanced Ethernet devices to convey and configure their DCB capabilities and ensures a consistent configuration across the network. DCBX protocol is used between DCB devices, such as a converged network adapter (CNA) and an FCoE switch, to exchange configuration with directly connected peers.
FCoE protocols supported 20 Ethernet jumbo frames The basic assumption underlying FCoE is that TCP/IP is not required in a local data center network and the necessary functions can be provided with Enhanced Ethernet. The purpose of an “enhanced” Ethernet is to provide reliable, lossless transport for the encapsulated Fibre Channel traffic. Enhanced Ethernet provides support for jumbo Ethernet frames and in-order frame delivery.
20 FCoE licensing FCoE licensing The FCoE license enables Fibre Channel over Ethernet (FCoE) functionality on the following supported DCB switches: • • • • • Network OS 10 GbE 24-port 8 GbE 8 FC port switch Network OS VDX 6710, 6720, and 6730 switches Network OS VDX 6740 and 6740T switches Network OS VDX 8770-series switches Network OS VDX 2730 10 GbE connection blade for the Fujitsu PRIMERGY BX900 and BX400 Blade Servers Without the FCoE license, the DCB switches are pure Layer 2 Ethernet switches and
Saving running configurations 20 FIGURE 311 Save Running to Startup dialog box 2. Highlight a discovered DCB switch from the Available Switches list, and click the right arrow button to move the switch to the Selected Switches list. 3. Highlight the selected switch and click OK to start the configuration. The running configuration is saved to the selected switch, effective on the next system startup.
20 DCB configuration management DCB configuration management Depending on the platform, the DCB switch has one of the configurations shown in Table 88.
Switch policies 20 Switch policies You can configure and enable a number of DCB policies on a switch, port, or link aggregation group (LAG). The following switch policy configurations apply to all ports in a LAG: • DCB map and Traffic Class map • Link Layer Discovery Protocol (LLDP) The switch policies are described in the following sections.
20 DCB configuration DCB configuration To launch the DCB Configuration dialog box, select Configure > DCB from the menu bar. The DCB Configuration dialog box displays, showing the status of all DCB-related hardware and functions. NOTE For FOS DCB devices, the Protocol Down Reason column, shown in Figure 312, displays the values only for the external ports of embedded platforms but not for the internal ports.
DCB configuration 20 In release 12.1 of the Management application, you cannot perform DCB configuration on Network OS VDX switches. You can only view Network OS switch configuration in the Management application DCB dialog. Refer to “Network OS switches in VCS mode” on page 839 for more information. NOTE Editable operations from the Management application on Network OS products are not supported for this release.
20 DCB configuration FIGURE 313 Edit Switch dialog box - QoS tab 4. Select DCB from the Map Type list. 5. Configure the following DCB Map parameters in the DCB Map area: • Name - Enter a name to identify the DCB map. • Precedence - Enter a value from 1 through 100. This number determines the map’s priority. • Priority Flow Control check box - Check to enable priority-based flow control on individual priority groups.
DCB configuration 20 If a DCB map exists with the same name, a validation dialog box launches and you are asked if you want to overwrite the map. 7. Click OK. 8. When you have finished the configuration, click OK to launch the Deploy to Products dialog box. Configuring LLDP To configure LLDP, complete the following steps. 1. Select Configure > DCB. The DCB Configuration dialog box displays. 2. Select the switch to edit from the Product/Ports list and click Edit. The Edit Switch dialog box displays. 3.
20 DCB configuration 8. Click Start on the Deployment Status dialog box to save the changes to the switch. 9. Click Close to close the Deployment Status dialog box. Configuring the DCB interface with the DCB map and global LLDP profile To configure the DCB interface, complete the following steps. 1. Select Configure > DCB. The DCB Configuration dialog box displays. 2. Select the Te port connected to the CNA from the Product/Ports list and click Edit..
DCB configuration 20 3. Click the DCB tab. 4. Click the VLAN tab. 5. Click Add. The VLAN Configuration dialog box displays. 6. Enter the VLAN identifier in the VLAN ID field. 7. Click OK on the VLAN Configuration dialog box. 8. Select the VLAN you created and click Edit to convert the VLAN to FCoE VLAN. 9. Select the FCoE check box. 10. Select the DCB interface to carry the FCoE traffic from the Selection List and click Add to add it to the Selected List. 11.
20 DCB configuration • The Add LAG button on the DCB Configuration dialog box is enabled when a single DCB switch or ports of a single DCB switch are selected. • The Add LAG button is disabled when multiple switches are selected, ports from different switches are selected, or LAGs are selected. • The Edit LAG button is enabled when a single LAG, port, or switch is selected. Creating a LAG is not supported for Network OS products.
DCB configuration 20 • LAG ID - Enter the LAG identifier, using a value from 1 through 63. Duplicate LAG IDs are not allowed. • Status - Click the Enable check box to enable the LAG. You must enable the LAG to use the DCB functionality. • Interface Mode - Select None or L2. Ports that are in L2 mode cannot be added to a LAG. The L3 interface mode option is displayed in the Edit LAG dialog box only. • L2 Mode - Select Access or Trunk: Access mode allows only one VLAN and allows only untagged frames.
20 DCB configuration Editing a DCB switch 1. Select Configure > DCB. The DCB Configuration dialog box displays, showing the status of all DCB-related hardware and functions. 2. Select the DCB switch from the Products/Ports list. 3. Click Edit. The Edit Switch dialog box displays (Figure 316). FIGURE 316 Edit Switch dialog box 4.
DCB configuration 20 8. Click Start on the Deployment Status dialog box to save the changes to the selected devices. 9. Click Close to close the Deployment Status dialog box. Editing a DCB port 1. Select Configure > DCB. The DCB Configuration dialog box displays, showing the status of all DCB-related hardware and functions. 2. Select a DCB port from the Products/Ports list. 3. Click Edit. The Edit Port dialog box displays, as shown in Figure 317. FIGURE 317 Edit Port dialog box 4.
20 DCB configuration • IP/Netmask - The netmask is used to divide an IP address into subnets. It specifies which portion of the IP address represents the network and which portion represents the host, and can only be configured if the interface mode is L3. 812 Primary - The primary IP address assigned to a 10 Gbps DCB/FC switch module. Secondary - The secondary IP address is optional. Secondary IP addresses are helpful when the interface port is part of multiple subnets.
DCB configuration 20 5. When you have finished configuring the policies, apply the settings to the DCB port. NOTE Clicking Cancel when there are pending changes launches a pop-up dialog box. 6. Click OK when you have finished modifying the DCB port parameters. The Deploy to Ports dialog box displays. 7. Click OK after changing the attributes of the current deployment. The Deployment Status dialog box launches. 8.
20 DCB configuration FIGURE 318 Edit LAG dialog box 4. Configure the following LAG parameters, as required: NOTE Ports with 802.1x authentication or ports that are enabled in L2 mode or L3 mode are not supported in a LAG. • LAG ID - The LAG identifier, which is not an editable field. • Status - Click the Enable check box to enable the LAG. You must enable the LAG to use the DCB functionality. • Interface Mode - Select None or L2.
DCB configuration 20 5. Continue to configure the following LAG parameters. These parameters are disabled until you add a DCB port to the LAG Members list. • Mode - The ports that are LAG members are in either Static or Dynamic mode. You cannot change the mode on existing members of a LAG. If the mode is set as Dynamic, you can change the dynamic mode type (to Active or Passive) only for newly-added ports, not for existing port members of a LAG.
20 QoS configuration 4. Click Start on the Confirmation and Status dialog box to save the changes to the selected ports or LAGs. The selected DCB ports or LAGs are enabled in the DCB Configuration dialog box. 5. Click Close to close the Confirmation and Status dialog box. Deleting a LAG You can only delete a link aggregation group (LAG) that is selected from a single switch. If you select multiple switches or multiple ports from two or more switches, the Delete button is disabled.
QoS configuration TABLE 89 20 Priority grouping allocated in a 15-priority group example Priority group ID Bandwidth (%) Priority flow control 0 55 on 1 25 on 2 0 off 3 0 off 4 5 off 5 0 off 6 15 on 7 0 off 15.0-15.7 Strict priority on No bandwidth % configuration allowed Creating a DCB map The procedure in this section applies only for Fabric OS versions earlier than Fabric OS 7.0.
20 QoS configuration FIGURE 319 QoS, Create DCB Map dialog box 4. Select DCB from the Map Type list. 5. Configure the following DCB map parameters in the DCB Map area: • Name - Enter a name to identify the DCB map. NOTE Only one DCB map (the default) is supported on Fabric OS version 6.3.1_dcb and version 7.0.0 and later. • Precedence - Enter a value from 1 through 100. This number determines the map’s priority.
QoS configuration 20 • If you set a CoS value to one or more of the PG IDs 0-7, you must also enter a non-zero bandwidth percentage. The total bandwidth percentage must equal 100. • For PG IDs 0-7 that do not have an assigned CoS value or PFC enabled, the bandwidth percentage must be 0. 6. Click the right arrow button to add the map to the DCB Maps list. If a DCB map exists with the same name, a validation dialog box launches and you are asked if you want to overwrite the map. 7. Click OK. 8.
20 QoS configuration 1. Select Configure > DCB. The DCB Configuration dialog box displays, showing the status of all DCB-related hardware and functions. 2. Select a switch, and click Edit. 3. Click the QoS tab on the Edit Switch dialog box. The QoS dialog box displays. 4. Select one or more DCB maps. 5. Click the left arrow button. The selected DCB map row is removed from the list. 6. When you have finished the configuration, click OK to launch the Deploy to Products dialog box.
QoS configuration 20 If no DCB maps were created on the switch, the Available DCB Maps list is empty. Otherwise, the following DCB map details display: • PG - ID — Lists the priority group ID (15.0 through 15.7 and 0 through 7). • % Bandwidth — Lists the bandwidth value for priority group IDs 0-7. The total of all priority groups must equal 100 percent. • Priority Flow checkbox — Check to enable priority-based flow control on individual priority groups.
20 QoS configuration If the name of the Traffic Class map already exists, an overwrite warning message displays. Click Yes to overwrite the existing Traffic Class map. 5. Keep the same Traffic Class map name and modify the values, as required. 6. Click the right arrow button to re-add the map to the Traffic Class Maps list. 7. When you have finished the configuration, click OK to launch the Deploy to Products dialog box. Deleting a Traffic Class map 1. Select Configure > DCB.
FCoE provisioning 20 5. Select Traffic Class in the Map Type list. 6. Select a Traffic Class map in the Traffic Class Map list. 7. When you have finished the configuration, click OK to launch the Deploy to Ports/LAGs dialog box. Refer to “Switch, port, and LAG deployment” on page 835 for more information. FCoE provisioning The Management application supports FCoE provisioning only on Fabric OS version 6.3.1_dcb.
20 FCoE provisioning • Name — The name of the FCoE map that will be available for assignment to ports on this switch. This is a read-only field. • VLAN ID — Enter an FCoE VLAN identifier to associate with the FCoE map. The values range from 2 through 3583, and 1002 is the default. • DCB Map — The DCB map that is associated with the FCoE map. This is a read-only field. 4. Accept the default VLAN ID of 1002, or change the value. The valid VLAN ID range is from 2 through 3583. 5.
VLAN classifier configuration 20 5. When you have finished the configuration, click OK to launch the Deploy to Ports dialog box. 6. Click OK after changing the attributes of the current deployment. The Deployment Status dialog box displays. 7. Click Start on the Deployment Status dialog box to save the changes to the selected devices. VLAN classifier configuration The Management application supports VLAN classifier management only on Fabric OS 6.3.1_dcb and Fabric OS 7.0.0.
20 VLAN classifier configuration FIGURE 320 Edit Switch dialog box, VLAN Classifiers tab 4. Click the Add button under the Available Rules list. The Add Rules dialog box displays, as shown in Figure 321. FIGURE 321 Add Rules dialog box The Rule ID field is pre-populated with the next available rule ID number. 5. Keep the rule ID number as it is, or change the number using a value from 1 through 256. 6. Select a rule type. Valid rule types are MAC (MAC address-based rule) and Proto (802.
VLAN classifier configuration 20 9. Click OK to add the rule to the Available Rules list on the VLAN Classifiers tab of the Edit Switch dialog box and close the Add Rules dialog box. NOTE Clicking Apply also adds the rule to the Available Rules list on the VLAN Classifiers tab of the Edit Switch dialog box, and in addition, the Add Rules dialog box remains open and clears all entries for you to define the next rule. 10.
20 VLAN classifier configuration Creating a VLAN classifier group You can assign existing rules to a selected VLAN classifier and form a VLAN classifier group. If no rules are available, you can add rules to a selected switch using the Add Rules dialog box. 1. Select Configure > DCB from the menu bar. The DCB Configuration dialog box displays, showing the status of all DCB-related hardware and functions. 2. Select a switch and click Edit. 3. Click the VLAN Classifiers tab on the Edit Switch dialog box.
LLDP-DCBX configuration 20 LLDP-DCBX configuration Link Layer Discovery Protocol (LLDP) provides a solution for the configuration issues caused by increasing numbers and types of network devices in a LAN environment, because, with LLDP, you can statically monitor and configure each device on a network.
20 LLDP-DCBX configuration Adding an LLDP profile NOTE When a TE port is selected to assign to an LLDP profile, a yellow banner displays with the following error message: “LLDP-DCBX is disabled on this switch. The configuration becomes functional when LLDP-DCBX is enabled on the switch.” 1. Select Configure > DCB. The DCB Configuration dialog box displays, showing the status of all DCB-related hardware and functions. 2. Select a switch, and click Edit. 3.
LLDP-DCBX configuration 20 Editing an LLDP profile 1. Select Configure > DCB. The DCB Configuration dialog box displays, showing the status of all DCB-related hardware and functions. 2. Select a switch, and click Edit. 3. Click the LLDP-DCBX tab on the Edit Switch dialog box. The LLDP-DCBX Profile dialog box displays. 4. Select an LLDP profile in the LLDP Profile list. NOTE You can edit the profile. You cannot, however, delete or duplicate global configurations. 5.
20 802.1x authentication Assigning an LLDP profile to a port or ports in a LAG You create LLDP profiles using the Edit Switch dialog box, which you access from the DCB Configuration dialog box. Global configuration parameters, which is the default selection, are displayed in the Assigned Profile table. NOTE A yellow banner displayed on the LLDP-DCBX dialog box indicates that LLDP-DCBX is disabled on the switch. The configuration options become functional when LLDP-DCBX is enabled on the switch. 1.
802.1x authentication 20 Enabling 802.1x authentication 802.1x authentication is enabled or disabled globally on the switch using the Edit Switch dialog box. 1. Select Configure > DCB from the menu bar. The DCB Configuration dialog box displays, showing the status of all DCB-related hardware and functions. 2. Select a switch and click Edit. 3. Click the 802.1x tab on the Edit Switch dialog box. 4. Click the Enable 802.1x check box to enable 802.1x authentication, and click OK. 5. Configure the 802.
20 802.1x authentication FIGURE 323 802.1x dialog box 5. Configure the following 802.1x parameters: • Wait Period - The number of seconds the switch waits before sending an EAP request. The value range is 15 to 65535 seconds. The default value is 30. • Retry Count - The maximum number of times that the switch restarts the authentication process before setting the switch to an unauthorized state. The value range is 1 to 10. The default value is 2.
Switch, port, and LAG deployment 20 6. When you have finished the configuration, click OK to launch the Deploy to Ports dialog box. Refer to “Switch, port, and LAG deployment” on page 835 for more information. Switch, port, and LAG deployment The Deploy to Products, Deploy to Ports, and Deploy to LAGs dialog boxes provide the flexibility to commit DCB configurations either right away or at a scheduled time.
20 Switch, port, and LAG deployment FIGURE 325 Deploy to Ports dialog box FIGURE 326 Deploy to LAGs dialog box 836 Brocade Network Advisor SAN + IP User Manual 53-1003155-01
Switch, port, and LAG deployment 20 4. Click one of the following deployment options: • • • • Deploy now Save and deploy now Save deployment only Schedule 5. Click one of the following save configuration options: • Save to running • Save to running and startup • Save to running and startup then reboot The name for the scheduled product deployment is pre-populated with a “DCB-MM-DD-YYYY-HR-MIN-SS” prefix. This is an editable field. 6. Provide a description for the product/port/LAG deployment. 7.
20 Switch, port, and LAG deployment NOTE On the Deploy to Ports dialog box, you can write port configurations to the switch by enabling the check box at the bottom of the dialog box. For LAGs: • LAG attributes (Interface Mode, etc.) • QoS, DCB Map / Traffic Class Map • LLDP Profiles 9. Click to move the available targets selected for configuration deployment to the Selected Targets list. 10. Click OK. The Deployment Status dialog box launches. 11.
Network OS switches in VCS mode TABLE 90 20 Source to target switch Fabric OS version compatibility (Continued) Source Fabric OS version and device Target Fabric OS version supported Comments Fabric OS Converged 10 GbE switch module for IBM BladeCenter with Fabric OS 6.3.1_cee and 6.3.1_dcb Allows Fabric OS Converged 10 Gbe switch module for IBM BladeCenter with Fabric OS 6.3.1_cee, Fabric OS 6.3.1_dcb. Both source and target switches must support the FCoE map and VLAN classifiers.
20 Network OS switches in VCS mode Supported VCS platforms The following switches are supported in a virtual fabric switching environment: • VDX 2730 10 GbE connection blade for the Fujitsu PRIMERGY BX900 and BX400 Blade Servers • • • • • • • • • VDX 6710 VDX 6720-24 VDX 6720-60 VDX 6730-32 VDX 6730-76 VDX 6740 VDX 6740T VDX 8770-4 VDX 8770-8 Viewing switches in VCS mode 1. Launch the DCB Configuration dialog box using one of the following methods: • Select Configure > DCB from the menu bar.
Network OS switches in VCS mode 20 Viewing QoS parameters on the Network OS switch Table 91 describes the parameters that displays on the View Switch dialog box - QoS tab. NOTE Network OS switches in VCS mode support only the DCB map. Network OS switches in standalone mode supports both the DCB and Traffic Class maps. TABLE 91 QoS configuration parameters on VCS switch Map Type Displays the map type: DCB or Traffic Class for a Standalone Network OS switch or DCB for Network OS switches in VCS mode.
20 Network OS switches in VCS mode Viewing VLAN classifiers and rules parameters on the Network OS switch Table 93 describes the parameters that display on the View Switch dialog box - VLAN Classifiers tab. TABLE 93 VLAN classifiers and rules configuration parameters on VCS switch Field/Component Available Rules VLAN Classifiers Description Displays the following Available Rules information: Rule ID — The rule identifier. Valid rule ID values are from 1 through 256.
Network OS switches in VCS mode 20 Viewing the 802.1x parameter on the Network OS switch Table 95 describes the parameter that displays on the View Switch dialog box - QoS tab. TABLE 95 802.1x configuration parameter on VCS switch Field/Component Description 802.1x Displays the enabled or disabled status of the 802.1x configuration on the Network OS switch. Viewing ports in VCS mode 1.
20 Network OS switches in VCS mode TABLE 96 Port parameters on the Network OS switch port (Continued) Field/Component Description MTU The maximum transmission unit (MTU) in bytes. The value range is from 1522 through 9216 and the default value is 2500. iSCSI Priority The CoS priority value for iSCSI traffic. The value range is from COS 0 through COS 7 and the default value is COS 4.
Network OS switches in VCS mode 20 QoS - Non-DCB TABLE 98 QoS (non-DCB) parameters on the Network OS switch port Field/Component Description Mode The mode of Quality of Service (QoS) assigned to the port (non-DCB). Trust Indicates whether the Ethernet trust of the port is enabled or disabled. NOTE: Applicable only for standalone Network OS devices. Flow Control The Ethernet priority flow control mode of the port. The default flow control mode is Off. Possible modes are as follows: • Off • 802.
20 Network OS switches in VCS mode Viewing LLDP-DCBX parameters on the Network OS switch port Table 100 describes the LLDP profiles table (in global configuration) and the LLDP profiles. TABLE 100 LLDP-DCBX parameters on the Network OS switch port Field/Component Description LLDP-DCBX Indicates whether LLDP-DCBX feature is enabled or disabled. LLDP Profile Parameters Displays the following LLDP profile parameters: Name — The name of the LLDP profile.
Network OS switches in VCS mode TABLE 101 20 802.1x parameter on the Network OS switch port (Continued) Field/Component Description Re-authentication Interval (sec) The number of seconds between re-authentication attempts. The value range is 1 to 4294967295. The default value is 3600 seconds. This feature is not dependent on the re-authentication state being enabled. Port Control The authorization mode to configure the ports for authorization.
20 Network OS switches in VCS mode TABLE 102 LAG parameters on the Network OS switch LAG (Continued) Field/Component Description Status Indicates whether the LAG is enabled or disabled. You must enable the LAG to use the DCB functionality. Default CoS The Cost of Service (CoS) value for incoming untagged frames. Values are 0-7 or if the port is profiled. The default CoS is 0. Type Displays the limit on the size of the LAG.
Network OS switches in VCS mode TABLE 103 20 QoS (DCB) parameters on the Network OS switch LAG. (Continued) Field/Component Description Precedence This number determines the map’s priority. Valid values are from 1 through 100. DCB Map Parameters • • • • PG ID — Lists the priority group ID (15.0 to 15.7 and 0 to 7). % Bandwidth — Lists the bandwidth value for priority group IDs 0-7. The total of all priority groups must equal 100%.
20 Network OS switches in VCS mode TABLE 105 FCoE configuration parameters on VCS switch Field/Component FCoE Map Note: The default FCoE map contains both the default Fabric map and the default DCB map. Fabric Map Description Displays the following information about the FCoE map: Fabric Map — The name of the Fabric map. The default Fabric map consists of virtual fabric and FCoE VLAN-related information. • DCB Map — The name of the DCB map.
DCB performance 20 DCB performance Performance monitoring provides details about the quantity of traffic and errors a specific port or device generates on the fabric over a specific time frame. You can also use Performance features to indicate the devices that create the most traffic and to identify the ports that are most congested. The Performance menu items launch either SAN or IP performance dialog boxes based on which tab you select.
20 DCB performance Generating a real-time performance graph from the IP tab To generate a real-time performance graph for a Network OS or FOS DCB switch, complete the following steps. 1. Click the IP tab. 2. Select a DCB port from the DCB Configuration dialog box, and select Real Time Graph from the Performance list. A message displays, prompting you to close the DCB Configuration dialog box. 3. Click OK to close the DCB Configuration dialog and open the Performance dialog box.
DCB performance 20 Historical performance graph The Historical Performance Graph dialog box enables you to customize how you want the historical performance information to display. Generating a historical performance graph You can generate a historical performance graph by selecting both Network OS and FOS DCB devices from the IP Tab or by selecting only Network OS DCB devices from the IP tab. 1.
20 FCoE login groups FCoE login groups The FCoE Configuration dialog box allows you to manage the FCoE login configuration parameters on the DCB switches in all discovered fabrics. FCoE login configuration is created and maintained as a fabric-wide configuration. With the FCoE license, the FCoE Configuration dialog box displays virtual FCoE port information and enables you to manage the virtual port information.
FCoE login groups 20 • Click Edit to launch the Edit Login Group dialog box, where you can edit the login group parameters. See “Editing an FCoE login group” on page 856. • Click Delete to remove the login group from the list. See “Deleting one or more FCoE login groups” on page 857. Adding an FCoE login group Complete the following steps to add switches to a login group. You can manually add ports by entering the world wide name (WWN) or select available managed CNAs from all discovered hosts.
20 FCoE login groups • Port WWN — Click to enter the world wide name (WWN) of the port to associate with the selected switch. The member port WWN text field allows a maximum of 16 digits. • Managed CNAs — Click to show a list of products and ports which can be selected as login group members. 6. Select available members from the Products/Ports list and click the right arrow button to move the available members to the Selected Members list. 7. Click OK.
FCoE login groups 20 • Rename the login group by entering the new name into the Name field. The Allow All option must be selected to rename the login group. • Select one of the following options to add or remove login members into the Available Members list. The Allow Specific option must be selected to add or remove login members. • Port WWN — Click to enter the world wide name (WWN) of the port to associate with the selected switch. The member port WWN text field allows a maximum of 16 digits.
20 Virtual FCoE port configuration The FCoE login management feature is disabled and all login groups on the selected switch are deleted. The value in the FCoE Login Management State column for the selected switch is Disabled and no login groups appear under the switch after the FCoE Configuration dialog box refresh operation. • “FCoE login groups” Enabling the FCoE login management feature on a switch 1. Select Configure > FCoE from the menu bar. or Right-click the DCB device and select FCoE.
Virtual FCoE port configuration 20 • There is a dynamic binding between the virtual FCoE port and the physical port or LAG. • There is a static binding between the virtual FCoE port and the physical port or lag and there are end devices connected to it. To view the virtual FCoE ports, complete the following steps: 1. Select Configure > FCoE from the menu bar. or Right-click the DCB device and select FCoE. The FCoE Configuration dialog box displays. 2. Select the Virtual FCoE Ports tab.
20 Virtual FCoE port configuration NOTE Clearing a stale entry is not supported for Network OS devices. 1. Select a virtual FCoE port from the FCoE Configuration dialog box and click Connected Devices. The Connected Devices dialog box displays. 2. Select one or more rows from the Connected Devices table and click Disconnect. The DCB Confirmation and Status dialog displays. The selected connected device should be cleared from the switch cache and from the table.
Chapter 21 Telemetry In this chapter • Telemetry overview . . . . . . . . . . . . . . . . . . . . . . . . . . . . . . . . . . . . . . . . . . . . 861 • Policy-based routing . . . . . . . . . . . . . . . . . . . . . . . . . . . . . . . . . . . . . . . . . . . 861 • ACL Accounting . . . . . . . . . . . . . . . . . . . . . . . . . . . . . . . . . . . . . . . . . . . . . . .
21 Policy-based routing The Management application creates an IPv4 PBR or IPv6 PBR based on the ACLs defined in the policy. • If any rule in the policy contains an IPv4 ACL, the Management application creates an IPv4 PBR applies the PBR to the ports. • If any rule in the policy contains an IPv6 ACL, the Management application creates an IPv6 PBR applies the PBR to the ports.
Policy-based routing 21 Source — Port (one or more) to which this PBR policy is bound. For PBR policies bound to multiple ports, displays all ports separated by commas. For globally applied PBR policies, displays blank. Match — L3 ACL policy associated with the rule. You can define up to 10 ACL policies (5 IPv4 and 5 IPv6) per rule. Next Hop — Destination for the packets that pass ACL filter. You can define multiple next hops. PBR selects the first next hop from the next hop list that is up.
21 Policy-based routing Adding a new policy 1. Select an Ethernet router, Ethernet core router, or Ehternet Backbone router product and select Configure > Policy Based Routing. The Product_Name PBR Configuration dialog box displays. 2. Select Add > New Policy. The PBR Policy Configuration dialog box displays. 3. Enter a name for the new policy and click OK on the PBR Policy Configuration dialog box. 4. To add one or more rules to the policy, refer to “Adding rules to a policy” on page 864. 5.
Policy-based routing 21 The rule name can be up to 127 characters and must be unique within the policy. 4. Select one or more ACLs to use in the rule from the Available ACLs table. Each rule can match up to 10 ACLs (5 IPv4 and 5 IPv6) and can have multiple hops to a destination. The Available ACLs table displays the available IPv4 and IPv6 ACLs on this product. IPv4 and IPv6 have two separate policy lists. IPv4 PBR rules can only have IPv4 ACLs and IPv4 addresses in the next hop.
21 Policy-based routing Adding policies from saved configurations 1. Select an Ethernet router, Ethernet core router, or Ehternet Backbone router product and select Configure > Policy Based Routing. The Product_Name PBR Configuration dialog box displays. 2. Select Add > From Saved Configurations. The PBR Saved Configurations dialog box displays. 3. Select the configuration you want to add from the list and click OK. 4. Click OK on the Product_Name PBR Configuration dialog box.
Policy-based routing 21 The Deploy to Products - PBR dialog box displays. To deploy the PBR policy, refer to “Deploying a PBR policy on demand” on page 867, “Saving a PBR policy deployment” on page 868, or “Scheduling a PBR policy deployment” on page 869. Deleting a policy or rule 1. Select an Ethernet router, Ethernet core router, or Ehternet Backbone router product and select Configure > Policy Based Routing. The Product_Name PBR Configuration dialog box displays. 2.
21 Policy-based routing 6. Select the product monitoring template you want to use from the CLI Template list. 7. Select one or more of the following to capture snapshots: • Select the Pre-deployment check box to capture a snapshot of the product’s configuration prior to deployment of the security configuration. • Select the Post-deployment check box to capture a snapshot of the product’s configuration after deployment of the security configuration.
Policy-based routing 7. 21 Select one or more of the following to capture snapshots: • Select the Pre-deployment check box to capture a snapshot of the product’s configuration prior to deployment of the security configuration. • Select the Post-deployment check box to capture a snapshot of the product’s configuration after deployment of the security configuration.
21 Policy-based routing 7. Click OK on the Schedule Properties dialog box. 8. Click the Snapshot Use check box and click the ellipsis button to select the product monitoring template. NOTE The Snapshot Use check box is only available for IronWare products. The Pre-Post Snapshot Properties dialog box displays. 9. Select the product monitoring template you want to use from the CLI Template list. 10.
Policy-based routing 21 Configuring a daily deployment schedule To configure a daily deployment schedule, complete the following steps. 1. Select Daily from the Frequency list. 2. Select the time of day you want deployment to run from the Time (hh:mm) lists. Where the hour value is from 1 through 12, the minute value is from 00 through 59, and the day or night value is AM or PM. To finish configuring the deployment schedule, return to step 7 of “Scheduling a PBR policy deployment” on page 869.
21 ACL Accounting ACL Accounting NOTE ACL accounting is only supported on Ethernet router, Ethernet core router, or Ehternet Backbone router products running 5.4 or later. Ethernet router, Ethernet core router, or Ehternet Backbone router products monitor the number of times an ACL is used to filter incoming or outgoing traffic on an interface.
ACL Accounting 21 2. Select the Clear all counters on device check box. 3. Click OK on the ACL Accounting dialog box. Viewing ACL counters Before you can view ACL counters, you must enable ACL accounting on the product (refer to “Enabling or disabling ACL accounting” on page 872). To view ACL accounting on a product, select an Ethernet router, Ethernet core router, or Ehternet Backbone router product and select Configure > Security > Layer 2/3 ACL > Product.
21 874 ACL Accounting Brocade Network Advisor SAN + IP User Manual 53-1003155-01
Chapter 22 Security Management In this chapter • Security overview . . . . . . . . . . . . . . . . . . . . . . . . . . . . . . . . . . . . . . . . . . . . . . • Layer 2 access control list management . . . . . . . . . . . . . . . . . . . . . . . . . . . • Layer 3 access control list policy . . . . . . . . . . . . . . . . . . . . . . . . . . . . . . . . . • Media Access Control (MAC) filter management. . . . . . . . . . . . . . . . . . . . . • Security configuration deployment. . . . . . . . . . . . . . .
22 Layer 2 access control list management You should configure the ACL on the device before you assign the ACL to an interface. You can create multiple ACLs and save them to the device configuration. However, the ACL does not filter traffic until you assign it to an interface. You can assign an ACL on a physical port, Virtual LAN (VLAN), or Link Aggregation Group (LAG). For IronWare OS products, you can create a standard ACL.
Layer 2 access control list management 22 FIGURE 337 Add - Layer 2 ACL Configuration dialog box 3. Enter a number for the ACL in the Number field. For IronWare 5.4 and later, ACL numbers range from 400 through 1399. For IronWare 5.3, ACL numbers range from 400 through 599. For IronWare less than 5.3, ACL numbers range from 400 through 499. 4. Select Permit or Deny from the Action list. 5.
22 Layer 2 access control list management • Any — Any of the protocols 9. (Deny actions only) Select the Log Enable check box to generate a log for this configuration. 10. Click the right arrow button. The new ACL rule displays in the ACL Entries list. 11. To create additional rules for the same ACL, repeat step 4 through step 10. 12. Click OK on the Add - Layer 2 ACL Configuration dialog box. The new ACL rule displays in the ACLs list. To create additional ACL, repeat step 2 through step 12. 13.
Layer 2 access control list management 22 Copying a Layer 2 ACL configuration (IronWare) To copy a Layer 2 ACL configuration, complete the following steps. 1. Select a device and select Configure > Security > Layer 2 ACL > Product. The Device_Name - Layer 2 ACL Configuration dialog box displays. 2. Select the ACL configuration you want to copy and click Duplicate. The Duplicate - Layer 2 ACL Configuration dialog box displays. 3. Enter a number for the ACL in the Number field. For IronWare 5.
22 Layer 2 access control list management Assigning a Layer 2 ACL configuration to an interface (IronWare) NOTE You cannot modify or delete a Layer 2 ACL that is bound to a port. To assign a Layer 2 ACL configuration to an interface, complete the following steps. 1. Select Configure > Security > Layer 2 ACL > Port. The Port Selection - Layer 2 ACL dialog box displays. FIGURE 338 Port Selection - Layer 2 ACL dialog box 2. Select a port in the Available Ports list and click the right arrow button. 3.
Layer 2 access control list management 22 FIGURE 339 Device_Name - Port_Number - Layer 2 ACL Configuration dialog box 4. (Ethernet routers only) Select a duration (1 Second, 1 Minute, 5 Minutes, or Cumulative) to track the number of times an ACL filter is used in the Hits Stats Duration list. Click Refresh to collect the hit statistics. The application updates the Hits column of the Details of Selected ACL list. 5.
22 Layer 2 access control list management 6. To assign an ACL configuration to outbound messages, select the Outbound check box and complete the following steps: NOTE You can only assign an ACL to an outbound message on an Application product. a. Select the Assign ACL option and choose one of the following options from the first Assign ACL list: • Select ACLs on this Product to assign ACLs deployed on the product to the port.
Layer 2 access control list management 22 Fabric OS Layer 2 ACL configuration This section provides procedures for configuring a standard for extended Layer 2 ACL on a device, assigning the Layer 2 ACL to an interface, as well as clearing Layer 2 ACL assignments from a device. Creating a standard Layer 2 ACL configuration (Fabric OS) To create a standard Layer 2 ACL configuration, complete the following steps. 1. Select the device and select Configure > Security > Layer 2 ACL > Product.
22 Layer 2 access control list management 10. Click OK on the Add - Layer 2 ACL Configuration dialog box. The new ACL configuration displays in the ACLs list. To create additional ACLs, repeat step 2 through step 10. 11. Click OK on the Device_Name - Layer 2 ACL Configuration dialog box. The Deploy to Products - Layer 2 ACL dialog box displays.
Layer 2 access control list management 22 3. Enter a new name for the ACL in the Name field. 4. To edit an existing ACL rule, complete the following steps. a. Select the rule you want to edit in the ACL Entries list and click the left arrow button. b. Complete step 5 through step 9 in “Creating a standard Layer 2 ACL configuration (Fabric OS)” on page 883. The updated ACL entry displays in the ACL Entries list. To edit additional ACL entries, repeat step 4. 5.
22 Layer 2 access control list management 4. Enter a name for the ACL in the Name field. 5. Enter a sequence number for the ACL in the Sequence field. 6. Select Permit or Deny from the Action list. 7. In the Source list, select one of the following options: • Any • Host • MAC Selecting MAC or Host enables the Source field. Enter the source address on which the configuration filters traffic in the Source field. 8.
Layer 2 access control list management 22 Editing an extended Layer 2 ACL configuration (Fabric OS) To edit an extended Layer 2 ACL configuration on a Fabric OS device, complete the following steps. 1. Select the device and select Configure > Security > Layer 2 ACL > Product. The Device_Name - Layer 2 ACL Configuration dialog box displays. 2. Select the ACL you want to edit in the ACLs list and click Edit. The Configuration_Name Edit Extended Layer 2 ACL Configuration dialog box displays. 3.
22 Layer 2 access control list management 5. To add a new ACL rule, complete step 4 through step 12 in “Creating an extended Layer 2 ACL configuration (Fabric OS)” on page 885. The new ACL entry displays in the ACL Entries list. To add additional ACL entries, repeat step 5. 6. To delete an existing ACL rule, select the rule you want to edit in the ACL Entries list and click the left arrow button. 7. Click OK on the Duplicate - Layer 2 ACL Configuration dialog box.
Layer 2 access control list management 22 4. Select the Assign ACL option and choose one of the following options from the first Assign ACL list: • Select ACLs on this Product to assign ACLs deployed on the product to the port. The second list is populated with the ACLs deployed on the switch or associated with a save deployment object. • Select ACLs bound to this port to assign ACLs bound to the interface to the port. The second list is populated with the ACLs bound to the interface.
22 Layer 2 access control list management 4. Click OK on the Layer 2 ACL Saved Configurations dialog box. The new ACL displays in the ACLs list. 5. Click OK on the Device_Name - Layer 2 ACL Configuration dialog box. The Deploy to Products - Layer 2 ACL dialog box displays.
Layer 2 access control list management 22 Network OS Layer 2 ACL configuration NOTE You cannot configure a Layer 2 ACL using the Management application. You must configure the Layer 2 ACL through the Network OS CLI (refer to the Network OS Command Reference). Once you configure Layer 2 ACLs through the Network OS CLI, you can use the Management application to view Layer 2 ACL configurations for a VCS fabric or standalone device.
22 Layer 2 access control list management • Details of Selected ACLs list — Displays the details of the ACL selected in the ACLs list. The Details of Selected ACLs table includes the following details: Sequence — The Layer 2 ACL entry sequence number. Action — Whether the ACL permits or denies traffic. Source — The source MAC address on which the ACL filters traffic. Destination (Extended only) — The destination MAC address on which the ACL filters the traffic.
Layer 2 access control list management 22 2. Review the Layer 2 ACL configuration details. • ACLs list — Displays the ACLs to be deployed for this configuration. The ACLs list includes the following details: Operation — Displays the ACL operation (no action) during deployment. Name — The name of the ACL. Type — The ACL type. Options include: Extended or Standard. Details of Selected ACLs list — Displays the details of the ACL selected in the ACLs list.
22 Layer 3 access control list policy FIGURE 345 Device/Fabric_Name - Port_Number - Layer 2 ACL Configuration dialog box 4. Review the Layer 2 ACL configuration details. Details of Selected ACL table — Displays the details of the ACL selected in the ACLs list.The Details of Selected ACL table includes the following details: • • • • Sequence — The Layer 2 ACL entry sequence number. Action — Whether the ACL permits or denies traffic. Source — The source MAC address on which the ACL filters traffic.
Layer 3 access control list policy 22 You can create two types of ACLs: • Standard ACL — Use to permit and deny traffic based on the source IP address, host name, or network. You should use standard ACLs when you only need to filter traffic based the source. You can create up to 99 standard ACLs ranging from 1 through 99. For more information, refer to “Creating a standard L3 ACL configuration” on page 895.
22 Layer 3 access control list policy FIGURE 347 Add - L3 ACL Configuration (Standard) dialog box 3. Select Standard from the Type list. 4. Enter a name or number for the ACL in the ACL Name/Number field. 5. Select Permit or Deny from the Action list. 6. Enter a description for the ACL in the Remarks field. 7. Choose one of the following options from the Source list: • To enter an IP address, select IP Address and complete the following steps: a.
Layer 3 access control list policy 22 12. Click OK on the Add - L3 ACL Configuration dialog box. The Device_Name - L3 ACL Configuration dialog box displays. 13. To set the configuration type and operations, refer to “Configuring the ACL configuration type and operations” on page 911. 14. (Ethernet routers only) To set the hit statistics duration, refer to “Configuring hit statistics” on page 911. 15. To deploy the configuration, click OK on the Device_Name - L3 ACL Configuration dialog box.
22 Layer 3 access control list policy b. Complete step 5 through step 10 in “Creating a standard L3 ACL configuration” on page 895. The updated ACL rule displays in the ACL Entries list. To update additional rules for the same ACL, repeat step 4. 5. To add a new rule, complete step 5 through step 10 in “Creating a standard L3 ACL configuration” on page 895. The updated ACL rule displays in the ACL Entries list. To update additional rules for the same ACL, repeat step 5. 6.
Layer 3 access control list policy 22 The updated ACL rule displays in the ACL Entries list. To update additional rules for the same ACL, repeat step 4. 6. To add a new rule, complete step 5 through step 10 in “Creating a standard L3 ACL configuration” on page 895. The updated ACL rule displays in the ACL Entries list. To update additional rules for the same ACL, repeat step 5. 7. To delete an existing rule, select the rule you want to delete in the ACL Entries list and click the left arrow button. 8.
22 Layer 3 access control list policy FIGURE 348 Add - L3 ACL Configuration (Extended) dialog box 4. Enter a name or number for the ACL in the ACL Name/Number field. 5. Select Permit or Deny from the Action list. 6. Enter a description for the ACL in the Remarks field. 7. Choose one of the following options from the Source list: • To enter an IP address, select IP Address and complete the following steps: a.
Layer 3 access control list policy 22 • To select a network, select IP Address and choose a network from the list. To configure a network, click the ellipsis button and refer to “Network configuration” on page 916. • To enter a host name, select Host and enter the destination host name on which the ACL filters traffic in the Host list and text field. 9. Enter a VLAN identifier (valid values are from 1 to 4095) from the VLAN list. 10. Select the Log Enable check box to enable logging. 11.
22 Layer 3 access control list policy a. Select the rule you want to edit in the ACL Entries list and click the left arrow button. The rule displays in the ACL Entry area. b. Complete step 5 through step 12 in “Creating an extended L3 ACL configuration” on page 899. The updated ACL rule displays in the ACL Entries list. To edit additional rules for the same ACL, repeat step 3. 4. To add a new rule, complete step 5 through step 12 in “Creating an extended L3 ACL configuration” on page 899.
Layer 3 access control list policy a. 22 Select the rule you want to edit in the ACL Entries list and click the left arrow button. The rule displays in the ACL Entry area. b. Complete step 5 through step 12 in “Creating an extended L3 ACL configuration” on page 899. The updated ACL rule displays in the ACL Entries list. To edit additional rules for the same ACL, repeat step 4. 5. To add a new rule, complete step 5 through step 12 in “Creating an extended L3 ACL configuration” on page 899.
22 Layer 3 access control list policy The Add - L3 ACL (IPv6) Configuration dialog box displays. FIGURE 349 Add - L3 ACL (IPv6) Configuration dialog box 3. Enter a name or number for the ACL in the ACL Name/Number field. 4. Select Permit or Deny from the Action list. 5. Enter a description for the ACL in the Remarks field. 6. Choose one of the following options from the Source list: • To enter an IP address, select IP Address and complete the following steps: a.
Layer 3 access control list policy 22 • To select a network, select IP Address and choose a network from the list. • To enter a host name, select Host and enter the destination host name on which the ACL filters traffic in the Host list and text field. 8. Enter a VLAN identifier (valid values are from 1 to 4095) from the VLAN list. 9. Select the Log Enable check box to enable logging. 10. Click Advanced Settings to configure additional settings for the ACL configuration.
22 Layer 3 access control list policy The Deploy to Products - L3 ACL dialog box displays. To deploy the configuration, refer to “Security configuration deployment” on page 943. Editing an IPv6 L3 ACL configuration To edit an IPv6 L3 ACL configuration, complete the following steps. 1. Select an Ethernet router product and select Configure > Security > L3 ACL > Product. The Device_Name - L3 ACL Configuration dialog box displays. 2.
Layer 3 access control list policy 22 Copying an IPv6 L3 ACL configuration To copy an IPv6 L3 ACL configuration, complete the following steps. 1. Select an Ethernet router product and select Configure > Security > L3 ACL > Product. The Device_Name - L3 ACL Configuration dialog box displays. 2. Select the ACL configuration you want to copy in the ACLs list and click Duplicate. The Duplicate - L3 ACL (IPv6 ) Configuration dialog box displays with the default name ‘Copy of Original_Name’.
22 Layer 3 access control list policy 11. Click OK on the Duplicate - L3 ACL (IPv 6) Configuration dialog box. The new ACL displays in the ACLs list. 12. To set the configuration type and operations, refer to “Configuring the ACL configuration type and operations” on page 911. 13. (Ethernet routers only) To set the hit statistics duration, refer to “Configuring hit statistics” on page 911. 14. To deploy the configuration, click OK on the Device_Name - L3 ACL Configuration dialog box.
Layer 3 access control list policy 22 FIGURE 352 Device_Name - Port_Number - ACL Port Configuration dialog box 4. (Ethernet routers only) Select a duration (1 Second, 1 Minute, 5 Minutes, or Cumulative) to track the number of times an ACL filter is used in the Hits Stats Duration list. Click Refresh to collect the hit statistics. The application updates the Hits column of the Details of Selected ACL list. 5.
22 Layer 3 access control list policy a. Select the Assign ACL option and choose one of the following options from the first Assign ACL list: • Select ACLs on this Product to assign ACLs deployed on the product to the port. The second list is populated with the ACLs deployed on the switch or associated with a save deployment object. • Select ACLs bound to this port to assign ACLs bound to the interface to the port. The second list is populated with the ACLs bound to the interface.
Layer 3 access control list policy 22 Configuring the ACL configuration type and operations To configure the ACL configuration type and operation, complete the following steps. 1. Select the configuration type by choosing one of the following options: • Incremental — Deploys add and delete operations. During deployment, the Management application checks all ACLs to determine if the ACL name or number matches any ACL number already deployed on a switch.
22 Layer 3 access control list policy Configuring L3 ACL advanced settings You configure L3 ACL advanced settings for extended L3 ACL device configurations.
Layer 3 access control list policy 22 • Max-throughput (4) — Select to have the ACL filters packets that match the maximum throughput TOS. The decimal value is 4. • Min-delay (8) — Select to have the ACL filter packets that match the minimum delay TOS. The decimal value is 8. 4. Select one of the following protocols from the Protocol list to filter the packet by protocol.
22 Layer 3 access control list policy b. Enter a port number or select a port application name from the Start list. If you selected range from the Operator list, enter the port number or name of the lower numbered port in the range. Click the ellipsis button to launch the Service dialog box to see a list of services and service groups. For more information about services and service groups, refer to “Service configuration” on page 925. c.
Layer 3 access control list policy b. 22 Choose one of the following code types: The available code types vary depending on the selected message type.
22 Layer 3 access control list policy 14. Click OK on the Advanced Settings dialog box.
Layer 3 access control list policy 22 1. Click the Networks tab. FIGURE 354 Network dialog box, Networks tab 2. Review the List of Networks table: • Name — The user-defined network name. • Subnet — The IP address of the subnet. • Mask — The IP address of the mask. 3. Click Close on the Network dialog box. To finish configuring the ACL, return to one of the above procedures. Creating a network You can access the Network dialog box when configuring a standard or extended L3 ACL device configuration.
22 Layer 3 access control list policy 3. Enter a name for the network in the Name field. 4. Enter a valid IP address (IPv4 format) in the Subnet field. 5. Enter a valid IP address in the Mask field. If you use the ACL Network as the source IP address, the Subnet mask from the ACL Network will be converted to Wildcard mask when deploying the ACL to the device. The Network dialog box only accepts subnet mask. 6. Click OK on the Add Network dialog box. 7. Click Close on the Network dialog box.
Layer 3 access control list policy 22 Copying a network You can access the Network dialog box when configuring a standard or extended L3 ACL device configuration.
22 Layer 3 access control list policy 3. Click Yes on the confirmation message. 4. Click Close on the Network dialog box. To finish configuring the ACL, return to one of the above procedures. Network group configuration The Management application allows you to filter traffic from a specific network group. A network group is made up of one or more devices, networks, or network groups.
Layer 3 access control list policy 22 2. Review the List of Network Groups table: • • • • • Name — The user-defined network group name. Host Names — The name of each host in the network group. Address Range — The range of IP addresses for the network group. Networks — The name of each network in the network group. Network Groups — The name of each network group in the network group. 3. Click Close on the Network dialog box. To finish configuring the ACL, return to one of the above procedures.
22 Layer 3 access control list policy 4. To add a host to the network group, complete the following steps. a. Enter a valid host name in the Host Name field. b. Click the right arrow button to move the host name to the Selected table. 5. To add an address range to the network group, complete the following steps. a. Enter an IP address for the start of the range in the Start field. b. Enter an IP address for the end of the range in the End field. c.
Layer 3 access control list policy 22 5. To edit an address range to the network group, complete the following steps. a. Select the range you want to edit in the Selected table and click the left arrow button. b. Change the IP address for the start of the range in the Start field. c. Change the IP address for the end of the range in the End field. d. Click the right arrow button to move the address range back to the Selected table. 6.
22 Layer 3 access control list policy 5. To add a host to the network group, complete the following steps. a. Enter a valid host name in the Host Name field. b. Click the right arrow button to move the host name to the Selected table. 6. To edit an address range to the network group, complete the following steps. 7. a. Select the range you want to edit in the Selected table and click the left arrow button. b. Change the IP address for the start of the range in the Start field. c.
Layer 3 access control list policy 22 Deleting a network group NOTE You cannot delete a network group that is in use. You can access the Network dialog box when configuring a standard or extended L3 ACL device configuration.
22 Layer 3 access control list policy Viewing existing services You can access the Service dialog box when configuring an extended L3 ACL device configuration.
Layer 3 access control list policy 22 Creating a service You can access the Service dialog box when configuring an extended L3 ACL device configuration.
22 Layer 3 access control list policy Editing a service You can access the Service dialog box when configuring an extended L3 ACL device configuration.
Layer 3 access control list policy 22 4. Select one of the following protocol options: • TCP • UDP 5. Enter a port number in the Port field. 6. Click OK on the Duplicate Service dialog box. 7. Click Close on the Service dialog box. To finish configuring the advanced settings for the ACL, refer to “Configuring L3 ACL advanced settings” on page 912. Deleting a service You can access the Service dialog box when configuring an extended L3 ACL device configuration.
22 Layer 3 access control list policy Service group configuration The Management application allows you to filter traffic from a specific service group. A service group is made up of one or more port ranges, services, or service groups.
Layer 3 access control list policy 22 3. Click Close on the Service dialog box. To finish configuring the advanced settings for the ACL, refer to “Configuring L3 ACL advanced settings” on page 912. Creating a service group You can access the Service dialog box when configuring an extended L3 ACL device configuration.
22 Layer 3 access control list policy 5. To add a service to the group, complete the following steps. a. Select one or more services to add to the group in the Services table. b. Click the right arrow button to move the selected services to the Selected table. 6. To add a service group to the group, complete the following steps. 7. a. Select one or more service groups to add to the group in the Services table. b.
Layer 3 access control list policy 22 6. Click OK on the Edit Service Group dialog box. The Service dialog box, Service Group tab displays with the new group in the List of Service Groups table. 7. Click Close on the Service dialog box. To finish configuring the advanced settings for the ACL, refer to “Configuring L3 ACL advanced settings” on page 912. Copying a service group You can access the Service dialog box when configuring an extended L3 ACL device configuration.
22 Media Access Control (MAC) filter management Deleting a service group You can access the Service dialog box when configuring an extended L3 ACL device configuration.
Media Access Control (MAC) filter management 22 You can configure and manage MAC filters at the device or interface (port/trunk) level. NOTE You can only apply MAC filters inbound traffic. When you configure MAC filters on a device, the MAC filter does not execute until you deploy it on an interface. Once deployed to an interface, the device performs the action associated with the first matching filter (of all filters deployed to the device) to the packet.
22 Media Access Control (MAC) filter management FIGURE 363 Add MAC Filter dialog box 3. Enter a MAC filter number in the MAC Filter # field. MAC filter numbers range from 1 through 1024. 4. (Optional) Enter a description of the MAC filter in the Description field. The description is saved to the Management application database only. It is not saved to the switch. 5. Select Permit or Deny from the Action list. 6.
Media Access Control (MAC) filter management 22 9. In the Operator list, select one of the following to specify a binary operator: • • • • = (equal to) != (not equal to) > (greater than) < (less than). This field is not available when the Ethernet Type is none. 10. Enter the type of frame in the Frame Type field. This ia 2 byte hexadecimal value. Valid values include 0600 to FFFF. This field is not available when the Ethernet Type is none. 11. Click OK on the Add MAC Filter dialog box.
22 Media Access Control (MAC) filter management 4. Click OK on the MAC Filter Saved Configurations dialog box. The Device_Name - MAC Filter Configuration dialog box displays with the selected MAC filters in the MAC Filters table. If you selected a saved deployment configuration, all MAC filters associated with the saved deployment configuration display in the MAC Filters table. 5. Click OK on the Device_Name - MAC Filter Configuration dialog box. The Deploy to Products - MAC Filter dialog box displays.
Media Access Control (MAC) filter management 22 6. In the Destination Address list, select one of the following options: • Any • MAC Selecting MAC enables the Destination Address and Destination Mask fields. 7. a. Enter the destination MAC address on which the configuration filters traffic in the Destination Address field. b. Enter the mask associated with the destination MAC address in the Destination Mask field.
22 Media Access Control (MAC) filter management 4. Enter a description of the MAC filter in the Description field. 5. Select Permit or Deny from the Action list. 6. In the Source Address list, select one of the following options: • Any • MAC Selecting MAC enables the Source Address and Source Mask fields. 7. a. Enter the source MAC address on which the configuration filters traffic in the Source Address field. b. Enter the mask associated with the source MAC address in the Source Mask field.
Media Access Control (MAC) filter management 22 Deleting a MAC filter 1. Select Configure > Security > MAC Filter > Product. The Device_Name - MAC Filter Configuration dialog box displays. 2. Select the MAC filter you want to delete in the MAC Filters table and click Delete. 3. Click Yes on the confirmation message. 4. Click OK on the Device_Name - MAC Filter Configuration dialog box. NOTE The MAC Filter is not deleted from the switch until you deploy the configuration to the switch.
22 Media Access Control (MAC) filter management Clearing MAC filter assignments To clear a MAC filter assignment from a port or product, complete the following steps. 1. Select Configure > Security > MAC Filter > Port. The Port Selection - MAC Filter dialog box displays. 2. Select the port you want to clear the MAC filter from in the Available Ports list and click the right arrow button. You can select more ports or products from the Deploy to Ports - MAC Filter dialog box. 3.
Security configuration deployment 22 Security configuration deployment Figure 366 shows the standard interface used to deploy security configurations. FIGURE 366 Deploy to Product/Ports dialog box Before you can deploy a security configuration, you must create the security configuration.
22 Security configuration deployment Deploying a security configuration on demand To deploy a security configuration immediately, complete the following steps. FIGURE 367 Deploy to Product/Ports dialog box 1. Choose one of the following options: • Deploy now — Select to deploy the configuration immediately on the product or port without saving the deployment definition.
Security configuration deployment 22 • Select the Pre-deployment check box to capture a snapshot of the product’s configuration prior to deployment of the security configuration. • Select the Post-deployment check box to capture a snapshot of the product’s configuration after deployment of the security configuration. If you select the Post-deployment check box, enter the amount of time (between 1 and 300 seconds) you want the application to wait before capturing the snapshot in the Delay field. 8.
22 Security configuration deployment 5. Click the Snapshot Use check box and click the ellipsis button to select the product monitoring template. NOTE The Snapshot Use check box is only available for IronWare products. The Pre-Post Snapshot Properties dialog box displays. 6. Select the product monitoring template you want to use from the CLI Template list. 7.
Security configuration deployment 22 2. Choose one of the following options: • Select New from the Add list. The Add - Layer 2 ACL Configuration dialog box displays. • Select an ACL in the list and click Edit. The Edit - Layer 2 ACL Configuration dialog box displays. 3. Configure the Layer 2 ACL and click OK on the Add/Edit - Layer 2 ACL Configuration dialog box. 4. Click OK on the Device_Name - Layer 2 ACL Configuration dialog box. The Deploy to Products - Layer 2 ACL dialog box displays. 5.
22 Security configuration deployment Configuring a one-time deployment schedule To configure a one-time schedule, complete the following steps. 1. Select One Time from the Frequency list. 2. Select the time of day you want deployment to run from the Time (hh:mm) lists. Where the hour value is from 1 through 12, the minute value is from 00 through 59, and the day or night value is AM or PM. 3. Click the Date list to select a date from the calendar.
Security configuration deployment 22 Configuring a monthly deployment schedule To configure a monthly schedule, complete the following steps. 1. Select Monthly from the Frequency list. 2. Select the time of day you want deployment to run from the Time (hh:mm) lists. Where the hour value is from 1 through 12, the minute value is from 00 through 59, and the day or night value is AM or PM. 3. Select the day you want deployment to run from the Day of the Month list (1 through 31).
22 950 Security configuration deployment Brocade Network Advisor SAN + IP User Manual 53-1003155-01
Chapter 23 FC-FC Routing Service Management In this chapter • Devices that support Fibre Channel routing . . . . . . . . . . . . . . . . . . . . . . . . • Fibre Channel routing overview . . . . . . . . . . . . . . . . . . . . . . . . . . . . . . . . . . • Guidelines for setting up Fibre Channel routing . . . . . . . . . . . . . . . . . . . . . • Connecting edge fabrics to a backbone fabric . . . . . . . . . . . . . . . . . . . . . . • Configuring routing domain IDs . . . . . . . . . . . . . . . . . . . .
23 Fibre Channel routing overview • Any of the following blades on a Backbone chassis: - 4 Gbps Router, Extension Blade - FC 8 GB 16-port Blade - FC 8 GB 32-port Blade - FC 8 GB 32-port Enhanced Blade (16 Gbps 4-slot or 16 Gbps 4-slot Backbone Chassis only) - FC 8 GB 48-port Blade - The shared ports area (ports 16-47) cannot be used as EX_Ports.
Guidelines for setting up Fibre Channel routing 23 Figure 370 on page 953 shows a metaSAN with a backbone fabric and three edge fabrics. The backbone consists of one 4 Gbps Router, Extension Switch connecting hosts in Edge fabrics 1 and 3 with storage in Edge fabric 2 and the backbone fabric.
23 Connecting edge fabrics to a backbone fabric Connecting edge fabrics to a backbone fabric The following procedure explains how to set up FC-FC routing on two edge fabrics connected through an FC router using E_Ports and EX_Ports. NOTE To configure an EX_Port, switches running Fabric OS 7.0.0 or earlier must have an FCR license. Switches running Fabric OS 7.0.1 or later configured in Brocade Native mode (IM0) or Brocade NOS mode (IM5) do not require an FCR license.
Connecting edge fabrics to a backbone fabric 23 FIGURE 371 Router Configuration-Connect Edge Fabric dialog box 3. Select the FC router from the Available Routers list. 4. Click the right arrow button to move the FC router you selected to the Selected Router list. 5. Select a valid fabric ID from the Fabric ID list. You can choose any unique fabric ID as long as it is consistent for all EX_Ports that connect to the same edge fabric.
23 Configuring routing domain IDs 9. Configure LSAN zones in each fabric that will share devices. For specific instructions, refer to “Configuring LSAN zoning” on page 1193. Configuring routing domain IDs Logical (phantom) domains are automatically created to enable routed fabrics. Two types of logical domains are created: • A front domain is created in edge fabrics for every interfabric link (IFL). • A translate (Xlate) domain is created in routed fabrics that share devices.
Chapter Virtual Fabrics 24 In this chapter • Virtual Fabrics overview . . . . . . . . . . . . . . . . . . . . . . . . . . . . . . . . . . . . . . . . 957 • Virtual Fabrics requirements . . . . . . . . . . . . . . . . . . . . . . . . . . . . . . . . . . . . 958 • Configuring Virtual Fabrics . . . . . . . . . . . . . . . . . . . . . . . . . . . . . . . . . . . . . .
24 Virtual Fabrics requirements Terminology for Virtual Fabrics Table 107 lists definitions of Virtual Fabrics terms. TABLE 107 Virtual Fabrics terms Term Definition Physical chassis The physical switch or chassis from which you create logical switches and fabrics. Logical switch A collection of ports that act as a single Fibre Channel (FC) switch. When Virtual Fabrics is enabled on the chassis, there is always at least one logical switch: the default logical switch.
Virtual Fabrics requirements 24 • Discover a Virtual Fabrics-enabled seed physical chassis running Fabric OS 6.2.0 or later with Virtual Fabrics enabled, and at least one logical switch defined on the core switch. The physical chassis displays as a virtual switch. • Upgrade a physical chassis already in your SAN to Fabric OS 6.2.0 or later. Virtual Fabrics is disabled by default. This switch displays as a legacy switch. Once upgraded, you must enable Virtual Fabrics.
24 Virtual Fabrics requirements TABLE 109 Logical switch Base switch Blade and port types supported on logical switches for backbone chassis (Continued) • • • • • • • • • • Extension Blade — GE_Ports and VE_Ports FC 8 GB Port Blade — E_Ports and F_Ports FC 16 GB Port Blade — E_Ports and F_Ports 8 Gbps Extension Blade - FC ports: E_Ports, F_Ports, and VE_Ports - GE ports: VE_Ports 8-slot and 4-slot Backbone Chassis — ICL ports Extension Blade — GE_Ports and VEX_Ports FC 8 GB Port Blade — E_Ports and EX
FICON best practices for Virtual Fabrics 24 FICON best practices for Virtual Fabrics Use the following recommended best practices and considerations for configuring Virtual Fabrics in a FICON environment when following the procedures under “Configuring Virtual Fabrics” on page 962: • When configuring the logical switch in the New Logical Fabric Template or New Logical Switch dialog box (Fabric tab), use the following parameters.
24 Configuring Virtual Fabrics • When the Logical Switch Change Conformation and Status dialog box displays after configuring logical switches through the Logical Switches dialog box, be sure the following parameters are selected: - Re-Enable ports after moving them. Unbind Port Addresses while moving them QoS disable the ports while moving them.
Configuring Virtual Fabrics d. 24 Enable all of the base switches. This forms the base fabric. Right-click each base switch in the Connectivity Map or Product List and select Enable/Disable > Enable. 3. Set up logical switches in each physical chassis. a. Create logical switches in each physical chassis and assign ports to them. Make sure the logical switches are configured to allow XISL use. Refer to “Creating a logical switch or base switch” on page 964 for instructions. b.
24 Configuring Virtual Fabrics 2. Read the warning message and click OK. Creating a logical switch or base switch Before you can create a logical switch, you must enable Virtual Fabrics on at least one physical chassis in your fabric. Optionally, you can define the logical switch to be a base switch. Each chassis can have only one base switch. NOTE The 8 Gbps Extension Switch does not support base switches. 1. Select Configure > Virtual Fabric > Logical Switches.
Configuring Virtual Fabrics 24 If you select a physical chassis or the Undiscovered Logical Switches node, the fabric-wide settings for the logical switch are the default settings. 4. Click New Switch. The New Logical Switch dialog box displays. FIGURE 375 New Logical Switch dialog box 5. Click the Fabric tab and enter fabric-wide parameters. a. Enter a fabric identifier in the Logical Fabric ID field. This assigns the new logical switch to a logical fabric.
24 Configuring Virtual Fabrics The Base Fabric for Transport check box is not relevant for base switches because all base switches can use XISLs. e. (Optional) For Backbone Chassis only, select an option in the 256 Area Limit list to use 256-area addressing mode (zero-based or port-based) or to disable this mode (default). The 256-area addressing mode can be used in FICON environments, which have strict requirements for 8-bit area FC addresses. 6. Click the Switch tab and enter switch parameters. a.
Configuring Virtual Fabrics 24 1. Expand the Chassis Group node in the Product List. 2. Right-click the physical chassis within the Chassis Group. 3. Select Virtual Fabric > Logical Switches > Logical_Switch_Name. The logical switch you selected is highlighted in the Product List and Connectivity Map. Assigning ports to a logical switch When you create a logical switch, it has no ports and you must explicitly assign ports to it.
24 Configuring Virtual Fabrics NOTE Ports are disabled before moving from one logical switch to another. 9. (Optional) Select the Unbind Port Addresses while moving them check box. 10. Click Start to send these changes to the affected chassis. NOTE Most changes to logical switches will disrupt data traffic in the fabric. The status of each change is displayed in the Status column and Status area in the dialog box. 11. When the changes are complete, click Close. Removing ports from a logical switch 1.
Configuring Virtual Fabrics 24 NOTE Most changes to logical switches will disrupt data traffic in the fabric. The status of each change is displayed in the Status column and Status area in the dialog box. 10. When the changes are complete, click Close. Deleting a logical switch 1. Select Configure > Virtual Fabric > Logical Switches. The Logical Switches dialog box displays. 2. Right-click anywhere in the Existing Logical Switches list and select Table > Expand All. 3.
24 Configuring Virtual Fabrics The logical fabric template exists only in the lifetime and scope of the Logical Switches dialog box. When you exit this dialog box, the logical fabric templates are deleted. 1. Select Configure > Virtual Fabric > Logical Switches. The Logical Switches dialog box displays. 2. Select the physical chassis from which you want to create a logical fabric in the Chassis list. 3. Click New Fabric. The New Logical Fabric Template dialog box displays. 4.
Configuring Virtual Fabrics 24 2. Right-click anywhere in the Existing Logical Switches list and select Table > Expand All. 3. Right-click the logical switch for which you have configured logical fabric settings from the Existing Logical Switches list and select Configure All. The logical fabric configuration settings (Fabric tab) are applied to all logical switches in the same fabric (determined by FID). 4. Click OK on the Logical Switches dialog box.
24 Configuring Virtual Fabrics NOTE Ports are disabled before moving from one logical switch to another. 8. (Optional) Select the Unbind Port Addresses while moving them check box. 9. Click Start to send these changes to the affected chassis. NOTE Most changes to logical switches will disrupt data traffic in the fabric. The status of each change is displayed in the Status column and Status area in the dialog box. 10. When the changes are complete, click Close. 11.
Configuring Virtual Fabrics 24 9. (Optional) Select the Unbind Port Addresses while moving them check box. 10. Click Start to send these changes to the affected chassis. NOTE Most changes to logical switches will disrupt data traffic in the fabric. The status of each change is displayed in the Status column and Status area in the dialog box. 11. When the changes are complete, click Close.
24 974 Configuring Virtual Fabrics Brocade Network Advisor SAN + IP User Manual 53-1003155-01
Chapter SAN Encryption Configuration 25 In this chapter • Encryption Center features . . . . . . . . . . . . . . . . . . . . . . . . . . . . . . . . . . . . . . 976 • Encryption user privileges. . . . . . . . . . . . . . . . . . . . . . . . . . . . . . . . . . . . . . . 977 • Smart card usage . . . . . . . . . . . . . . . . . . . . . . . . . . . . . . . . . . . . . . . . . . . . . 978 • Network connections. . . . . . . . . . . . . . . . . . . . . . . . . . . . . . . . . . . . . . . . . . .
25 Encryption Center features • Using the Encryption Targets dialog box . . . . . . . . . . . . . . . . . . . . . . . . . • Redirection zones . . . . . . . . . . . . . . . . . . . . . . . . . . . . . . . . . . . . . . . . . . . • Disk device decommissioning . . . . . . . . . . . . . . . . . . . . . . . . . . . . . . . . . • Rekeying all disk LUNs manually . . . . . . . . . . . . . . . . . . . . . . . . . . . . . . . • Thin provisioned LUNs. . . . . . . . . . . . . . . . . . . . . . . . . . . . . . . . . .
Encryption user privileges 25 • “Blade processor links” on page 989 describes the steps for interconnecting encryption switches or blades in an encryption group through a dedicated LAN. This must be done before the encryption engines are enabled. Security parameters and certificates cannot be exchanged if these links are not configured and active.
25 Smart card usage TABLE 110 Encryption privileges (Continued) Privilege Storage Encryption Security Read/Write • • • • • • • • • • • • Launch the Encryption center dialog box. View switch, group, or engine properties. View Encryption Group Properties Security tab. View LUN centric view. View all rekey sessions. View encryption targets, hosts, and LUNs. Create a master key. Backup a master key. Edit smart card.
Smart card usage 25 • Establishing a trusted link with the NetApp LKM/SSKM key vault. • Decommissioning a LUN. When a quorum of authentication cards is registered for use, authentication must be provided before you are granted access. Registering authentication cards from a card reader To register an authentication card or a set of authentication cards from a card reader, have the cards physically available.
25 Smart card usage 3. Locate the Authentication Card Quorum Size and select the quorum size from the list. The quorum size is the minimum number of cards necessary to enable the card holders to perform the security sensitive operations listed above. The maximum quorum size is five cards. The actual number of authentication cards registered is always more than the quorum size, so if you set the quorum size to five, for example, you will need to register at least six cards in the subsequent steps.
Smart card usage 25 Registering authentication cards from the database Smart cards that are already in the Management program’s database can be registered as authentication cards. 1. Select Configure > Encryption from the menu task bar to display the Encryption Center dialog box. (Refer to Figure 376 on page 976.) 2. Select an encryption group from the Encryption Center Devices table, then select Group > Security from the menu task bar to display the Encryption Group Properties dialog box.
25 Smart card usage Deregistering an authentication card Authentication cards can be removed from the database and the switch by deregistering them. Complete the following procedure to deregister an authentication card. 1. Select Configure > Encryption from the menu task bar to display the Encryption Center dialog box. (Refer to Figure 376 on page 976.) 2.
Smart card usage 25 Using system cards System cards are smart cards that can be used to control activation of encryption engines. You can choose whether the use of a system card is required or not. Encryption switches and blades have a card reader that enables the use of a system card. System cards discourage theft of encryption switches or blades by requiring the use of a system card at the switch or blade to enable the encryption engine after a power off.
25 Smart card usage Enabling or disabling the system card requirement To use a system card to control activation of an encryption engine on a switch, you must enable the system card requirement. If a system card is required, it must be read by the card reader on the switch. You access the system card GUI from the Security tab. Complete the following procedure to enable or disable the system card requirement. 1.
Smart card usage 25 Deregistering system cards System cards can be removed from the database by deregistering them. Use the following procedure to deregister a system card: 1. Select Configure > Encryption from the menu task bar to display the Encryption Center dialog box. (Refer to Figure 376 on page 976.) 2. Select the switch from the Encryption Center Devices table, then select Switch > System Cards from the menu task bar. The System Cards dialog box displays. (Refer to Figure 381 on page 983.) 3.
25 Smart card usage FIGURE 382 Smart Card Asset Tracking dialog box The Smart Cards table lists the known smart cards and the details for the smart cards. These details include the following: • Card ID: Lists the smart card ID, prefixed with an ID that identifies how the card id used. For example, rc.123566b700017818, where rc stands for recovery card. • Card Type: Options are: System card, Authentication card, and Recovery set. • Usage: Usage content varies based on the card type.
Smart card usage 25 NOTE You can remove smart cards from the table to keep the Smart Cards table at a manageable size, but removing the card from the table does not invalidate it; the smart card can still be used. • Save As button: Saves the entire list of smart cards to a file. The available formats are comma-separated values (.csv) and HTML (.html). • Card Details table: Card details vary based on the card type.
25 Network connections FIGURE 383 Edit Smart Card dialog box 2. Insert the smart card into the card reader. 3. After the card’s ID is displayed by the card reader in the Card ID field, enter the security administrator password used to allow editing of the smart card, then click Login. NOTE The Card Password field is activated after the card ID is read, and the Login button is activated after the password is entered in the Card Password field. 4. Edit the card as needed.
Blade processor links 25 • The management ports on all encryption switches and DCX Backbone Chassis CPs that have Encryption Blades installed must have a LAN connection to the SAN management program, and must be available for discovery. • A supported key management appliance must be connected on the same LAN as the management port, which supports the encryption switches, DCX Backbone Chassis CPs, and the SAN Management program.
25 Encryption node initialization and certificate generation Configuring blade processor links To configure blade processor links, complete the following steps: 1. Select Configure > Encryption from the menu task bar to display the Encryption Center dialog box. (Refer to Figure 376 on page 976.) 2. Select the encryption engine from the Encryption Center Devices table, then select Engine > Blade Processor Link from the menu task bar to display the Blade Processor Link dialog box. (Refer to Figure 384.
Key Management Interoperability Protocol 25 Setting encryption node initialization Encryption nodes are initialized by the Configure Switch Encryption wizard when you confirm a configuration. Encryption nodes may also be initialized from the Encryption Center dialog box. 1. Select a switch from the Encryption Center Devices table, then select Switch > Init Node from the menu task bar. 2. Select Yes after reading the warning message to initialize the node.
25 Key Management Interoperability Protocol Configuration parameters The encryption group object has three additional properties that can be configured when the key vault (KV) type is KMIP. These additional properties must be set by the user: • High availability • User credentials • Certificate type High availability The KMIP Key Authentication Center (KAC) adapter provides configurable HA support. HA for the key vault should be set before you register the key vault.
Key Management Interoperability Protocol 25 Key vault type and vendor The key vault type for any KMIP-compliant key vault is shown on the Brocade Encryption Switchswitch as “KMIP” in the groupcfg output. The key vault vendor or key manager name is displayed under “Server SDK Version”.
25 Supported encryption key manager appliances Authentication Quorum Size: 0 Authentication Cards not configured NODE LIST Total Number of defined nodes: Group Leader Node Name: Encryption Group state: Crypto Device Config state: Encryption Group Config state: 2 10:00:00:05:1e:53:ae:4c CLUSTER_STATE_CONVERGED In Sync In Sync Node Name 10:00:00:05:1e:b6:68:80 EE Slot: SP state: IP address 10.37.36.128 10:00:00:05:1e:53:ae:4c EE Slot: SP state: 10.37.39.
Steps for connecting to a DPM appliance 25 Steps for connecting to a DPM appliance All switches that you plan to include in an encryption group must have a secure connection to the RSA Data Protection Manager (DPM). The following is a suggested order of steps needed to create a secure connection to the DPM. NOTE The Brocade Encryption Switchswitch uses the manual enrollment of identities with client registration to connect with DPM 3.x servers.
25 Steps for connecting to a DPM appliance 4. Do one of the following: • If a CSR is present, click Export. • If a CSR is not present, select a switch from the Encryption Center Devices table, then select Switch > Init Node from the menu task bar. This generates switch security parameters and certificates, including the KAC CSR. 5. Save the file. The default location for the exported file is in the Documents folder. NOTE The CSR is exported in Privacy Enhanced Mail (.pem) format.
Steps for connecting to a DPM appliance 25 In the example above, the certificate validity is active until “Dec 4 18:03:14 2010 GMT.” After the KAC certificate has expired, the registration process must be redone. NOTE In the event that the signed KAC certificate must be re-registered, you will need to log in to the key vault web interface and upload the new signed KAC certificate for the corresponding Brocade Encryption Switchswitch Identity.
25 Steps for connecting to a DPM appliance 6. After the web server restarts, enter the root password. 7. Open another web browser window, and start the RSA management user interface. You will need the URL, and have the proper authority level, user name, and password. NOTE The Identity Group name used in the next step might not exist in a freshly installed DPM. To establish an Identity Group name, click the Identity Group tab, and create a name.
Steps for connecting to a DPM appliance 25 Uploading the KAC certificate onto the DPM appliance (manual identity enrollment) NOTE The Brocade Encryption Switchswitch will not use the Identity Auto Enrollment feature supported with DPM 3.x servers. You must complete the identity enrollment manually to configure the DPM 3.x server with the Brocade Encryption Switchswitch as described in this section. You need to install the switch public key certificate (KAC certificate).
25 Steps for connecting to an LKM/SSKM appliance 1. From the Encryption Center, select a group from the Encryption Center Devices table, then select Group > Properties from the menu task bar to display the Encryption Group Properties dialog box. The General tab is selected. (Refer to Figure 386.) If groups are not visible in the Encryption Devices table, select View > Groups from the menu bar. . FIGURE 386 Encryption Group Properties with Key Vault Certificate 2.
Steps for connecting to an LKM/SSKM appliance 25 • Export and register encryption node certificates on LKM/SSKM. Refer to “Exporting and registering the switch KAC certificates on LKM/SSKM” on page 1003. • If required, create an LKM/SSKM cluster for high availability. Refer to “LKM/SSKM key vault high availability deployment” on page 1003. • Understanding Data Encryption Keys (DEKs). Refer to “Data Encryption Keys” on page 1004.
25 Steps for connecting to an LKM/SSKM appliance 7. Save the TAP to a file (location does not matter). 8. Select the Link Keys tab from the Encryption Group Properties dialog box. 9. Select the switch in the link key status table, then click Accept to retrieve the TAP from the LKM/SSKM appliance. 10. Repeat the above steps for each of the remaining member nodes.
Steps for connecting to an LKM/SSKM appliance 25 Exporting and registering the switch KAC certificates on LKM/SSKM 1. Select Configure > Encryption from the menu task bar to display the Encryption Center dialog box. (Refer to Figure 376 on page 976.) 2. Select a switch from the Encryption Center Devices table, then select Switch > Export Certificate from the menu task bar.
25 Steps for connecting to an LKM/SSKM appliance Regardless of whether you deploy a single LKM/SSKM or clustered dual LKM/SSKMs, register only the primary key vault with the encryption switch or blade. You do not need to register a secondary key vault.
Steps for connecting to an ESKM/SKM appliance 25 LKM/SSKM key vault deregistration Deregistration of either the primary or secondary LKM/SSKM key vault from an encryption switch or blade is allowed independently. • Deregistration of Primary LKM/SSKM: You can deregister the Primary LKM/SSKM from an encryption switch or blade without deregistering the backup or secondary LKM/SSKM for maintenance or replacement purposes.
25 Steps for connecting to an ESKM/SKM appliance • Enable an SSL connection. Refer to “Enabling SSL on the Key Management System (KMS) Server” on page 1011. • Configure a cluster of ESKM/SKM appliances for high availability.
Steps for connecting to an ESKM/SKM appliance 25 Registering the ESKM/SKM Brocade group user name and password The Brocade group user name and password you created when configuring a Brocade group on ESKM/SKM must also be registered on each encryption node. NOTE This operation can be performed only after the switch is added to the encryption group. 1. Select Configure > Encryption from the menu task bar to display the Encryption Center dialog box. (Refer to Figure 376 on page 976.) 2.
25 Steps for connecting to an ESKM/SKM appliance • The same user name and password must be configured on all nodes in an encryption group. This is not enforced or validated by the encryption group members, so use care when configuring the user name and password to ensure they are the same on each node. • Different user names and passwords can never be used within the same encryption group, but each encryption group may have its own user name and password.
Steps for connecting to an ESKM/SKM appliance 25 FIGURE 389 Creating an HP ESKM/SKM local CA 5. Under Certificates & CAs, select Trusted CA Lists to display the Trusted Certificate Authority List Profiles. 6. Click on Default under Profile Name. 7. In the Trusted Certificate Authority List, click Edit. 8. From the list of Available CAs in the right panel, select the CA you just created. Repeat these steps any time another local CA is needed.
25 Steps for connecting to an ESKM/SKM appliance 3. Enter the required information under Create Certificate Request. - Enter a Certificate Name and Common Name. The same name may be used for both. Enter your organizational information. Enter the E-mail Address where you want messages to the Security Officer to go. Enter the Key Size. HP recommends using the default value: 1024. 4. Click Create Certificate Request.
Steps for connecting to an ESKM/SKM appliance 25 Enabling SSL on the Key Management System (KMS) Server The KMS Server provides the interface to the client. Secure Sockets Layer (SSL) must be enabled on the KMS Server before this interface will operate. After SSL is enabled on the first appliance, it will be enabled automatically on the other cluster members. To configure and enable SSL, complete the following steps: 1. Select the Device tab. 2.
25 Steps for connecting to an ESKM/SKM appliance Copying the local CA certificate for a clustered ESKM/SKM appliance Before adding an ESKM/SKM appliance to a cluster, you must obtain the local CA certificate from the original ESKM/SKM or from an ESKM/SKM that is already in the cluster. 1. Select the Security tab. 2. Select Local CAs under Certificates & CAs. 3. Select the name of the local CA from the Local Certificate Authority list. The CA Certificate Information is displayed. 4.
Steps for connecting to an ESKM/SKM appliance 25 14. Enter the original cluster member’s local Port into Cluster Member Port. 15. Click Browse, then select the Cluster Key File you saved. 16. Enter the cluster password, then click Join. 17. After adding all members to the cluster, delete the cluster key file from the desktop. 18. Create and install an ESKM/SKM server certificate. Refer to “Creating and installing the ESKM/SKM server certificate” on page 1009 for a description of this procedure.
25 Steps for connecting to an ESKM/SKM appliance Importing a signed KAC certificate into a switch After a KAC CSR has been submitted and signed by a CA, the signed certificate must be imported into the switch. NOTE This operation can be performed only after the switch is added to the encryption group. 1. Select Configure > Encryption from the menu task bar to display the Encryption Center dialog box. (Refer to Figure 376 on page 976.) 1.
Steps for connecting to an ESKM/SKM appliance 25 Data Encryption Keys The following sections describe Data Encryption Key (DEK) behavior during DEK creation, retrieval, and updates as they relate to disk keys and tape pool keys, and tape LUN and DF-compatible tape pool support: Disk keys and tape pool keys support Data Encryption Key (DEK) creation, retrieval, and update for disk and tape pool keys are as follows: • DEK creation: The DEK is first archived using the session list available for the configu
25 Steps for connecting to a TEKA appliance ESKM/SKM key vault deregistration Deregistration of either the primary or secondary ESKM/SKM key vault from an encryption switch or blade is allowed independently. • Deregistration of primary ESKM: You can deregister the primary ESKM/SKM from an encryption switch or blade without deregistering the backup or secondary ESKM/SKM for maintenance or replacement purposes.
Steps for connecting to a TEKA appliance 25 Setting up TEKA network connections Communicating to TEKA is enabled over an SSL connection. Two IP addresses are needed. One IP address is used for the management interface, and a second IP address is used for communication with clients. These IP addresses are typically assigned during the initial setup of the TEKA appliance. 1. Log in to the Thales management program as admin and select the Network tab. (Refer to Figure 391.
25 Steps for connecting to a TEKA appliance Creating a client on TEKA This step assumes the group brocade has been created by an administrator. If the group brocade does not exist, you must log in to TEKA as officer and create the group, then assign the group to a manager. 1. From the Encryption Center Devices table, select a switch that needs to have a TEKA client, then select Properties. 2. Click Key Vault User Name. The Key Vault User Information dialog box displays. (Refer to Figure 392.
Steps for connecting to a TEKA appliance 25 6. Click Add Client. 7. Enter the user name from step 3 in the Name field. 8. Enter a password in the Password and Verify Password fields. 9. Select the group brocade from the group pull-down menu, then click Add Client. A TEKA client user is created and is listed in the table. Establishing TEKA key vault credentials on the switch The credentials established for the TEKA client must be presented to TEKA by the Brocade Encryption Switchswitch.
25 Steps for connecting to a TEKA appliance The following rules apply for TEKA: • The key vault user name and user group name are generated on the switch. To view those values, select Switch > Properties, then click Key Vault User Name. • The generated user name and user group name are registered with TEKA and are used for administering TEKA clients. • The password is established when the TEKA client is created.
Steps for connecting to a TKLM appliance 25 FIGURE 395 Import Signed Certificate dialog box 2. Browse to the location where the signed certificate is stored, then click OK. The signed certificate is stored on the switch. Steps for connecting to a TKLM appliance All switches you plan to include in an encryption group must have a secure connection to the Tivoli Key Lifecycle Manager (TKLM). A local LINUX host must be available to transfer certificates.
25 Steps for connecting to a TKLM appliance 11. Import the server CA certificate and register TKLM on the encryption Group Leader nodes. Refer to “Importing the TKLM certificate into the group leader” on page 1024. 12. Enable the encryption engines. Exporting the Fabric OS node self-signed KAC certificates Each Fabric OS node generates a self-signed KAC certificate as part of the node initialization process as described under “Encryption node initialization and certificate generation”.
Steps for connecting to a TKLM appliance 25 The Configure Keys page displays. This page identifies this step as Step Two: Identify Drives. 3. Click Add on the Devices table menu task bar, which adds the entry to the table. 4. Under Device Serial Number, enter the serial number that is displayed for each node that you are adding to the device group.
25 Steps for connecting to a TKLM appliance Exporting the TKLM self-signed server certificate The TKLM self-signed server certificate must be exported in preparation for importing and registering the certificate on a Fabric OS encryption Group Leader node. 1. Enter the TKLM server wsadmin CLI. For Linux (in ./wsadmin.sh): /IBM/tivoli/tiptklmV2/bin/wsadmin.sh -username TKLMAdmin -password -lang jython For Windows: \ibm\tivoli\tiptklmV2\bin\wsadmin.
Steps for connecting to a KMIP-compliant SafeNet KeySecure 25 FIGURE 396 Import Signed Certificate dialog box 3. Browse to the location where the signed certificate is stored, then click OK. The signed certificate is stored on the switch. Steps for connecting to a KMIP-compliant SafeNet KeySecure With the introduction of Fabric OS 7.1.0, the Key Management Interoperability Protocol (KMIP) KeySecure Management Console can be used on the Brocade Encryption Switchswitch.
25 Steps for connecting to a KMIP-compliant SafeNet KeySecure 10. Configure the KMIP server. (Refer to “Configuring the KMIP server” on page 1041.) 11. Add a secondary node to the cluster. (Refer to “Adding a node to the cluster” on page 1042.) Setting FIPS compliance 1. From the KeySecure Management Console, select the Security tab, then select Advanced Security, > High Security. The High Security Configuration page displays. (Refer to Figure 397.
Steps for connecting to a KMIP-compliant SafeNet KeySecure 25 Creating a local CA 1. From the KeySecure Management Console, select the Security tab, then select CAs & SSL Certificates > Local CAs. The Certificate and CA Configuration page displays. (Refer to Figure 398.) FIGURE 398 KeySecure Certificate and CA Configuration page - Create Local Certificate Authority 2. Under Create Local Certificate Authority, enter the organization information in the fields provided, then click Create.
25 Steps for connecting to a KMIP-compliant SafeNet KeySecure Creating a server certificate 1. From the Security tab, select CAs & SSL Certificates > SSL Certificates. The Certificate and CA Configuration page displays. (Refer to Figure 400.) FIGURE 400 KeySecure Certificate and CA Configuration page 2. Under Create Certificate Request, enter your organization information in the fields provided, then click Create Certificate Request.
Steps for connecting to a KMIP-compliant SafeNet KeySecure 25 FIGURE 401 KeySecure Certificate and CA Configuration page - Certificate List 3. Verify the server certificate status is shown as Request Pending. 4. Click on the server certificate name that you just created (Safenet75ServerCert), which displays the certificate contents. (Refer to Figure 402.
25 Steps for connecting to a KMIP-compliant SafeNet KeySecure 5. Copy the certificate contents. 6. From the Security tab, select CAs & SSL Certificates > Local CAs. The Certificate and CA Configuration page displays. 7. Under Local Certificate Authority List, select the CA certificate you just created (SafeNetCA), then click Sign Request. (Refer to Figure 403.) FIGURE 403 KeySecure Certificate and CA Configuration page - Local Certificate Authority List The Sign Certificate Request dialog box displays.
Steps for connecting to a KMIP-compliant SafeNet KeySecure 25 8. Select Server as the Certificate Purpose and verify the Certificate Duration length. The default is 3649 days. 9. Paste the server certificate contents that you copied (refer to step 5) in the Certificate Request text box, then click Sign Request. The Certificate and CA Configuration page refreshes and the certificate information is displayed under Certificate Request Information. (Refer to Figure 405.
25 Steps for connecting to a KMIP-compliant SafeNet KeySecure FIGURE 406 KeySecure Certificate and CA Configuration page - Certificate Installation 14. After the page refreshes, the new certificate information is displayed in the Certificate List table. (Refer to Figure 407.) FIGURE 407 KeySecure Certificate and CA Configuration page - Certificate List 15. Verify the server certificate status is shown as Active.
Steps for connecting to a KMIP-compliant SafeNet KeySecure 25 Creating a cluster 1. From the KeySecure Management Console, select the Device tab, then select Device Configuration > Cluster. The Cluster Configuration page displays. (Refer to Figure 408.) FIGURE 408 KeySecure Cluster Configuration page 2. Under Create Cluster, enter a user-defined password in the fields provided, then click Create. The Cluster Configuration page refreshes; the new cluster information is listed in the Cluster Members table.
25 Steps for connecting to a KMIP-compliant SafeNet KeySecure FIGURE 409 KeySecure Cluster Configuration page - Cluster Members 4. Under Cluster Settings, click Download Cluster Key. (Refer to Figure 410.) You are prompted to enter a local file name. FIGURE 410 KeySecure Cluster Configuration page - Cluster Settings Configuring a Brocade group on the KeySecure A Brocade group is configured on the KeySecure for all keys created by encryption switches and blades.
Steps for connecting to a KMIP-compliant SafeNet KeySecure 25 3. Select Local Users & Groups under Users & Groups. 4. Select Add under Local Users. 5. Create a Brocade user name and password. 6. Select the User Administration Permission and Change Password Permission check boxes, then click Save. 7. Select Add under Local Groups. 8. Add a Brocade group under Group, then click Save. 9. Select the new Brocade group name, then select Properties. The Local Group Properties and a User List are displayed.
25 Steps for connecting to a KMIP-compliant SafeNet KeySecure FIGURE 412 Key Vault Credentials dialog box The dialog box contains the following information: • Primary Key Vault: Primary Key Vault is preselected. KMIP key vaults are clustered, so only one set of credentials is needed. • • • • • Secondary Key Vault: (TEKA key vault only). Shown as inactive. User Name: Enter a user name for the group leader. User Group Name: Displays the selected User Group Name.
Steps for connecting to a KMIP-compliant SafeNet KeySecure 25 6. The Certificate and CA Configuration page displays. 7. Under Local Certificate Authority List, select the local CA name, and verify that its CA Status is shown as Active. 8. Click Sign Request. The Sign Certificate Request page displays. (Refer to Figure 413.) FIGURE 413 Certificate and CA Configuration page - Sign Certificate Request 9. Select the local CA from the Sign with Certificate Authority drop-down list.
25 Steps for connecting to a KMIP-compliant SafeNet KeySecure Importing a signed KAC certificate into a switch After a KAC CSR has been submitted and signed by a CA, the signed certificate must be imported into the switch. NOTE This operation can be performed only after the switch is added to the encryption group. 1. Select Configure > Encryption from the menu task bar to display the Encryption Center dialog box. (Refer to Figure 376 on page 976.) 2.
Steps for connecting to a KMIP-compliant SafeNet KeySecure 25 Backing up the certificates 1. From the KeySecure Management Console, select the Device tab, then select Maintenance > Backup & Restore > Create Backup. The Backup and Restore page displays. (Refer to Figure 415.) FIGURE 415 Backup and Restore page 2. Select the server certificate from the list. The example is using Safenet75ServerReq. 3. Select the local CA from the list. The example is using SafeNetCA. 4.
25 Steps for connecting to a KMIP-compliant SafeNet KeySecure FIGURE 416 Backup and Restore page - Device items 5. Select the items for backup, then click Continue. The Create Backup page displays, which is used for setting backup details. (Refer to Figure 417.) FIGURE 417 Backup and Restore page - Backup details 6. Enter backup details in the fields provided, then click Backup to initiate the backup process. 7. 1040 Restore this backup file on the Secondary clustered KeySecure server.
Steps for connecting to a KMIP-compliant SafeNet KeySecure 25 Configuring the KMIP server 1. From the KeySecure Management Console, select the Device tab, then select Device Configuration > Key Server > Key Server. The Cryptographic Key Server Configuration page displays. (Refer to Figure 418.) FIGURE 418 KeySecure Cryptographic Key Server Configuration page 2. Under Cryptographic Key Server Settings, select KMIP as the protocol. 3. Ensure that the Use SSL check box is selected. 4.
25 Steps for connecting to a KMIP-compliant SafeNet KeySecure Adding a node to the cluster Perform the following steps on the secondary KeySecure node when adding it to the cluster. 1. From the KeySecure Management Console, select the Device tab, then select Device Configuration > Cluster. The Cluster Configuration page displays. (Refer to Figure 419.) FIGURE 419 KeySecure Cluster Configuration page 2. Under Join Cluster, enter the cluster information that you configured for the primary KeySecure node.
Steps for connecting to a KMIP-compliant SafeNet KeySecure 25 FIGURE 420 KeySecure Cluster Configuration page - Cluster Members 6. Verify that both KeySecure nodes are shown as Active. 7. From the Devices tab, select Maintenance > Backup and Restore > Restore Backup. The Backup and Restore page displays. (Refer to Figure 421.
25 Steps for connecting to a KMIP-compliant keyAuthority 8. Under Restore Backup, select Upload from browser, then enter a file name or browse to the file location. 9. Enter the Backup Password in the field provided, then click Restore. 10. After the certificate is restored to the secondary node from the previously backed-up primary node, select Maintenance > Services. The Services Configuration page displays. (Refer to Figure 422.
Encryption preparation 25 Encryption preparation Before you use the encryption setup wizard for the first time, you should have a detailed configuration plan in place and available for reference. The encryption setup wizard assumes the following: • You have a plan in place to organize encryption devices into encryption groups.
25 Creating a new encryption group 2. Select a switch from the encryption group. (The switch must not be assigned to an encryption group.) 3. Select Encryption > Create/Add to Group, from the menu task bar. The Configure Switch Encryption wizard welcome screen displays. (Refer to Figure 424.) The wizard enables you to create a new encryption group, or add an encryption switch to an existing encryption group. The wizard also enables you to configure switch encryption.
Creating a new encryption group 25 FIGURE 425 Designate Switch Membership dialog box 5. For this procedure, verify that Create a new encryption group containing just this switch is selected, then click Next. NOTE If you are adding a switch to an encryption, refer to “Adding a switch to an encryption group” on page 1083. The Create a New Encryption Group dialog box displays. (Refer to Figure 426.
25 Creating a new encryption group The dialog box contains the following information: • Encryption Group Name text box: Encryption group names can have up to 15 characters. Letters, digits, and underscores are allowed. The group name is case-sensitive. • Failback mode: Selects whether or not storage targets should be automatically transferred back to an encryption engine that comes online after being unavailable. Options are Automatic or Manual.
Creating a new encryption group 25 Using this dialog box, you can select a key vault for the encryption group that contains the selected switch. Prior to selecting your Key Vault Type, the selection is shown as None. The dialog box contains the following information: • Key Vault Type: If an encryption group contains mixed firmware nodes, the Encryption Group Properties Key Vault Type name is based on the firmware version of the Group Leader.
25 Creating a new encryption group • Password: The key vault password. This field is active for ESKM/SKM and TEKA key vaults. For ESKM/SKM, it is needed only for the primary key vault. For TEKA, it is needed for both the primary and secondary key vaults. • Re-type Password: Re-enter the password for verification. • Backup Key Vault: (Optional.) The secondary key vault, either an IPv4 address or Host name. The backup address can be left blank. • Backup Certificate File: (Optional.
Creating a new encryption group 25 FIGURE 428 Select Key Vault dialog box for DPM 1. Enter the IP address or host name for the primary key vault. If you are clustering DPM appliances for high availability, IP load balancers are used to direct traffic to the appliances. Use the IP address of the load balancer. 2. Enter the name of the file that holds the Primary Key Vault’s CA Key Certificate or browse to the desired location. This file can be generated from the key vault’s administrative console. 3.
25 Creating a new encryption group FIGURE 429 Specify Certificate Signing Request File Name dialog box 5. Enter the filename in which you want to store the certificate information, or browse to the file location. The certificate stored in this file is the switch’s Switch Certificate Signing file. You will need to know this path and file name to install the switch’s Switch Certificate Signing file on the key management appliance. 6. Click Next. The Specify Master Key File Name dialog box displays.
Creating a new encryption group 25 FIGURE 430 Specify Master Key File Name dialog box 7. Enter the location of the file where you want to store back up master key information, or browse to the desired location. 8. Enter the passphrase, which is required for restoring the master key. The passphrase can be between eight and 40 characters, and any character is allowed. 9. Re-enter the passphrase for verification, then click Next. The Select Security Settings dialog box displays. (Refer to Figure 431.
25 Creating a new encryption group FIGURE 431 Select Security Settings dialog box 10. Set quorum size and system card requirements. The quorum size is the minimum number of cards necessary to enable the card holders to perform the security sensitive operations listed above. The maximum quorum size is five cards.
Creating a new encryption group 25 FIGURE 432 Confirm Configuration dialog box The Configuration Status dialog box displays. (Refer to Figure 433.) FIGURE 433 Configuration Status dialog box 12. Review the post-configuration instructions, which you can copy to a clipboard or print for later, then click Next. The Next Steps dialog box displays. (Refer to Figure 434.) Instructions for installing public key certificates for the encryption switch are displayed.
25 Creating a new encryption group FIGURE 434 Next Steps dialog box 13. Review the post-configuration instructions, which you can copy to a clipboard or print for later, then click Finish to exit the wizard. Configuring key vault settings for NetApp Link Key Manager (LKM/SSKM) The following procedure assumes you have already configured the initial steps in the Configure Switch Encryption wizard. If you have not already done so, go to “Creating a new encryption group” on page 1045.
Creating a new encryption group 25 FIGURE 435 Select Key Vault dialog box for LKM/SSKM 1. Enter the IP address or host name for the primary key vault. 2. Enter the name of the file that holds the primary key vault’s public key certificate, or browse to the desired location. 3. If you are using a backup key vault, enter the IP address or host name, and the name of the file holding the backup key vault’s public key certificate, then click Next.
25 Creating a new encryption group FIGURE 436 Specify Public Key Certificate (KAC) File Name dialog box 4. Specify the location of the file where you want to store the public key certificate that is used to authenticate connections to the key vault. The certificate stored in this file is the switch’s public key certificate. You will need to know this path and file name to install the switch’s public key certificate on the key management appliance. 5. Click Next.
Creating a new encryption group 25 FIGURE 437 Select Security Settings dialog box 6. Set quorum size and system card requirements. The quorum size is the minimum number of cards necessary to enable the card holders to perform the security sensitive operations listed above. The maximum quorum size is five cards.
25 Creating a new encryption group FIGURE 438 Confirm Configuration dialog box The Configuration Status dialog box displays. (Refer to Figure 439.) FIGURE 439 Configuration Status dialog box All configuration items have green check marks if the configuration is successful. A red stop sign indicates a failed step. A message displays below the table, indicating the encryption switch was added to the group you named, and the public key certificate is stored in the location you specified.
Creating a new encryption group 25 After configuration of the encryption group is completed, BNAthe Management application sends API commands to verify the switch configuration. See “Understanding configuration status results” on page 1082 for more information. 8. Verify the information is correct, then click Next. The Next Steps dialog box displays. (Refer to Figure 440.) Instructions for installing public key certificates for the encryption switch are displayed.
25 Creating a new encryption group Configuring key vault settings for HP Enterprise Secure Key Manager (ESKM/SKM) The following procedure assumes you have already configured the initial steps in the Configure Switch Encryption wizard. If you have not already done so, go to “Creating a new encryption group” on page 1045. Figure 441 shows the key vault selection dialog box for ESKM/SKM. FIGURE 441 Select Key Vault dialog box for ESKM/SKM 1. Enter the IP address or host name for the primary key vault. 2.
Creating a new encryption group 25 FIGURE 442 Specify Certificate Signing Request File Name dialog box 6. Enter the location of the file where you want to store the certificate information, or browse to the desired location, then click Next. The Specify Master Key File Name dialog box displays. (Refer to Figure 443.) FIGURE 443 Specify Master Key File Name dialog box 7. Enter the passphrase, which is required for restoring the master key.
25 Creating a new encryption group 8. Re-enter the passphrase for verification, then click Next. The Select Security Settings dialog box displays. (Refer to Figure 444.) FIGURE 444 Select Security Settings dialog box 9. Set quorum size and system card requirements. The quorum size is the minimum number of cards necessary to enable the card holders to perform the security sensitive operations listed above. The maximum quorum size is five cards.
Creating a new encryption group 25 FIGURE 445 Confirm Configuration dialog box The Configuration Status dialog box displays. (Refer to Figure 446.) FIGURE 446 Configuration Status dialog box All configuration items have green check marks if the configuration is successful. A red stop sign indicates a failed step. A message displays below the table, indicating the encryption switch was added to the group you named, and the public key certificate is stored in the location you specified.
25 Creating a new encryption group After configuration of the encryption group is completed, BNAthe Management application sends API commands to verify the switch configuration. See “Understanding configuration status results” on page 1082 for more information. 11. Review important messages, then click Next. The Next Steps dialog box displays. (Refer to Figure 447.) Instructions for installing public key certificates for the encryption switch are displayed. FIGURE 447 Next Steps dialog box 12.
Creating a new encryption group 25 FIGURE 448 Select Key Vault dialog box for TEKA 1. Enter the IP address or host name for the primary key vault. 2. Enter the name of the file that holds the primary key vault’s public key certificate, or browse to the desired location. 3. Enter the password you created for the Brocade group TEKA client. 4.
25 Creating a new encryption group FIGURE 449 Specify Master Key File Name dialog box 6. Enter the name of the file used for backing up the master key or browse to the desired location. 7. Enter the passphrase, which is required for restoring the master key. The passphrase can be between eight and 40 characters, and any character is allowed. 8. Re-enter the passphrase for verification, then click Next. The Select Security Settings dialog box displays. (Refer to Figure 450.
Creating a new encryption group 25 9. Set quorum size and system card requirements. The quorum size is the minimum number of cards necessary to enable the card holders to perform the security sensitive operations listed above. The maximum quorum size is five cards. The actual number of authentication cards registered is always more than the quorum size, so if you set the quorum size to five, for example, you will need to register at least six cards in the subsequent steps.
25 Creating a new encryption group FIGURE 452 Configuration Status dialog box All configuration items have green check marks if the configuration is successful. A red stop sign indicates a failed step. A message displays below the table, indicating the encryption switch was added to the group you named, and the public key certificate is stored in the location you specified.
Creating a new encryption group 25 FIGURE 453 Next Steps dialog box 12. Review the post-configuration instructions, which you can copy to a clipboard or print for later. 13. Click Finish to exit the Configure Switch Encryption wizard. 14. Refer to “Understanding configuration status results” on page 1082. Configuring key vault settings for IBM Tivoli Key Lifetime Manager (TKLM) The following procedure assumes you have already configured the initial steps in the Configure Switch Encryption wizard.
25 Creating a new encryption group FIGURE 454 Select Key Vault dialog box for TKLM 1. Enter the IP address or host name for the primary key vault. 2. Enter the name of the file that holds the primary key vault’s public key certificate or browse to the desired location. 3. If you are using a backup key vault, enter the IP address or host name, and the name of the file holding the backup key vault’s public key certificate in the fields provided. 4. Click Next.
Creating a new encryption group 25 FIGURE 455 Specify Public Key Certificate (KAC) File Name dialog box 5. Enter the name of the file where the switch’s public key certificate is stored, or browse to the desired location, then click Next. The Specify Master Key File Name dialog box displays. (Refer to Figure 456.) FIGURE 456 Specify Master Key File Name dialog box 6. Enter the name of the file used for backing up the master key, or browse to the desired location.
25 Creating a new encryption group 7. Enter the passphrase, which is required for restoring the master key. The passphrase can be between eight and 40 characters, and any character is allowed. 8. Re-enter the passphrase for verification, then click Next. The Select Security Settings dialog box displays. (Refer to Figure 457.) FIGURE 457 Select Security Settings dialog box 9. Set quorum size and system card requirements.
Creating a new encryption group 25 FIGURE 458 Confirm Configuration dialog box The Configuration Status dialog box displays. (Refer to Figure 459.) FIGURE 459 Configuration Status dialog box All configuration items have green check marks if the configuration is successful. A red stop sign indicates a failed step. A message displays below the table, indicating the encryption switch was added to the group you named, and the public key certificate is stored in the location you specified.
25 Creating a new encryption group After configuration of the encryption group is completed, BNAthe Management application sends API commands to verify the switch configuration. 11. Click Next. The Next Steps dialog box displays. (Refer to Figure 460.) Instructions for installing public key certificates for the encryption switch are displayed. These instructions are specific to the key vault type. FIGURE 460 Next Steps dialog box 12.
Creating a new encryption group 25 • With the introduction of Fabric OS 7.2.0, KMIP with TEKA 4.0 is also supported, but must be configured using the CLI. All nodes in a keyAuthority encryption group must be running Fabric OS 7.2.0 or later. For configuration instructions, refer to the Fabric OS Encryption Administrator’s Guide Supporting Key Management Interoperability Protocol (KMIP) Key-Compliant Environments. Figure 461 shows the key vault selection dialog box for KMIP.
25 Creating a new encryption group • Username: Activates the Primary and Backup Key Vault User Names for completion. • None: Deactivates Primary and Backup Key Vault User Names and password fields. 6. Select the Certificate Type. Options are: • CA Signed: The Brocade Encryption Switchswitch KAC certificate is signed by a CA, imported back on the Brocade Encryption Switchswitch and registered as a KAC certificate. The CA will be registered as a key vault certificate on the Brocade Encryption Switchswitch.
Creating a new encryption group 25 FIGURE 463 Specify Master Key File Name dialog box 9. Enter the name of the file used for backing up the master key, or browse to the desired location. 10. Enter the passphrase, which is required for restoring the master key. The passphrase can be between eight and 40 characters, and any character is allowed. 11. Re-enter the passphrase for verification, then click Next. The Select Security Settings dialog box displays. (Refer to Figure 464.
25 Creating a new encryption group FIGURE 464 Select Security Settings dialog box 12. Set quorum size and system card requirements. The quorum size is the minimum number of cards necessary to enable the card holders to perform the security sensitive operations listed above. The maximum quorum size is five cards.
Creating a new encryption group 25 FIGURE 465 Confirm Configuration dialog box 14. Confirm the encryption group name and switch public key certificate file name you specified are correct, then click Next. The Configuration Status dialog box displays. (Refer to Figure 466.
25 Creating a new encryption group All configuration items have green check marks if the configuration is successful. A red stop sign indicates a failed step. A message displays below the table, indicating the encryption switch was added to the group you named, and the public key certificate is stored in the location you specified. After configuration of the encryption group is completed, BNAthe Management application sends API commands to verify the switch configuration. 15. Click Next.
Adding a switch to an encryption group 25 3. Register the key vault. BNAThe Management application registers the key vault using the cryptocfg --reg keyvault command. 4. Enable the encryption engines. BNAThe Management application initializes an encryption switch using the cryptocfg --initEE [] and cryptocfg --regEE [] commands. 5. Create a new master key. (Opaque key vaults only). BNAThe Management application checks for a new master key.
25 Adding a switch to an encryption group FIGURE 468 Configure Switch Encryption wizard - welcome screen 3. Click Next. The Designate Switch Membership dialog box displays. (Refer to Figure 469.) FIGURE 469 Designate Switch Membership dialog box 4. For this procedure, select Add this switch to an existing encryption group, then click Next. The Add Switch to Existing Encryption Group dialog box displays. (Refer to Figure 470.
Adding a switch to an encryption group 25 The dialog box contains the following information: • Encryption Groups table: Enables you to select an encryption group in which to add a switch. • Member Switches table: Lists the switches in the selected encryption group. NOTE If you are creating a new encryption group, refer to “Creating a new encryption group” on page 1045. FIGURE 470 Add Switch to Existing Encryption Group dialog box 5. Select the group in which to add the switch, then click Next.
25 Adding a switch to an encryption group FIGURE 471 Specify Public Key Certificate (KAC) File Name dialog box 6. Enter the location where you want to store the public key certificate that is used to authenticate connections to the key vault, or browse to the desired location, then click Next. The Confirm Configuration dialog box displays. (Refer to Figure 472.) Confirm the encryption group name and switch public key certificate file name you specified are correct, then click Next.
Adding a switch to an encryption group 25 The Configuration Status dialog box displays. (Refer to Figure 473.) FIGURE 473 Configuration Status dialog box All configuration items have green check marks if the configuration is successful. A red stop sign indicates a failed step. A message displays below the table, indicating the encryption switch was added to the group you named, and the public key certificate is stored in the location you specified. 7. Review important messages, then click Next.
25 Replacing an encryption engine in an encryption group FIGURE 474 Error Instructions dialog box 8. Review the post-configuration instructions, which you can copy to a clipboard or print for later. 9. Click Finish to exit the Configure Switch Encryption wizard. Replacing an encryption engine in an encryption group To replace an encryption engine in an encryption group with another encryption engine within the same DEK Cluster, complete the following steps: 1.
High availability clusters 25 FIGURE 475 Engine Operations tab 3. Select the engine to replace from the Engine list. 4. Select the engine to use as the replacement from the Replacement list, then click Replace. All containers hosted by the current engine (Engine list) are replaced by the new engine (Replacement list).
25 High availability clusters • The encryption engines that are part of an HA cluster must belong to the same encryption group and be part of the same fabric. • An HA cluster cannot span fabrics and it cannot provide failover/failback capability within a fabric transparent to host MPIO software. • HA cluster configuration and related operations must be performed on the group leader. • HA clusters of FS8-18 blades should not include blades in the same DCX Backbone chassis. NOTE In Fabric OS 6.3.
High availability clusters 25 FIGURE 476 Encryption Group Properties dialog box - HA Clusters tab To add the second encryption node to the HA cluster, perform the following procedure. 1. Select the desired HA cluster from the right panel. 2. Select the desired encryption engine to be added from the left panel. 3. Click the right arrow to add the encryption engine to the selected HA cluster. 4. Click OK.
25 High availability clusters Swapping engines in an HA cluster Swapping engines is useful when replacing hardware. Swapping engines is different from removing an engine and adding another because when you swap engines, the configured targets on the former HA cluster member are moved to the new HA cluster member. 1. Select Configure > Encryption from the menu task bar to display the Encryption Center dialog box. 2.
Configuring encryption storage targets 25 Configuring encryption storage targets Adding an encryption target maps storage devices and hosts to virtual targets and virtual initiators within the encryption switch. The storage encryption wizard enables you to configure encryption for a storage device (target). NOTE It is recommended that you configure the host and target in the same zone before configuring them for encryption.
25 Configuring encryption storage targets FIGURE 477 Encryption Targets dialog box 3. Click Add. The Configure Storage Encryption wizard welcome screen displays. (Refer to Figure 478.) FIGURE 478 Configure Storage Encryption wizard - welcome screen 4. Click Next. The Select Encryption Engine dialog box displays. (Refer to Figure 479.
Configuring encryption storage targets 25 FIGURE 479 Select Encryption Engine dialog box The dialog box contains the following information: • Encryption engine: The name of the encryption engine. The list of engines depends on the scope being viewed: - If an encryption group was selected, the list includes all engines in the group. If a switch was selected, the list includes all encryption engines for the switch. If a single encryption engine was selected, the list contains only that engine.
25 Configuring encryption storage targets FIGURE 480 Select Target dialog box The dialog box contains the following information: • Target Port WWN: The world wide name of the target port in the same fabric as the encryption engine. • Target Port Name: The name of the target port in the same fabric as the encryption engine. • Target Node WWN: The world wide name of the target node in the same fabric as the encryption engine. • Target Node Name: The name of the target device.
Configuring encryption storage targets 25 FIGURE 481 Select Hosts dialog box The dialog box contains the following information: • Hosts in Fabric table: Lists the available hosts in the fabric. • Selected Hosts table: Lists the hosts that have been selected to access the target. • Port WWN: The world wide name of the host ports that are in the same fabric as the encryption engine. • Node WWN: The world wide name of the host nodes that are in the same fabric as the encryption engine.
25 Configuring encryption storage targets • Right arrow button: Moves a host from the Host in Fabric table to the Selected Hosts table. • Left arrow button: Removes a host from the Selected Hosts table. • Add button: Click to manually add host port world wide names or host node world wide names to the Selected Hosts table. 8. Select hosts using either of the following methods: a.
Configuring encryption storage targets 25 FIGURE 483 Confirmation screen The Confirmation screen contains the following information: • Encryption Engine: The slot location of the encryption engine. • Container Name: The logical encryption name used to map storage targets and hosts to virtual targets and virtual initiators. • • • • Target Device Port: The world wide name of the target device port. Host Node WWN: The world wide name of the host node. Host Port WWN: The world wide name of the host port.
25 Configuring encryption storage targets FIGURE 484 Configuration Status screen The screen contains the following information: • Device: The device type (target or host). • Device Port WWN: The port world wide name. • Represented by VI/VT: The virtual target (VT) mapped to the physical target or virtual initiator (VI) representing the host. • VI/VT Port WWN: The port world wide name of the virtual target or virtual initiator.
Configuring hosts for encryption targets 25 FIGURE 485 Next Steps screen The Next Steps screen contains the following information: • Important Instructions: Instructions about post-configuration tasks you must complete after you close the wizard. For example, you must zone the physical hosts and the target together and then you encrypt the LUNs using the Storage Device LUNs dialog box. • Copy to Clipboard button: Saves a copy of the instructions. • Print button: Prints the configuration. 14.
25 Configuring hosts for encryption targets NOTE You can also select a group, switch, or engine from the Encryption Center Devices table, then click the Targets icon. The Encryption Targets dialog box displays. (Refer to Figure 486.) FIGURE 486 Encryption Targets dialog box 3. Select a target storage device from the list, then click Hosts. The Encryption Target Hosts dialog box displays. (Refer to Figure 487.) The Hosts in Fabric table lists the configured hosts in a fabric.
Adding target disk LUNs for encryption 25 NOTE Both the Hosts in Fabric table and the Selected Hosts table now contain a Port ID column to display the 24-bit PID of the host port. 4. Select one or more hosts in a fabric using either of the following methods: a. Select a maximum of 1024 hosts from the Hosts in Fabric table, then click the right arrow to move the hosts to the Selected Hosts table. (The Port WWN column contains all target information that displays when using the nsShow command.) b.
25 Adding target disk LUNs for encryption The Encryption Disk LUN View dialog box displays. (Refer to Figure 488.) FIGURE 488 Encryption Disk LUN View dialog box The dialog box provides a convenient way to view and manage disk LUNs that are provisioned from different hosts, identify conflicts between configuration policies on storage systems, and to provide a launching point for the Add New Path wizard for configuring multiple I/O paths to the LUN.
Adding target disk LUNs for encryption 25 FIGURE 489 Select Target Port dialog box The dialog box is used to select a target port when configuring multiple I/O paths to a disk LUN. The dialog box contains the following information: • Storage Array: The storage array selected from the LUN view prior to launching the Add New Path wizard. • Host: The host selected from the LUN view prior to launching the Add New Path wizard.
25 Adding target disk LUNs for encryption The dialog box is used to select an initiator port when configuring multiple I/O paths to a disk LUN. The dialog box contains the following information: • Storage Array: Displays the storage array that was selected from the LUN view prior to launching the wizard. • Host: The host selected from the LUN view prior to launching the wizard.
Adding target disk LUNs for encryption 25 • LUN table: Available LUNs identified by the following: - Host - LUN Number - LUN Serial Number - Current LUN State: Options are Encrypted, which is automatically selected if the LUN has a key ID; Clear Text, and
25 Adding target disk LUNs for encryption FIGURE 492 Correcting an encryption mode mismatch When you correct a policy on a LUN, it is automatically selected for all paths to the selected LUN. When you modify LUN policies, a Modify icon displays to identify the modified LUN entry. 11. Click OK or Apply to apply the changes. Configuring storage arrays The storage array contains a list of storage ports that will be used later in the LUN centric view.
Adding target disk LUNs for encryption 25 SRDF supports the following methods of data replication: • Synchronous Replication provides real-time mirroring of data between the source Symmetrix and the target Symmetrix systems. Data is written simultaneously to the cache of both systems in real time before the application I/O is completed, thus ensuring the highest possible data availability.
25 Adding target disk LUNs for encryption FIGURE 493 Basic SRDF configuration with encryption switches Metadata requirements and remote replication When the metadata and key ID are written, the primary metadata on blocks 1–16 is compressed and encrypted. However, there are scenarios whereby these blocks cannot be compressed, and the metadata is not written to the media.
Adding target tape LUNs for encryption 25 • The New LUN option can be used only if replication is enabled for the encryption group. • If the local LUN contains host data, configuring it with the New LUN option will cause the data on the last three blocks of the LUN to be lost. Before using the New LUN option, you must migrate the contents of the LUN to another LUN that is larger by at least three blocks. The new, larger LUN can then be used when creating the SRDF pair.
25 Adding target tape LUNs for encryption FIGURE 495 Encryption Target Tape LUNs dialog box 4. Click Add. The Add Encryption Target Tape LUNs dialog box displays. (Refer to Figure 496.) A table of all LUNs in the storage device that are visible to hosts is displayed. LUNs are identified by the Host world wide name, LUN number, Volume Label Prefix number, and Enable Write Early ACK and Enable Read Ahead status. The LUN numbers may be different for different hosts.
Adding target tape LUNs for encryption 25 When you select a specific host, only the LUNs visible to that host are displayed. If you select All Hosts, LUNs visible to all configured hosts are displayed. If a LUN is visible to multiple hosts, it is listed once for each host. 6. Choose a LUN to be added to an encryption target container using one of the two following methods: • Discover: Identifies the exposed logical unit number for a specified initiator.
25 Moving targets Moving targets The Move Targets dialog box is used to redistribute which engine encrypts which targets. It is also useful for transferring all targets to another engine before replacing or removing engine hardware. Moving targets to another engine may be done while traffic is flowing between the host and target. Traffic is interrupted for a short time but resumes before the host applications are affected. 1. Select Configure > Encryption. The Encryption Center dialog box displays. 2.
Tape LUN write early and read ahead 25 8. In the Encryption Targets dialog box, select Target Port A, click LUNs, then click Add. Select the LUNs to be encrypted and the encryption policies for the LUNs. 9. In the Encryption Targets dialog box, select Target Port B, click LUNs, then click Add. Select the LUNs to be encrypted and the encryption policies for the LUNs, making sure that the encryption policies match the policies specified in the other path. 10.
25 Tape LUN write early and read ahead FIGURE 497 Encryption Targets dialog box 3. Select a target tape storage device from the table, then click LUNs. The Encryption Target Tape LUNs dialog box displays. (Refer to Figure 498.) FIGURE 498 Encryption Target Tape LUNs dialog box - Setting tape LUN read ahead and write early 4.
Tape LUN statistics 25 NOTE You can also select a group, switch, or engine from the Encryption Center Devices table, then click the Targets icon. c. Select the appropriate crypto target container, then click Commit. Tape LUN statistics This feature enables you to view and clear statistics for tape LUNs. These statistics include the number of compressed blocks, uncompressed blocks, compressed bytes and uncompressed bytes written to a tape LUN.
25 Tape LUN statistics FIGURE 500 Tape LUN Statistics dialog box The dialog box contains the following information: • LUN #: The number of the logical unit for which statics are displayed. • Tape Volume/Pool: The tape volume label of the currently-mounted tape, if a tape session is currently in progress. • • • • • • • • Tape Session #: The number of the ongoing tape session. Uncompressed blocks: The number of uncompressed blocks written to tape.
Tape LUN statistics 25 The Encryption Targets dialog box displays. (Refer to Figure 497.) 3. Select a tape target storage device, then click LUNs. The Target Tape LUNs dialog box displays. (Refer to Figure 501.) A list of the configured tape LUNs is displayed. FIGURE 501 Target Tape LUNs dialog box 4. Select the LUN or LUNs for which to display or clear statistics, then click Statistics. The Tape LUN Statistics dialog box displays. (Refer to Figure 502.
25 Tape LUN statistics • • • • Compressed Bytes: The number of compressed bytes written to tape. Host Port WWN: The WWN of the host port that is being used for the write operation. A Refresh button updates the statistics on the display since the last reset. A Clear button resets all statistics in the display. 5. Do either of the following: a. Click Clear to clear the tape LUN statistics, then click Yes to confirm. b. Click Refresh to view the current statistics cumulative since the last reset.
Encryption engine rebalancing 25 FIGURE 504 Tape LUN Statistics dialog box The dialog box contains the following information: • LUN #: The number of the logical unit for which statics are displayed. • Tape Volume/Pool: The tape volume label of the currently-mounted tape, if a tape session is currently in progress. • • • • • • Tape Session #: The number of the ongoing tape session. Uncompressed blocks: The number of uncompressed blocks written to tape.
25 Master keys During rebalancing operations, be aware of the following: • You might notice a slight disruption in Disk I/O. In some cases, manual intervention may be needed. • Backup jobs to tapes might need to be restarted after rebalancing is completed. To determine if rebalancing is recommended for an encryption engine, check the encryption engine properties. Beginning with Fabric OS 6.4, a field is added that indicates whether or not rebalancing is recommended.
Master keys 25 When you create a new master key, the former active master key automatically becomes the alternate master key. The new master key cannot be used (no new data encryption keys can be created, so no new encrypted LUNs can be configured), until you back up the new master key. After you have backed up the new master key, it is strongly recommended that all encrypted disk LUNs be rekeyed.
25 Master keys Master key actions NOTE Master keys belong to the group and are managed from Group Properties. Master key actions are as follows: • Backup master key: Enabled any time a master key exists. Selecting this option launches the Backup Master Key for Encryption Group dialog box. You can back up the master key to a file, to a key vault, or to a smart card.
Master keys 25 The Master Key Backup dialog box displays, but only if the master key has already been generated. (Refer to Figure 505.) FIGURE 505 Master Key Backup dialog box - Backup Destination to file 4. Select File as the Backup Destination. 5. Enter a file name, or browse to the desired location. 6. Enter the passphrase, which is required for restoring the master key. The passphrase can be between eight and 40 characters, and any character is allowed. 7.
25 Master keys FIGURE 506 Backup Master Key for Encryption Group dialog box - Backup Destination to key vault 4. Select Key Vault as the Backup Destination. 5. Enter the passphrase, which is required for restoring the master key. The passphrase can be between eight and 40 characters, and any character is allowed. 6. Re-enter the passphrase for verification, then click OK. A dialog box displays that shows the Key ID. The Key ID identifies the storage location in the key vault. 7.
Master keys 25 FIGURE 507 Backup Master Key for Encryption Group dialog box - Backup Destination to smart cards 4. Select A Recovery Set of Smart Cards as the Backup Destination. 5. Enter the recovery card set size. 6. Insert the first blank card and wait for the card serial number to appear. 7. Run the additional cards through the reader that are needed for the set. As you read each card, the card ID displays in the Card Serial# field. Be sure to wait for the ID to appear. 8.
25 Master keys NOTE Windows operating systems do not require smart card drivers to be installed separately; the driver is bundled with the operating system. However, you must install a smart card driver for UNIX operating systems. For instructions, refer to the Installation Guide that comes with your system. The key is divided among the cards in the card set, up to 10. The quorum of cards required to restore the master key must be less than the total number of cards in the set, and no greater than five.
Master keys 25 4. Choose the active or alternate master key for restoration, as appropriate. 5. Select File as the Restore From location. 6. Enter a file name, or browse to the desired location. 7. Enter the passphrase. The passphrase that was used to back up the master key must be used to restore the master key. 8. Click OK. Restoring a master key from a key vault Use the following procedure to restore the master key from a key vault: 1.
25 Master keys Restoring a master key from a smart card set A card reader must be attached to the SAN Management application PC to complete this procedure. Use the following procedure to restore the master key from a set of smart cards. 1. Select Configure > Encryption from the menu task bar to display the Encryption Center dialog box. (Refer to Figure 376 on page 976.) 2. Select a group from the Encryption Center Devices table, then select Group > Security from the menu task bar.
Security settings 25 Creating a new master key 1. Select Configure > Encryption from the menu task bar to display the Encryption Center dialog box. (Refer to Figure 376 on page 976.) 2. Select a group from the Encryption Center Devices table, then select Group > Security from the menu task bar. The Encryption Group Properties dialog box displays with the Security tab selected. 3. Select Create a New Master Key from the list. A warning displays. 4. Click Yes to proceed.
25 Zeroizing an encryption engine • All encryption operations on this engine are stopped and all virtual initiators (VI) and virtual targets (VT) are removed from the fabric’s name service. • The key vault link key (for NetApp LKM/SSKM key vaults) or the master key (for other key vaults) is erased from the encryption engine.
Using the Encryption Targets dialog box 25 3. Click Yes to zeroize the encryption engine. • For an encryption blade: After the zeroize operation is successful, a message displays noting that the encryption blade will be powered off and powered on to make it operational again. Click OK to close the message. After the encryption blade is powered on, click Refresh in the Encryption Center dialog box to update the status of the encryption blade and perform any operations.
25 Redirection zones FIGURE 511 Encryption Targets dialog box Redirection zones It is recommended that you configure the host and target in the same zone before you configure them for encryption. Doing so creates a redirection zone to redirect the host/target traffic through the encryption engine; however, a redirection zone can only be created if the host and target are in the same zone.
Disk device decommissioning 25 After device decommissioning is performed, the following actions occur: • Metadata on the LUN is erased and the reference is removed from cache on the Brocade Encryption Switchswitch. • The LUN state is shown as decommissioned in the key vault. • The LUN is removed from the container. NOTE The key IDs that were used for encrypting the data are returned. When disk LUNs are decommissioned, the decommissioned keys are still stored on the switch.
25 Disk device decommissioning A warning message displays. 5. Click Yes to proceed with the decommissioning process. A LUN Decommission Status dialog box is displayed while the LUNs are being decommissioned. Click OK to close the dialog box. If a rekey operation is currently in progress on a selected LUN, a message is displayed that gives you a choice of doing a Forced Decommission, or to Cancel and try later after the rekey operation is complete. 6.
Disk device decommissioning 25 • Decommissioned key IDs that have been decommissioned at the key vault are listed in a table. • Universal ID button: Launches the Universal ID dialog box to display the universal ID for each selected decommissioned key. You need to know the Universal ID (UUID) associated with the decommissioned disk LUN key IDs in order to delete keys from the key vault. You can display vendor-specific UUIDs of decommissioned key IDs.
25 Rekeying all disk LUNs manually Rekeying all disk LUNs manually The encryption management application allows you to perform a manual rekey operation on all encrypted primary disk LUNs and all non-replicated disk LUNs hosted on the encryption node that are in the read-write state. Manual rekeying of all LUNs might take an extended period of time. The management application allows manual rekey of no more than 10 LUNs concurrently.
Rekeying all disk LUNs manually 25 5. Open the Encryption Target Disk LUNs dialog box to see LUNs being rekeyed and LUNs pending. a. Select Configure > Encryption from the menu task bar to display the Encryption Center dialog box. (Refer to Figure 376 on page 976.) b. Select the encryption switch from the Encryption Center Devices table, then select Targets from the menu task bar. The Encryption Targets dialog box displays. (Refer to Figure 486.) 6.
25 Rekeying all disk LUNs manually FIGURE 516 Encryption Target Disk LUNs dialog box 4. Click Add. The Add Disk LUNs dialog box displays. This dialog box includes a table of all LUNs in the storage device that are visible to the hosts. 5. Click Re-keying Details. The LUN Re-keying Details dialog box displays. The dialog box contains the following information: • • • • • • Key ID: The LUN key identifier. Key ID State: The state of the LUN rekeying operation.
Rekeying all disk LUNs manually 25 1. Select Configure > Encryption from the menu task bar to display the Encryption Center dialog box. (Refer to Figure 376 on page 976.) 2. Select an encryption group from the Encryption Center Devices table, then select Group > Re-Key Sessions from the menu task bar. The Re-Key Sessions Status dialog box displays, which enables you to check on the status of each LUN that is being rekeyed within an encryption group. (Refer to Figure 517.
25 Thin provisioned LUNs • Thin Provision LUN: Identifies if the new LUN is a thin provisioned LUN. Options are: - Yes: Thin provision support is limited to Brocade-tested storage arrays. The thin provision LUN status will be displayed as Yes for supported storage arrays only. - No: Shown as No if the LUN is not a thin provisioned LUN. Unknown: Shown if the LUN status cannot be determined. Not Applicable: Applies to Brocade Encryption Switchswitches that are running a Fabric OS version earlier than v7.
Viewing time left for auto rekey 25 Thin Provisioning support Thin-provisioned logical unit numbers (LUNs) are increasingly used to support a pay-as-you-grow strategy for data storage capacity. Also known as dynamic provisioning, virtual LUNs, or thin LUNs, the same technology that allows storage administrators to allocate physical disk space to LUNs on an as-needed basis creates limitations around certain data-at-rest encryption operations that use the Brocade Encryption Switchswitch or blade.
25 Viewing and editing switch encryption properties FIGURE 518 Encryption Targets Disk LUNs dialog box - Time left for auto rekey Viewing and editing switch encryption properties To view switch encryption properties, complete the following steps: 1. Select Configure > Encryption from the menu task bar to display the Encryption Center dialog box. (Refer to Figure 376 on page 976.) 2.
Viewing and editing switch encryption properties 25 FIGURE 519 Encryption Switch Properties dialog box The dialog box contains the following information: • • • • Switch Properties table: A list of properties associated with the selected switch Name: The name of the selected switch Node WWN: The world wide name of the node Switch Status: The health status of the switch.
25 Viewing and editing switch encryption properties • Encryption Group: The name of the encryption group to which the switch belongs • Encryption Group Status: Status options are: - OK/Converged: the Group Leader can communicate with all members - Degraded: the Group Leader cannot communicate with one or more members.
Viewing and editing switch encryption properties 25 • Primary Key Vault Link Key Status/Backup Key Vault Link Key Status: Status options are: - Not Used: The key vault type is not LKM/SSKM. - No Link Keys, ready to establish: No access request has been sent to an LKM/SSKM, or a previous request was not accepted. - Link key requested, waiting for LKM approval: A request has been sent to LKM/SSKM and is waiting for the LKM/SSKM administrator’s approval.
25 Viewing and editing switch encryption properties • Re-Balance Recommended: Indicates if LUN rebalancing is recommended for an encryption engine that is hosting both disk and tape LUNs. Options are Yes and No. • System Card Status: The current status of system card information for the encryption engine. Options are Enabled and Disabled.
Viewing and editing encryption group properties 25 Enabling and disabling the encryption engine state from Properties To enable the encryption engine, complete the following steps: 1. Select Configure > Encryption from the menu task bar to display the Encryption Center dialog box. (Refer to Figure 376 on page 976.) 2.
25 Viewing and editing encryption group properties FIGURE 521 Encryption Group Properties dialog box The dialog box contains the following information: • • • • • General tab: For a description of the dialog box, refer to “General tab” on page 1150. Members tab: For a description of the dialog box, refer to “Members tab” on page 1154. Security tab: For a description of the dialog box, refer to “Security tab” on page 1156.
Viewing and editing encryption group properties 25 FIGURE 522 Encryption Group Properties dialog box - General tab The dialog box contains the following information: • Encryption Group Name: The name of the encryption group. • Group Status: The status of the encryption group. Options are: - OK-Converged: The Group Leader can communicate with all members. - Degraded: The Group Leader cannot contact one or more of the configured group members.
25 Viewing and editing encryption group properties • Key Vault Type: Options are: - RSA Data Protection Manager (DPM): If an encryption group contains mixed firmware nodes, the Encryption Group Properties Key Vault Type name is based on the firmware version of the Group Leader. For example, If a switch is running Fabric OS 7.1.0 or later, the Key Vault Type is displayed as “RSA Data Protection Manager (DPM).”If a switch is running a Fabric OS version prior to v7.1.
Viewing and editing encryption group properties 25 • Backup Key Vault Connection Status: The status of the backup key vault link. Options are: - Connected - Unknown/Busy - Not configured - Not responding - Failed authentication • High Availability Mode: (For KMIP key vault type.) Options are: - Opaque: Both the primary and secondary key vaults are registered on the Brocade Encryption Switchswitch. The client archives the key to a single (primary) key vault.
25 Viewing and editing encryption group properties Members tab The Members tab lists group switches, their role, and their connection status with the Group Leader. The table columns are not editable. The tab displays the configured membership for the group and includes the following: • • • • Node WWN: The member switch’s world wide name. IP Address: The switch’s IP address or host name. Node Name: The switch’s node name, if known. If unknown, this field is blank.
Viewing and editing encryption group properties 25 FIGURE 523 Encryption Group Properties dialog box - Members tab Members tab Remove button You can click the Remove button to remove a selected switch or group from the encryption group table. • You cannot remove the Group Leader unless it is the only switch in the group. If you remove the Group Leader, the Management application also removes the HA cluster, the target container, and the tape pool (if configured) that are associated with the switch.
25 Viewing and editing encryption group properties The consequences of removing the last switch in a group (which will be the Group Leader) are all switch removal consequences noted above, plus the following: • The encryption group is deleted. • All configured tape pools are deleted. Table 111 explains the impact of removing switches. TABLE 111 Switch removal impact Switch configuration Impact of removal The switch is the only switch in the encryption group. The encryption group is also removed.
Viewing and editing encryption group properties 25 FIGURE 524 Encryption Group Properties dialog box - Security tab The dialog box contains the following information: • Master Key Status: Displays the status of the master key. Possible values are: - Not used: Displays when LKM/SSKM is the key vault. - Required but not created: Displays when a master key needs to be created. - Created but not backed up: Displays when the master key needs to be backed up.
25 Viewing and editing encryption group properties • Registered Authentication Cards table: Lists the registered authentication cards. - Group Card #: The number of cards that are registered. - Card ID: The card serial number. - First Name and Last Name: The first and last name of the person assigned to the card. The names are identified when the authentication card is first registered. - Notes: An optional entry of information.
Viewing and editing encryption group properties 25 • Non-HA Encryption Engines table: Displays a list of encryption engines that are not configured for high-availability clustering • High-Availability Clusters table: A list of encryption engines that have been selected for high-availability clustering. • Right and left arrow buttons: You can select an encryption engine in the Non-HA Encryption Engines table and click the right arrow button to add the encryption engine to the High-Availability Clusters.
25 Viewing and editing encryption group properties Link Keys tab NOTE The Link Keys tab displays only if the key vault type is NetApp LKM/SSKM. Connections between a switch and an NetApp LKM/SSKM key vault require a shared link key. Link keys are used only with LKM/SSKM key vaults. Link keys are used to protect data encryption keys in transit to and from the key vault. There is a separate link key for each key vault for each switch.
Viewing and editing encryption group properties 25 FIGURE 526 Encryption Group Properties dialog box - Link Keys tab Tape Pools tab Tape pools are managed from the Tape Pools tab. From the Tape Pools tab, you can add, modify, and remove tape pools. • To add a tape pool, click Add, then complete the Add Tape Pool dialog box. • To remove an encryption switch or engine from a tape pool, select one or more tape pools listed in the table, then click Remove.
25 Viewing and editing encryption group properties FIGURE 527 Encryption Group Properties dialog box - Tape Pools tab Tape pools overview Tape cartridges and volumes can be organized into a tape pool (a collection of tape media). The same data encryption keys are used for all cartridges and volumes in the pool. Tape pools are used by backup application programs to group all tape volumes used in a single backup or in a backup plan.
Viewing and editing encryption group properties 25 NOTE If groups are not visible in the Encryption Center Devices table, select View > Groups from the menu task bar. 3. Click Add. The Add Tape Pool dialog box displays. (Refer to Figure 528.) The Name tape pool label type is the default; however, you can change the tape pool label type to Number (Refer to Figure 529.) FIGURE 528 Add Tape Pool by name dialog box FIGURE 529 Add Tape Pool by number dialog box 4.
25 Viewing and editing encryption group properties 6. Enter the number of days to use a key before obtaining a new one, if you choose to enforce a key lifespan. The default is Infinite (a blank field or a value of 0), which is the recommended setting. NOTE The key lifespan interval represents the key expiry timeout period for tapes or tape pools. You can only enter the Key Lifespan field if the tape pool is encrypted. If Clear Text is selected as the encryption mode, the Key Lifespan field is disabled.
Encryption-related acronyms in log messages 25 NOTE You cannot replace an encryption engine if it is part of an HA cluster. Encryption-related acronyms in log messages Fabric OS log messages related to encryption components and features may have acronyms embedded that require interpretation. Table 112 lists some of those acronyms.
25 1166 Encryption-related acronyms in log messages Brocade Network Advisor SAN + IP User Manual 53-1003155-01
Chapter 26 Zoning In this chapter • Zoning overview . . . . . . . . . . . . . . . . . . . . . . . . . . . . . . . . . . . . . . . . . . . . . • Zone database size . . . . . . . . . . . . . . . . . . . . . . . . . . . . . . . . . . . . . . . . . . . • Zoning configuration . . . . . . . . . . . . . . . . . . . . . . . . . . . . . . . . . . . . . . . . . . • LSAN zones . . . . . . . . . . . . . . . . . . . . . . . . . . . . . . . . . . . . . . . . . . . . . . . . • LSAN tagging . . . . . . . . . . . . . . .
26 Zoning overview Blue Zone Server 2 Server 1 Storage 2 Red Zone Storage 1 RAID Green Zone Storage 3 Server 3 FIGURE 531 Zoning NOTE A Network OS fabric supports zoning only if all devices in the fabric are running Network OS v2.1.0 or later. NOTE Zone objects based on physical port number or port ID (D,I ports) are not supported in Network OS fabrics.
Zoning overview 26 • LSAN zones Provide device connectivity between fabrics without merging the fabrics. Refer to “LSAN zones” on page 1192 for more information. • QoS zones Assign high or low priority to designated traffic flows. Quality of Service (QoS) zones are standard zones with additional QoS attributes that you select when you create the zone. • Traffic Isolation zones (TI zones) Isolate inter-switch traffic to a specific, dedicated path through the fabric.
26 Zone database size • You want to analyze the impact of changes to storage access before applying the changes. For example, if you deploy a new server and want to ensure that the zoning changes result in only the new server gaining access to specific storage devices and nothing else. Refer to “Comparing zone databases” on page 1205. Zoning naming conventions The naming rules for zone names, zone aliases, and zone configuration names vary with the type of fabric.
Zoning configuration 26 The Professional Edition does not support large zone databases. In the Professional Edition, the maximum size of the zone database without zone aliases is 32 KB. If the zone database contains aliases, the maximum size is less than 32 KB. Zoning configuration At a minimum, zoning configuration entails creating zones and zone members. However, you can also create zone aliases, zone configurations, and zone databases.
26 Zoning configuration Creating a zone 1. Select Configure > Zoning > Fabric. The Zoning dialog box displays. 2. Click the Zone DB tab if that tab is not automatically displayed. 3. Select a fabric from the Zoning Scope list. This identifies the target entity for all subsequent zoning actions and displays the zoning database for the selected entity. 4. Click New Zone. A new zone displays in the Zones list. 5. Type the name for the zone.
Zoning configuration 26 6. Click OK to close the Zone Properties dialog box. Adding members to a zone Use this procedure to add a member to a zone when the member is listed in the Potential Members list of the Zone DB tab. Enterprise and Professional Plus editions: For instructions to add a member to a zone when the member is not listed in the Potential Members list, refer to the procedure “Creating a member in a zone” on page 1174. 1. Select Configure > Zoning > Fabric. The Zoning dialog box displays.
26 Zoning configuration The selected zone database is saved to the fabric without enabling a specific zone configuration. 9. Click OK or Apply to save your changes. Any zones or zone configurations you have changed are saved in the zone database. Creating a member in a zone Use this procedure to add a member to a zone when the member is not listed in the Potential Members list of the Zone DB tab.
Zoning configuration 26 Removing a member from a zone Use the following procedure to remove one or more members from a zone or zones. Note that the member is not deleted; it is only removed from the zone. 1. Select Configure > Zoning > Fabric. The Zoning dialog box displays. 2. Click the Zone DB tab if that tab is not automatically displayed. 3. Select a fabric from the Zoning Scope list.
26 Zoning configuration 7. Click OK or Apply to save your changes. Any zones or zone configurations you have changed are saved in the zone database. Deleting a zone 1. Select Configure > Zoning > Fabric. The Zoning dialog box displays. 2. Click the Zone DB tab if that tab is not automatically displayed. 3. Select a fabric from the Zoning Scope list. This identifies the target entity for all subsequent zoning actions and displays the zoning database for the selected entity. 4.
Zoning configuration 26 Depending on the characters included in the name you enter, a message may display informing you the name contains characters that are not accepted by some switch vendors. Click OK and enter a different name or accept the default name assigned to the zone. (For zone name requirements and limitations, refer to “Zoning naming conventions” on page 1170.) 6. Click OK or Apply to save your changes. Any zones or zone configurations you have changed are saved in the zone database.
26 Zoning configuration 7. Perform one of the following actions based on the task you want to complete: • To enable the default zone, click Enable, and then click OK. • To disable the default zone, click Disable, and then click OK. The Zoning Policies dialog box closes and the Zone DB tab displays. 8. Click OK or Apply to save your changes. Any zones or zone configurations you have changed are saved in the zone database. Creating a zone alias An alias is a logical group of port index numbers and WWNs.
Zoning configuration 26 12. Click OK or Apply on the Zoning dialog box to save your changes. Editing a zone alias 1. Select Configure > Zoning > Fabric. The Zoning dialog box displays. 2. Click the Zone DB tab if that tab is not automatically displayed. 3. Select a fabric from the Zoning Scope list. 4. Select Alias from the Type list. 5. Select the alias you want to edit in the Alias list and click Edit. The Edit Alias dialog box displays. 6. Add members to the alias by completing the following steps. a.
26 Zoning configuration 5. Show all objects in the Alias list by right-clicking an object and selecting Tree > Expand All. 6. Select one or more objects that you want to remove from the alias in the Alias list. (Press SHIFT or CTRL and click each member to select more than one member.) You can select objects from different zone aliases. 7. Right-click one of the selected objects and select Remove. The selected objects are removed from the associated zone aliases. 8.
Zoning configuration 26 2. Click the Zone DB tab if that tab is not automatically displayed. 3. Select a fabric from the Zoning Scope list. 4. Select Alias from the Type list. 5. Right-click the zone alias you want to delete and select Delete. 6. Click Yes on the confirmation message. The selected zone alias is deleted from the Alias list. 7. Click OK or Apply on the Zoning dialog box to save your changes. Duplicating a zone alias 1. Select Configure > Zoning > Fabric. The Zoning dialog box displays. 2.
26 Zoning configuration 7. Add zones to the zone configuration. For step-by-step instructions, refer to “Adding zones to a zone configuration” on page 1182. 8. Click OK or Apply to save your changes. Any zones or zone configurations you have changed are saved in the zone database. Viewing zone configuration properties 1. Select Configure > Zoning > Fabric. The Zoning dialog box displays. 2. Click the Zone DB tab if that tab is not automatically displayed. 3.
Zoning configuration 26 1. Select Configure > Zoning > Fabric. The Zoning dialog box displays. 2. Click the Zone DB tab if that tab is not automatically displayed. 3. Select a fabric from the Zoning Scope list. This identifies the target entity for all subsequent zoning actions and displays the zoning database for the selected entity. 4. Click the plus sign (+) by the appropriate zone configuration in the Zone Configurations list to expand the listing and show the zone configuration members. 5.
26 Zoning configuration 4. (Optional) Select a zone database from the Zone DB list (Enterprise and Professional Plus editions only). 5. Select the zone configuration you want to activate in the Zone Configurations list. 6. Click Activate. 7. Review the information in the Activate Zone Configuration dialog box. a. Make sure the selected zone configuration is the one you want to activate. b.
Zoning configuration 26 1. Select Configure > Zoning > Fabric. The Zoning dialog box displays. 2. Click the Active Zone Configuration tab. 3. Select a fabric from the Active Zone Configuration list. This identifies the target entity for all subsequent zoning actions and displays the zoning database for the selected entity. 4. Click Deactivate. 5. Click Yes on the confirmation message. If the deactivation succeeded, the zone configuration no longer displays in the Active Zone Configuration tab.
26 Zoning configuration 4. Select one or more zone configurations in the Zone Configurations list that you want to delete, then right-click and select Delete. A message displays asking you to confirm the deletion. 5. Click Yes to delete the selected zone configuration. The message closes and the selected zone configurations are removed from the Zone Configurations list. NOTE If you select “Do not show me this again.
Zoning configuration 26 Creating an offline zone database Offline zone databases are supported only in Enterprise and Professional Plus editions. Use this procedure to create a zone database and save it offline. 1. Select Configure > Zoning > Fabric. The Zoning dialog box displays. 2. Click the Zone DB tab if that tab is not automatically displayed. 3. Select a zone database from the Zone DB list. 4. Select Save As from the Zone DB Operation list. The Save Zone DB As dialog box displays. 5.
26 Zoning configuration 3. Select the offline zone database you want to delete in the Zone DB list. NOTE Only offline databases can be deleted. 4. Select Delete from the Zone DB Operation list. 5. Click Yes on the confirmation message. The message closes and the selected zone configurations are removed from the Zone Configurations list. 6. Click OK to save your work and close the Zoning dialog box. Any zones or zone configurations you have changed are saved in the zone database.
Zoning configuration 26 a. Load the newly created offline zone database. b. Add the active zones to the zone configuration that is the active configuration on the other fabric. c. Rename the inactive configuration. Merging two zone databases If a zone or zone configuration is merged, the resulting zone or zone configuration includes all members that were marked for addition or removal as well as all members not otherwise marked.
26 Zoning configuration 4. Select a database from the Editable Zone DB list. The Reference Zone DB and Editable Zone DB areas display all available element types (zone configurations, zones, and aliases) for the two selected zone databases. In the Editable Zone DB area, each element type and element display with an icon indicator (Table 113) to show the differences between the two databases. 5. (Optional) Merge elements (zone configurations, zones, or aliases) by completing the following steps: a.
Zoning configuration 26 After you merge the two zone databases, you create a common active zone configuration before physically merging the fabrics. 1. Select Configure > Zoning > Fabric. The Zoning dialog box displays. 2. Select Compare from the Zone DB Operation list. The Compare/Merge Zone DBs dialog box displays, as shown in Figure 532. 3. Select the database for the first fabric from the Reference Zone DB list. 4. Select the database for the second fabric from the Editable Zone DB list. 5.
26 LSAN zones 2. Select an offline zone database from the Zone DB list. 3. Select Export from the Zone DB Operation list. The Export Zone DB dialog box displays. 4. Browse to the location where you want to export the zone database file (.xml format). 5. Click Export Zone DB. 6. Click OK to save your work and close the Zoning dialog box. Importing an offline zone database NOTE You cannot import an online zone database. You cannot import a zone database that contains zones with duplicate members. 1.
LSAN zones 26 Figure 533 shows an example in which Server 1, which is connected to a switch in the VCS fabric, has access to local storage and to RAID storage on a Fabric OS fabric. FC router Fabric OS fabric VCS fabric Storage 1 Server 1 LSAN zone RAID FIGURE 533 LSAN zoning Supported configurations for LSAN zoning LSAN zoning is available only for backbone fabrics and any directly connected edge fabrics. A backbone fabric is a fabric that contains an FC router.
26 LSAN zones 4. If you want to show all edge fabrics in your backbone fabric in the Potential Members list, right-click a device and select Table > Expand All. 5. Create the LSAN zones. For specific instructions, refer to “Creating an LSAN zone” on page 1194. 6. Add members to each zone. For specific instructions, refer to “Adding members to the LSAN zone” on page 1195. NOTE You cannot add an LSAN zone to a zone configuration. LSAN zones are automatically added to the active zone configuration.
LSAN zones 26 6. Add members to the LSAN zone. a. Select one or more members to add to the zone in the Potential Members list. (Press SHIFT or CTRL and click each member to select more than one member.) b. Select an option from the Type list. For DCB-capable switches, you may need to change the port display options to see the ports. Right-click in the Potential Members list and select Port Display to change the options. c. 7.
26 LSAN zones 4. In the Potential Members list, select one or more members to add to the zone. (Press SHIFT or CTRL and click each member to select more than one member.) If you want to show all discovered fabrics in the Potential Members list, right-click anywhere in the table and select Display All. 5. In the Zones list, select one or more LSAN zones to which you want to add members. (Press SHIFT or CTRL and click each zone name to select more than one zone.) 6.
LSAN tagging 7. 26 Click OK to save your changes and close the Add Zone Member dialog box. OR Click Apply to save your changes and keep the Add Zone Member dialog box open so you can add more new members. Repeat step 3 through step 6 as many times as needed, and proceed to step 8 when you have finished adding members. 8. Click Activate and review the information in the Activate LSAN Zones dialog box. LSAN zones that contain online members are automatically included in the Destination Fabrics list.
26 Traffic Isolation zones You configure the tags using the command line interface. The Management application displays the tags. If tags are configured, they are displayed in the LSAN Zoning dialog box. Note that although you can configure tags on FC routers running Fabric OS versions earlier than 7.2.0, the tags are displayed in the Management application only if the FC router is running Fabric OS 7.2.0 or later.
Traffic Isolation zones • • • • • • • • • • • • • • • 26 40-port, 8 Gbps FC Switch (Brocade 5100) 80-port, 8 Gbps FC Switch (Brocade 5300) 48-port, 16 Gbps FC Switch (Brocade 6510) 8 Gbps 12-port Embedded Switch (Brocade 5410) 8 Gbps 24-port Embedded Switch (Brocade 5424, 5450, 5460) 8 Gbps 16-port Embedded Switch (Brocade 5470) 8 Gbps 24-port Embedded Switch (Brocade 5480) 8 Gbps Extension Switch (Brocade 7800) 8 Gbps 8-FC port, 10 GbE 24-DCB port Switch (Brocade 8000) 8 Gbps 40-port Switch (Brocade VA-
26 Traffic Isolation zones 5. (Optional) If you want to show all discovered fabrics in the Potential Members list, right-click in the Potential Members list and select Display All. 6. Create the Traffic Isolation zones. For specific instructions, refer to “Creating a Traffic Isolation zone” on page 1200. 7. Add members to each zone. For specific instructions, refer to “Adding members to a Traffic Isolation zone” on page 1200. NOTE You cannot add a Traffic Isolation zone to a zone configuration. 8.
Traffic Isolation zones 26 NOTE You cannot add a device as a member to a Traffic Isolation zone. 1. Select Configure > Zoning > Fabric. The Zoning dialog box displays. 2. Click the Zone DB tab if that tab is not automatically displayed. 3. Select a fabric from the Zoning Scope list. This identifies the target entity for all subsequent zoning actions and displays the zoning database for the selected entity. 4.
26 Traffic Isolation zones This identifies the target entity for all subsequent zoning actions and displays the zoning database for the selected entity. 4. Right-click the Traffic Isolation zone you want to enable in the Zones list and select Configured Enabled. 5. Click OK or Apply to save your changes. The Traffic Isolation zone is saved, but not activated. The Traffic Isolation zone is activated when you activate a zone configuration in the same zone database.
Boot LUN zones 26 Disabling failover on a Traffic Isolation zone NOTE Traffic Isolation zones are configurable only on a Fabric OS device. If failover is disabled, be aware of the following considerations: • Ensure that there are non-dedicated paths through the fabric for all devices that are not in a TI zone. • If you create a TI zone with E_Ports only, failover must be enabled. If failover is disabled, the specified ISLs will not be able to route any traffic.
26 Boot LUN zones 2. Click the Zone DB tab if that tab is not automatically displayed. 3. Select a fabric from the Zoning Scope list. This identifies the target entity for all subsequent zoning actions and displays the zoning database for the selected entity. Boot LUN zones are not supported for Network OS fabrics. 4. Launch the New Boot LUN Zone dialog box by performing one of the following options: • Select New Boot LUN Zone from the New Zone list.
Zoning administration 26 You can click the ellipsis button to display and select the storage port WWNs from a device tree with storage group. 6. Enter a 16-digit hexadecimal LUN number in the LUN # field. 7. Click Generate. 8. Click OK or Apply to save your changes. A message displays that a Boot LUN zone already exists and asks whether you want to overwrite the existing zone. 9. Click Yes. The existing Boot LUN zone is replaced by the version you just created.
26 Zoning administration FIGURE 534 Compare/Merge Zone DBs dialog box 3. Select a database from the Reference Zone DB list. 4. Select a database from the Editable Zone DB list. The Reference Zone DB and Editable Zone DB areas display all available element types (zone configurations, zones, and aliases) for the two selected zone databases. In the Editable Zone DB area, each element type and element display with an icon indicator (Table 113) to show the differences between the two databases. 5.
Zoning administration 7. 26 Select the Differences only check box to display only the differences between the selected databases. 8. Select the Sync Scroll Enable check box to synchronize scrolling between the selected databases. 9. Click Previous or Next to navigate line-by-line in the Editable Zone DB area. 10. Click Close. To merge two zone databases, refer to “Merging two zone databases” on page 1189.
26 Zoning administration 3. Enter the maximum number of zone database changes that can be made for that fabric before a zone configuration is activated. To set a limit, enter a positive integer. To allow unlimited changes, enter 0. 4. Repeat step 2 and step 3 for each fabric on which you want to set limits. 5. To set a limit for new, undiscovered fabrics, enter a value in the Default Change Count for New Fabrics field. This limit is enforced on all new fabrics as they are discovered.
Zoning administration 26 3. Select a zone database that you have checked out (your user name is in the Current User column) in the Zone DB list. 4. Select Undo CheckOut from the Zone DB Operation list. 5. Click Yes in the confirmation message. This removes the user names of users currently logged in to the client from the Current User column for this zone database. 6. Click OK to save your work and close the Zoning dialog box.
26 Zoning administration Finding zones in a zone configuration Use this procedure to locate all instances of a zone in the Zone Configurations list on the Zone DB tab. 1. Select Configure > Zoning > Fabric. The Zoning dialog box displays. 2. Click the Zone DB tab if that tab is not automatically displayed. 3. Select a fabric from the Zoning Scope list. This identifies the target entity for all subsequent zoning actions and displays the zoning database for the selected entity. 4.
Zoning administration 26 This identifies the target entity for all subsequent zoning actions and displays the zoning database for the selected entity. 4. Right-click in the Potential Members list and select List Zone Members. The List Zone Members dialog box displays. If the port is a member of a zone, the fabric name, the port name, and WWN zone members display. 5. Select Historical Graph or Real-Time Graph from the Performance Graph drop-down list.
26 Zoning administration A warning message displays informing you that the selected zone members will be replaced from all zones and aliases in the selected zone DB. 6. Click OK on the message. 7. Click OK or Apply on the Zoning dialog box to save your changes. Any zones or zone configurations you have changed are saved in the zone database. Replacing zone members You can replace one instance of a zone member in one zone, or all instances of the zone member in all the zones to which it belongs. 1.
Zoning administration 26 2. Select a fabric from the Zoning Scope list. This identifies the target entity for all subsequent zoning actions and displays the zoning database for the selected entity. 3. Select Offline Utility from the Zone DB Operation list. The Offline Device Management dialog box displays. 4. Clear the Remove column check box for the offline device you want to replace. 5. Select WWN (default) in the corresponding Replace Using list. 6.
26 Zoning administration A warning message displays informing you that the selected zone members will be removed from all zones and aliases in the selected zone DB. 9. Click OK on the message. 10. Click OK or Apply on the Zoning dialog box to save your changes. Any zones or zone configurations you have changed are saved in the zone database.
Chapter 27 Fibre Channel over IP In this chapter • FCIP services licensing . . . . . . . . . . . . . . . . . . . . . . . . . . . . . . . . . . . . . . . . • FCIP Concepts . . . . . . . . . . . . . . . . . . . . . . . . . . . . . . . . . . . . . . . . . . . . . . . • IP network considerations. . . . . . . . . . . . . . . . . . . . . . . . . . . . . . . . . . . . . . • FCIP platforms and supported features. . . . . . . . . . . . . . . . . . . . . . . . . . . • FCIP trunking . . . . . . . . . . . . . . . .
27 FCIP services licensing FCIP services licensing Most of the FCIP extension services described in this chapter require the High Performance Extension over FCIP/FC license. FICON emulation features require additional licenses. The following features and licensing apply to the 8 Gbps Extension platforms. • FCIP Adaptive Rate Limiting requires the FTR_AE (Advanced Extension) license. • FCIP trunking requires FTR_AE license.
FCIP platforms and supported features 27 FCIP platforms and supported features The following Fabric OS platforms that support FCIP: • The 8 Gbps Extension Switch. • The 8 Gbps Extension blade (8-slot Backbone Chassis, 4-slot Backbone Chassis). NOTE The 8 Gbps Extension blade is supported in 16 Gbps Backbone and Director Chassis, IPv6 addressing is not supported in conjunction with IPsec on all platforms in Fabric OS version v7.0, but will be supported in a later version.
27 FCIP trunking The way FCIP tunnels and virtual ports map to the physical GbE ports depends on the switch or blade model. The 8 Gbps Extension Switch and 8 Gbps Extension Blade tunnels are not tied to a specific GbE port, and may be assigned to any virtual port within the allowed range. The mapping of GbE ports to tunnels and virtual port numbers is summarized in Table 115.
FCIP trunking 27 FCIP tunnel restrictions for FCP and FICON emulation features Multiple FCIP tunnels are not supported between pairs of Extension Switches and Blades when any of the FICON or FCP emulation features are enabled on the tunnel unless TI Zones or LS/LF configurations are used to provide deterministic flows between the switches. The emulation features require deterministic FC Frame routing between all initiators and devices over multiple tunnels.
27 FCIP trunking FIGURE 536 Link loss and retransmission over peer lowest metric circuit In Figure 537, circuit 1 is assigned a metric of 0, and circuit 2 is assigned a metric of 1. In this case, circuit 2 is a standby that is not used unless there are no lowest metric circuits available.
FCIP trunking 27 • If a low metric circuit becomes available again, the high metric circuits return to standby status, and the available bandwidth is updated again as each circuit comes online. For example, if circuit 0 is recovered, the available bandwidth is updated as 1 Gbps. If circuit 1 is also recovered, the available bandwidth is updated as 1.5 Gbps.
27 FCIP trunking Circuit Failover Grouping With Circuit Failover Grouping you can better control which metric 1 circuits will be activated if a metric 0 circuit fails. For this feature, you define a set of metric 0 and metric 1 circuits that are part of the same failover group. When all metric 0 circuits in the group fail, metric 1 circuits will take over data transfer, even if there are metric 0 circuits still active in other failover groups.
FCIP trunking 27 Examples of circuit failover in groups Tables Table 116 through Table 118 provide examples of how failover occurs on circuits with different bandwidths configured in failover groups. Table 116 illustrates circuit failover in a tunnel with two failover groups, each with two circuits. All data through the tunnel is initially load balanced over Circuits 1 and 2.
27 Adaptive Rate Limiting • If circuit 2 and circuit 3 fail, circuit 5 becomes active and data is load balanced over circuit 1 and circuit 5. Reason: Ungrouped circuits 2 and 3 fail over to ungrouped circuit 5, which has a metric of 0. • If circuit 1, circuit 2, and circuit 3 fail, circuit 4 and circuit 5 become active and data is load balanced over both. Reason: Circuit 1 fails over to circuit 4, which is the failover circuit for group 1 with a metric of 0.
QoS SID/DID priorities over an FCIP trunk 27 QoS SID/DID priorities over an FCIP trunk QoS SID/DID traffic prioritization is a capability of Fabric OS Adaptive Networking licensed feature. This feature allows you to prioritize FC traffic flows between hosts and targets. Four internal TCP connections provide internal circuits for managing QoS SID/DID priorities over an FCIP tunnel, as illustrated Figure 538.
27 QoS SID/DID priorities over an FCIP trunk External User Perspective Internal Architecture VE Port Tunnel Circuit High Priority Med.
IPsec and IKE implementation over FCIP 27 The Advanced Settings dialog box is displayed. This dialog box has a Transmission tab, Security tab, and FICON Emulation tab. Configure QoS percentages on the Transmission tab (Figure 539). FIGURE 539 Advanced Settings Transmission Tab 5. Click the up or down arrows by QoS High, QoS Medium, and QoS Low to increment values by 1% and override the default values of 50% (high), 30% (medium), and 20% (low). The three values must equal 100%.
27 IPsec and IKE implementation over FCIP IPsec for the 4 Gbps platforms IPsec uses some terms that you should be familiar with before beginning your configuration. These are standard terms, but are included here for your convenience. Term Definition AES Advanced Encryption Standard. FIPS 197 endorses the Rijndael encryption algorithm as the approved AES for use by US Government organizations and others to protect sensitive information. It replaces DES as the encryption standard.
QOS, DSCP, and VLANs 27 IPSec for the 8 Gbps platforms The 8 Gbps platforms use AES-GCM-ESP as a single, pre-defined mode of operation for protecting all TCP traffic over an FCIP tunnel. AES-GCM-ESP is described in RFC-4106. Key features are listed below: • Encryption is provided by AES with 256 bit keys. • The IKEv2 key exchange protocol is used by peer switches and blades for mutual authentication. • IKEv2 uses UDP port 500 to communicate between the peer switches or blades.
27 QOS, DSCP, and VLANs DSCP settings are useful only if IP routers are configured to enforce QoS policies uniformly within the network. IP routers use the DSCP value as an index into a Per Hop Behavior (PHB) table. Control connections and data connections may be configured with different DSCP values. Before configuring DSCP settings, determine if the IP network you are using implements PHB, and consult with your WAN administrator to determine the appropriate DSCP values.
Open systems tape pipelining TABLE 119 27 Default Mapping of DSCP priorities to L2Cos Priorities (Continued) DSCP priority/bits L2CoS priority/bits Assigned to: 59 / 111011 4 / 100 High QoS 63 / 111111 0 / 000 - Open systems tape pipelining Open Systems Tape Pipelining (OSTP) can be used to enhance open systems SCSI tape write I/O performance. To implement OSTP over FCIP, you must enable the following two features: • FCIP Fastwrite and Tape Acceleration. • FC Fastwrite.
27 FICON emulation features TABLE 120 OSTP constraints FCIP Fastwrite Tape Acceleration Class 3 traffic is accelerated with Fastwrite. Class 3 traffic is accelerated between host and sequential device. With sequential devices (tape drives), there are 1024 initiator-tape (IT) pairs per GbE port, but 2048 initiator-tape-LUN (ITL) pairs per GbE port. The ITL pairs are shared among the IT pairs. For example: Two ITL pairs for each IT pair as long as the target has two LUNs.
Connecting cascaded FICON fabrics over FCIP 27 Tape write pipelining FICON tape write pipelining improves performance for a variety of applications when writing to tape over extended distances. FICON tape write pipelining locally acknowledges write data records, enabling the host to generate more records while previous records are in transit across the IP WAN. If exception status is received from the device, the writing of data and emulation is terminated.
27 Connecting cascaded FICON fabrics over FCIP NOTE Merging two cascaded FICON fabrics may be disruptive to current I/O operations in both fabrics, as it needs to disable and enable the switches in both fabrics. The merge process will not make any configuration changes on the primary (production) fabric that are disruptive. 3. Configure FICON Emulation features, if applicable. NOTE Consult with a qualified support specialist before implementing the FICON Acceleration feature.
Connecting cascaded FICON fabrics over FCIP 27 • IP network connections - Tunnels - Addresses - Bandwidth requirements for all circuits - Label all circuits and tunnels Determine how the IP network will be used by identifying redundant routes, network distance for each route, and minimum and maximum bandwidth requirements. The FICON acceleration feature is required for distances greater than 300 km. Before configuring this feature, Fabric OS professional services are highly recommended.
27 Connecting cascaded FICON fabrics over FCIP 3. Follow these guidelines when configuring tunnels using the Add FCIP Tunnel dialog box: • You can configure either switch as switch 1 or switch 2. • Specifications for FCIP circuits per tunnel, number of IP addresses per port, and other trunking capacities for the 8 Gbps Extension Switch and Blade are detailed in the Fabric OS FCIP Administrator’s Guide.
Connecting cascaded FICON fabrics over FCIP 27 • Start by configuring circuit 0, and then add additional circuits if desired. • Be sure to select Verify IP Connectivity to test the connection between both switches. IP connectivity is tested with the ping utility. • Make changes to IP settings by selecting Advanced Settings to display the FCIP Circuit Advanced Settings dialog box. Make changes to this dialog box only under direction of network administrators. 9.
27 Connecting cascaded FICON fabrics over FCIP 2. Enter the following command to set the speed for the link. Only speeds supported by the installed SFP are supported. Use 0 to set back to automatic sensing mode. portcfgspeed slot/port speed 3. Enter the following command to disable QoS. portcfgqos --disable slot/port 4. Enter the following command to enable ISL R_RDY mode. portcfgislmode slot/port, 1 5. Enter the following command to disable trunking on the port. portcfgtrunkport slot/port, 0 6.
FCIP configuration guidelines TABLE 121 27 Using Fast Write for extended applications Manufacturer RDR Application Platform Type Use Fast Write HP Continuous Access EVA Hybrid No * OSTP Tape Tape Yes (required for OSTP) Compression mode More aggressive compression modes can be used for asynchronous mirroring. For synchronous mirroring, only hardware or standard compression should be used.
27 Configuring an FCIP tunnel • Routers and firewalls must be configured to pass ARP, ICMP, and IP layer 3 protocols. • Persistently disable the VE_Ports before you configure them. Ports on a new Extension Switch or Extension Blade are persistently disabled by default. • Determine which features you are implementing, and gather the information needed to implement those features. Table 114 summarizes feature support per FCIP platform.
Configuring an FCIP tunnel 27 . FIGURE 542 FCIP Tunnels dialog box (fabric selected from Products tree) The dialog box displays a tree structure of all FCIP-capable switches in the discovered fabrics, Extension Switches, and configured tunnels. Details such as number of circuits configured for tunnels, connected switches in tunnels, and tunnel status display in the right columns. 2. To add an FCIP tunnel and circuits between switches, follow these steps: a.
27 Configuring an FCIP tunnel FIGURE 543 Add FCIP Tunnel dialog box c. Click Select Switch Two under Switch Two on the Add FCIP Tunnel dialog box to display the Select Switch dialog box. The Select Switch dialog box displays discovered Extension Switches. d. Select the switch you want to connect to switch one and click OK. The switch and fabric names display in the Switch Two area of the Add FCIP Tunnel dialog box. e. Select the desired tunnel ID from the Tunnel list.
Configuring an FCIP tunnel 27 NOTE VEx ports are not supported on Brocade 7840. 3. Select the desired compression mode. A Standard option provides hardware compression. The 8 Gbps Extension Switch and the 8 Gbps Extension Blade provide three additional options for compression. The Moderate option enables a combination of hardware and software compression that provides more compression than hardware compression alone. This option supports up to 8 Gbps of FC traffic.
27 Configuring an FCIP tunnel FIGURE 544 FCIP Tunnel Advanced Settings dialog box - Select the Fast Write check box to reduce delays caused by latency. Refer to “Enabling Open Systems Tape Pipelining” on page 1251 for more information. - Select the Tperf Test Mode check box for testing and troubleshooting tunnel. Refer to “Enabling Tperf test mode” on page 1251 for more information. - Select L2CoS and DSCP priorities. Refer to “QOS, DSCP, and VLANs” on page 1229 for more information.
Adding an FCIP circuit 27 Logical switch function on the FCIP Tunnels dialog box The display and function of tunnels and circuits created on logical switches and with shared GigE ports varies on the FCIP Tunnels dialog box according to the discovery of the default switch and user-configured logical switches as follows: • If the default and user-configured logical switches are discovered, all tunnels and circuits created on the logical switch display, including circuits with shared GigE ports.
27 Adding an FCIP circuit FIGURE 545 Add FCIP Circuit dialog box Use the following steps to add a circuit. 1. Select the GigE Port used for the Ethernet connection on each switch. The choices available depend on the Extension Switch or Blade model.
Adding an FCIP circuit 27 NOTE For the Brocade 7840, you can configure two IP addresses, one as primary in the Connectivity group and the other as secondary in the HA Connectivity group. The primary address is mandatory. 5. For IPv4 addresses, specify the Subnet Mask. For IPv6 addresses, specify the prefix length. The default is created from the IP address and Subnet Mask. If you want to create a route through a gateway router, click Create Non-Default Route, and select a Gateway address. 6.
27 Adding an FCIP circuit With circuit failover groups you can better control which metric 1 circuits will be activated if a metric 0 circuit fails. For Circuit Failover Grouping, you define a set of metric 0 and metric 1 circuits that are part of the same failover group. When all metric 0 circuits in the group fail, metric 1 circuits will take over data transfer, even if there are metric 0 circuits still active in other failover groups.
Adding an FCIP circuit 27 FIGURE 546 FCIP Circuit Advanced Settings dialog box - Clear the Selective Ack check box to disable selective acknowledgement. Do not clear the check box if your system does not support selective acknowledgement.. - Enter a value in the Keep Alive Time Out (ms) field to override the default value of 10000 ms. As shown, the range is from 500 through 7200000. - Enter a value in the Min. Retransmission Time (ms) field to override the default value of 100 ms.
27 Configuring FCIP tunnel advanced settings • If both the default logical switch and user-configured logical switch are discovered: - The GigE Port list displays all GigE ports in the logical switches, including ports from the default logical switches and user-configured logical switches. - A circuit created with a shared GigE port will create an interface on the default logical switch, but the circuit will be created on the selected logical switch.
Configuring FCIP tunnel advanced settings 27 Enabling Open Systems Tape Pipelining Latency introduced by a long distance IP connection can negatively impact tape I/O performance. Open Systems Tape Pipelining (OSTP) may be used to improve performance on SCSI write I/Os to sequential devices (such as tape drives). When OSTP is used, the Extension Blades or Switches emulate write commands and responses locally to reduce delays caused by latency.
27 Configuring FCIP tunnel advanced settings Configuring IPsec and IKE policies IPsec and IKE policies are configured from the Security tab. The options and procedures are platform-dependent. Figure 547 on page 1252 shows the Security tab for the 8 Gbps Extension Switch and 8 Gbps Extension Blade. 1. Select Advanced Settings on the Add FCIP Tunnel or Edit FCIP Tunnel dialog box to display the Advanced Settings dialog box. 2. Select the Security tab.
Configuring FCIP tunnel advanced settings 27 • For the 8 Gbps Extension switch, the key value must be a minimum of 32 alphanumeric characters. These policies are used to make the connection more secure through authentication and encryption. When you select a policy for the local switch, a matching policy is automatically selected on the remote switch. If no matching policy is found, you must manually configure the policy on the remote switch.
27 Configuring FCIP tunnel advanced settings FIGURE 548 Advanced Settings FICON Emulation Tab 3. Select the check boxes for the FICON emulation features you want to implement. The primary FICON emulation features are FICON XRC Emulation (IBM z/OS Global Mirror emulation), tape write pipelining, tape read pipelining, TIN/TUR emulation and device level ACK emulation provide support for the primary features.
Viewing FCIP connection properties 27 - FICON Tape Write Timer defines a time limit for pipelined write chains. This value is be specified in milliseconds (ms). If a pipelined write chain takes longer than this value to complete, the ending status for the next write chain will be withheld from the channel. This limits processing to what the network and device can support. Too small a value limits pipelining performance. Too large a value results in too much data being accepted for one device on a path.
27 Viewing General FCIP properties FIGURE 550 FCIP connection properties (default switch not discovered) Viewing General FCIP properties Use the following steps to view general FCIP properties for a switch or blade. 1. Right click an Extension Blade or Switch from the Fabric Tree structure or on the Connectivity Map, and select Properties. 2. Select the Properties tab.
Viewing General FCIP properties 27 FIGURE 551 General FCIP properties tab (Extension Switch or Blade) Use the following steps to view the properties of a chassis where an Extension Blade is installed. 1. Right click the chassis in the Switch group in Fabric Tree structure or on the Connectivity Map where the Extension Blade is installed, and select Properties. 2. Select the Properties tab.
27 Viewing FCIP port properties FIGURE 552 General FCIP properties tab (blade chassis) Viewing FCIP port properties Take the following steps to view FCIP FC. VE/VEX, and GbE port properties. 1. Right click an Extension Blade or Switch from the Fabric Tree structure or on the Connectivity Map, and select Properties. 2. Select the Port tab. 3. To view FC port information, select the FC from the Type drop-down list (Figure 553).
Viewing FCIP port properties 27 FIGURE 553 FC ports properties 4. To view VE and VEX port information, select the VE/VEx from the Type drop-down list (Figure 554). FIGURE 554 VE/VEx port properties 5. To view GbE (Ethernet) port information, select the GigE from the Type drop-down list (Figure 555).
27 Editing FCIP circuits FIGURE 555 GbE port properties Editing FCIP circuits FCIP circuit settings may be edited from the Edit FCIP Circuit dialog box. The procedure for launching this dialog box for the 4 Gbps Extension Switch and Blade is different than the procedure for the 8 Gbps Extension Switch and the 8 Gbps Extension Blade.
Disabling FCIP tunnels 27 2. Select a circuit that you want to edit from the Circuits properties table at the bottom of the dialog box and select Edit. The Edit FCIP Circuit dialog box displays (Figure 556). FIGURE 556 Edit FCIP Circuit dialog box 3. Fields and parameters are as described in “Adding an FCIP circuit”. You can edit all editable fields and parameters. Disabling FCIP tunnels 1. From the FCIP Tunnels dialog box, select the tunnel you want to disable. 2. Select Disable.
27 Deleting FCIP tunnels Deleting FCIP tunnels 1. From the FCIP Tunnels dialog box, select the tunnel you want to delete. 2. Select the Delete. A confirmation dialog box displays, warning you of the consequences of deleting a tunnel. 3. Click OK to delete the tunnel. Disabling FCIP circuits 1. From the FCIP Tunnels dialog box, select the tunnel that contains the circuit. 2. Select Edit. The Edit FCIP Tunnel dialog box displays. 3.
Displaying FCIP performance graphs 27 4. Select Delete. 5. For tunnels with multiple circuits, select additional circuits from the table to delete and select Delete after each selection. 6. Click OK to delete the circuit(s). Displaying FCIP performance graphs You can display performance graphs by clicking the Performance button on the FCIP Tunnels dialog box. You can also display performance graphs from Properties, as described in the following sections. Displaying performance graphs for FC ports 1.
27 Displaying tunnel properties from the FCIP tunnels dialog box Displaying tunnel properties from the FCIP tunnels dialog box Tunnel properties can be displayed from the FCIP Tunnels dialog box. 1. Select a tunnel from the FCIP tunnels dialog box. 2. Select the Tunnel tab. Tunnel properties are displayed.
Displaying switch properties from the FCIP Tunnels dialog box 27 FIGURE 558 Circuit properties on the FCIP Tunnels dialog box Displaying switch properties from the FCIP Tunnels dialog box Switch properties are displayed on the FCIP Tunnels dialog box when you select a switch (Figure 559).
27 Displaying fabric properties from the FCIP Tunnels dialog box FIGURE 559 Switch properties on the FCIP Tunnels dialog box Displaying fabric properties from the FCIP Tunnels dialog box Fabric properties are displayed on the FCIP Tunnels dialog box when you select a fabric. (Figure 560).
Troubleshooting FCIP Ethernet connections 27 FIGURE 560 Fabric properties on the FCIP Tunnels dialog box Troubleshooting FCIP Ethernet connections 1. Right-click a blade an Extension Blade or Switch from the Fabric Tree structure or Connectivity Map, and select Properties. 2. Select the Port tab. 3. Select GigE from the Type drop-down list. 4. Select an Ethernet port. 5. Click Troubleshooting.
27 1268 Troubleshooting FCIP Ethernet connections Brocade Network Advisor SAN + IP User Manual 53-1003155-01
Chapter Fabric Binding 28 In this chapter • Fabric Binding overview . . . . . . . . . . . . . . . . . . . . . . . . . . . . . . . . . . . . . . 1269 • High Integrity Fabric overview . . . . . . . . . . . . . . . . . . . . . . . . . . . . . . . . . . . 1274 Fabric Binding overview The fabric binding feature enables you to configure whether switches can merge with a selected fabric.
28 Fabric Binding overview FIGURE 561 Fabric Binding dialog box 2. Review the fabric binding membership details. • Fabric List table — Lists the fabrics in your network. Fabric Name — The name of the fabric. Fabric WWN — The world wide name of the fabric. Binding Status — The binding status (enabled/disabled) of the fabric. Enable/Disable check box — Indicates whether fabric binding is enabled. Select to enable a fabric binding for the fabric.
Fabric Binding overview 28 • Membership List of Fabric_Name table — The current Fabric Membership List (FML) of the highlighted fabric, including the following details: Name — The name of the switch fabric. Node WWN — The node WWN of an available or member switch. Domain ID — The domain ID of an available or member switch. Fabric Name — The name of the fabric. Fabric WWN — The world wide name of the fabric. Attached — Whether or not the switch is attached.
28 Fabric Binding overview 2. In the Fabric List table, select the Enable/Disable check box for fabrics for which you want to configure fabric binding. For instructions on adding and removing switches from the membership list, refer to “Adding switches to the fabric binding membership list” on page 1273 and “Removing switches from fabric binding membership” on page 1273. 3. Click OK on the Fabric Binding dialog box.
Fabric Binding overview 28 • List of possible reasons that could cause Fabric Binding failure message — Refer to the Fabric OS Administrator’s Guide for detailed information. Adding switches to the fabric binding membership list Once you have enabled fabric binding (refer to “Enabling fabric binding” on page 1271), you can add switches to the fabric binding membership list. NOTE Fabric binding is only supported on Fabric OS 5.2 or later. To add a switch to the fabric, complete the following steps. 1.
28 High Integrity Fabric overview NOTE Fabric binding is only supported on Fabric OS 5.2 or later. 1. Select Configure > Fabric Binding. The Fabric Binding dialog box displays (Figure 561). 2. Select the switches you want to remove from the selected fabrics’ Fabric Membership List (FML) in the Membership List table. NOTE The selected switch cannot be part of the fabric. 3. Click the left arrow to move the switches to the Available Switches table. 4. Click OK on the Fabric Binding dialog box.
High Integrity Fabric overview 28 • Dynamic Load Sharing (DLS) should be disabled. If DLS is not disabled, DLS automatically adjusts routes when a new ISL is added, and when an ISL is taken offline and brought online again. This process may result in dropped frames. NOTE Port binding is a security method for restricting devices that connect to particular switch ports. Port binding should never be used in FICON environments. The FICON channel cannot be added to the port binding list.
28 High Integrity Fabric overview NOTE A warning message is displayed when you disable HIF mode. To deactivate a HIF, complete the following steps. 1. Select Configure > High Integrity Fabric. The High Integrity Fabric dialog box displays (Figure 562). 2. Select the fabric on which you want to deactivate HIF from the Fabric Name list. The HIF status displays in the High Integrity Fabric field. 3. Click Deactivate.
Chapter 29 Port Fencing In this chapter • About port fencing . . . . . . . . . . . . . . . . . . . . . . . . . . . . . . . . . . . . . . . . . . . . • Thresholds . . . . . . . . . . . . . . . . . . . . . . . . . . . . . . . . . . . . . . . . . . . . . . . . . • Adding thresholds . . . . . . . . . . . . . . . . . . . . . . . . . . . . . . . . . . . . . . . . . . . • Editing thresholds . . . . . . . . . . . . . . . . . . . . . . . . . . . . . . . . . . . . . . . . . . . • Removing thresholds. . . . . . . .
29 About port fencing Viewing port fencing configurations NOTE This feature is only available for Fabric OS devices. NOTE This feature requires a Trial or Licensed version. Port Fencing allows you to protect your SAN from repeated operational problems experienced by ports. Use Port Fencing to set threshold limits for the number of specific port events permitted during a given time period on the selected object.
About port fencing 29 • Thresholds table — List of configured thresholds based on the threshold type selected in the Violation Type list. Limit (Fabric OS) — The number of events allowed for the assigned threshold. If the object has no fencing support or no fencing changes, this field displays two hyphens separated by a space (- -). When the object is only partially managed by the management application, this field displays as inactive (grayed-out).
29 Thresholds Period (Fabric OS) — The time limit (in seconds or minutes) for the assigned threshold. This field displays as inactive (grayed-out) when the object is only partially managed by the management application. Operational State — The operational state of the port. Blocked Configuration — The current configuration of the port (Blocked or Unblocked). Port WWN — The port world wide name of the port. Connected Product — The device label of the connected object.
Thresholds 29 C3 Discard Frames threshold NOTE This threshold is only available for Fabric OS devices running 6.3 or later. Use this type of threshold to block a port when a C3 Discard Frames violation meets the Fabric OS switch threshold. This threshold is only supported on directors, switches, and blades with a 4 Gbps, 8 Gbps, or 16 Gbps ASIC.
29 Thresholds Invalid CRCs threshold NOTE This threshold is only available for Fabric OS devices. Use this type of threshold to block a port when an Invalid CRCs violation meets the Fabric OS switch threshold. Invalid words threshold NOTE This threshold is only available for Fabric OS devices. Use this type of threshold to block a port when an Invalid Words violation meets the Fabric OS switch threshold. Link Reset threshold NOTE This threshold is only available for Fabric OS devices.
Adding thresholds 29 Adding thresholds NOTE This feature requires a Trial or Licensed version. The Management application allows you to create Invalid CRCs, Invalid words, Link, Link Reset, Protocol Error, Security, and Sync Loss thresholds. Adding a C3 Discard Frames threshold NOTE This threshold is only available for Fabric OS devices running 6.3 or later. Use to block a port when a C3 Discard Frames violation type meets the Fabric OS switch threshold.
29 Adding thresholds FIGURE 565 Add C3 Discard Frames Threshold dialog box 4. Enter a name for the threshold in the Name field. 5. Select one of the following options: • Default — Uses device defaults. Go to step 8. • Custom — Uses your selections. Continue with step 6. 6. Enter the number of C3 discarded frames allowed for the threshold in the Threshold errors field. 7. Select the time period for the threshold from the errors per list.
Adding thresholds 29 Adding an Invalid CRCs threshold NOTE This threshold is only available for Fabric OS devices. NOTE This feature requires a Trial or Licensed version. Use to block a port when an Invalid CRC violation type meets the Fabric OS switch threshold. For default threshold values for Fabric OS devices, refer to Chapter 7 of the Fabric Watch Administrator's Guide. To add an Invalid CRCs threshold, complete the following steps. 1. Select Monitor > Fabric Watch > Port Fencing.
29 Adding thresholds 8. Click OK to add the Invalid CRCs threshold to the table and close the Add Invalid CRCs Threshold dialog box. To assign this threshold to fabrics, switches, or switch ports, refer to “Assigning thresholds” on page 1291. 9. Click OK on the Port Fencing dialog box. Adding an Invalid Words threshold NOTE This threshold is only available for Fabric OS devices. NOTE This feature requires a Trial or Licensed version.
Adding thresholds 29 • Minute — the port is blocked as soon as the specified number of invalid words allowed is reached within a minute. • Hour — the port is blocked as soon as the specified number of invalid words allowed is reached within a hour. • Day — the port is blocked as soon as the specified number of invalid words allowed is reached within a day. 8. Click OK to add the Invalid Words threshold to the table and close the Add Invalid Words Threshold dialog box.
29 Adding thresholds 7. Select the time period for the threshold from the errors per list. The following choices are available: • None — the port is blocked as soon as the specified number of link resets allowed is met. • Second — the port is blocked as soon as the specified number of link resets allowed is reached within a second. • Minute — the port is blocked as soon as the specified number of link resets allowed is reached within a minute.
Adding thresholds 29 FIGURE 569 Add Protocol Error Threshold dialog box 4. Enter a name for the threshold in the Name field. 5. Select the Fabric OS check box. a. Select one of the following options: • Default — Uses device defaults. Go to step 6. • Custom — Uses your selections. Continue with step b. b. Enter the number of protocol errors allowed for the threshold from the Threshold errors field. c. Select the time period for the threshold from the errors per list.
29 Adding thresholds Adding a State Change threshold NOTE This threshold is only available for Fabric OS devices running 6.3 or later. NOTE This feature requires a Trial or Licensed version. Use to block a port when a state change violation type meets the Fabric OS switch threshold. For 4 Gbps Router, Extension Switches and Blades only, when you apply this threshold on an E Port, the threshold is also applied to the VE Ports (internally by Fabric OS).
Adding thresholds 29 • Day — the port is blocked as soon as the specified number of state changes allowed is reached within a day. 8. Click OK to add the state changes threshold to the table and close the Add State Change Threshold dialog box. To assign this threshold to fabrics, switches, or switch ports, refer to “Assigning thresholds” on page 1291. 9. Click OK on the Port Fencing dialog box. Assigning thresholds You can assign thresholds to any active object in the Ports table.
29 Editing thresholds 2. Right-click anywhere in the Ports table and select Expand. 3. Select a blocked port from the Ports table. 4. Click Unblock. 5. Click OK on the message. If you did not solve the root problem, the threshold will trigger again. 6. Click OK on the Port Fencing dialog box. Avoiding port fencing inheritance When you directly assign a threshold to an object, the threshold is inherited by all subordinate objects in the tree (unless they already have directly assigned thresholds).
Editing thresholds 29 Use to block a port when a C3 Discard Frames violation type meets the Fabric OS switch threshold. To edit a C3 Discard Frames threshold, complete the following steps. 1. Select Monitor > Fabric Watch > Port Fencing. The Port Fencing dialog box displays. 2. Select C3 Discard Frames (Fabric OS only) from the Violation Type list. 3. Select the threshold you want to change and click Edit. The Edit C3 Discard Frames dialog box displays. 4.
29 Editing thresholds Editing an Invalid Words threshold NOTE This threshold is only available for Fabric OS devices. NOTE This feature requires a Trial or Licensed version. Use to block a port when the Invalid Word Threshold violation type meets the Fabric OS switch threshold. To edit an Invalid Words threshold, complete the following steps. 1. Select Monitor > Fabric Watch > Port Fencing. The Port Fencing dialog box displays. 2. Select Invalid Words (Fabric OS only) from the Violation Type list. 3.
Editing thresholds 29 If the threshold has already been assigned to ports, an “Are you sure you want to make the requested changes to this threshold on “X” ports?” message displays. Click OK to close. To assign this threshold to fabrics, switches, or switch ports, refer to “Assigning thresholds” on page 1291. 6. Click OK on the Port Fencing dialog box. Editing a Protocol Error threshold NOTE This threshold is only available for Fabric OS devices. NOTE This feature requires a Trial or Licensed version.
29 Editing thresholds Use to block a port when a state change violation type meets the Fabric OS switch threshold. For 4 Gbps Router, Extension Switches and Blades only, when you apply this threshold on an E Port, the threshold is also applied to the VE Ports (internally by Fabric OS). To edit an State Change threshold, complete the following steps. 1. Select Monitor > Fabric Watch > Port Fencing. The Port Fencing dialog box displays. 2. Select State Change (Fabric OS only) from the Violation Type list.
Removing thresholds 29 5. Click OK on the Port Fencing dialog box. Viewing all thresholds on a specific Fabric OS device NOTE This threshold is only available for Fabric OS devices. NOTE This feature requires a Trial or Licensed version. To view all thresholds assigned to a specific switch, complete the following steps. 1. Select Monitor > Fabric Watch > Port Fencing. The Port Fencing dialog box displays. 2. Right-click anywhere in the Ports table and select Expand. 3.
29 Removing thresholds 1. Select Monitor > Fabric Watch > Port Fencing. The Port Fencing dialog box displays. 2. Select a threshold type from the Violation Type list. 3. Select the object with the threshold you want to remove in the Ports table. 4. Click the left arrow. NOTE If the selected object inherits a threshold assignment from an object higher in the tree, you cannot remove the threshold.
Chapter FICON Environments 30 In this chapter • FICON configurations . . . . . . . . . . . . . . . . . . . . . . . . . . . . . . . . . . . . . . . . 1299 • Configuring a switch for FICON operation . . . . . . . . . . . . . . . . . . . . . . . . 1300 • Configuring an Allow/Prohibit Matrix . . . . . . . . . . . . . . . . . . . . . . . . . . . . 1307 • Configuring an Allow/Prohibit Matrix manually . . . . . . . . . . . . . . . . . . . .
30 Configuring a switch for FICON operation FIGURE 572 Cascaded configuration, three domains, but only two in a path Configuring a switch for FICON operation This section provides a basic guide for configuring a switch for FICON operation. Procedures assume that the switch is installed and IP addresses are assigned to the switch for discovery and access by the Management application.
Configuring a switch for FICON operation 30 Observe the following best practices: • Always check the version of firmware on a switch • Unless otherwise advised by a certified Fabric OS support professional, always load the most recently qualified firmware. • Before upgrading or downgrading firmware read the upgrade and downgrade considerations in the firmware release notes. 4. If incorporating more than one switch into a fabric, refer to planning steps in “Cascaded FICON fabric” on page 1314. 5.
30 Configuring a switch for FICON operation • Required firmware for the switch. Refer to step 3. • Port addressing. The port address is important because it is implemented in HCD or IOCP. The easiest port addressing scheme is to start from 0x00 at the bottom left of the port card, increment on ports going up the card, then continue starting numbering from the bottom right of the next column of ports. Any port addressing scheme is possible however. 6.
Configuring a switch for FICON operation 30 • Add information for the switch in the IP Address tab and click OK. FIGURE 573 Add Fabric Discovery dialog box (IP Address tab) NOTE Selecting Automatic to use the SNMPv3 profile is recommended. • To manually configure SNMP for discovery, select Manual to activate the SNMP tab, then select the SNMP tab. Fill out the fields as required. .
30 Configuring a switch for FICON operation d. Click Add License. e. Repeat steps b through d for additional licenses. f. Click Refresh to display new licenses in the License tab. 8. As an optional step, manage switch users by selecting the User tab on the Web Works Switch Administration window. Use this tab to add users, change passwords, or perform other steps to manage switch users.
Configuring a switch for FICON operation 30 FIGURE 576 Firmware download 11. Select the switches in the Available Switches panel where you want to download firmware, and then click the right arrow to move them under Selected Switches. 12. Click Download. 13. Select the Repository tab to import new firmware files for downloads. Refer to the “Firmware management” section in Chapter 14, “SAN Device Configuration” for more information on importing firmware. 14.
30 Configuring a switch for FICON operation 18. Define port fencing parameters for the switch using the following steps (optional): NOTE Although this is an optional step, best practice is to configure port fencing. a. Configure thresholds that you require for the switch using steps under the “Adding thresholds” in Chapter 29, “Port Fencing”. Following are recommend parameters for the various thresholds: • C3 Discard Frames = 2 per minute. • Invalid Words = 25 per minute.
Configuring FICON display 30 23. Enable bottleneck detection using the following Fabric OS bottlneckmon commands: • bottleneckmon --cfgcredittools -intport -recover onLrOnly - This command monitors for lost credits on links. This is necessary because occasional errors on links can cause lost credits that can result in IFCCs and poor performance over time.
30 Configuring an Allow/Prohibit Matrix manually • Double-click a configuration file. • Select a configuration file and click the right arrow. A matrix displays in the Allow/Prohibit Matrix panel. The switch ports are displayed on both the vertical axis and horizontal axis. An Allow icon ( ) indicates communication is allowed between the ports, as shown in Figure 577 on page 1308. FIGURE 577 Active Configuration in Allow/Prohibit Matrix panel 4.
Configuring an Allow/Prohibit Matrix manually 30 Two default configurations (Active and IPL) are displayed in a tree structure under the switch. Existing configurations are also displayed. 3. Choose one of the following options: • Double-click a configuration file. • Select a configuration file and click the right arrow. A matrix displays. The switch ports are displayed on both the vertical axis and horizontal axis. An Allow icon ( ) indicates communication is allowed between the ports. 4.
30 Saving or copying Allow/Prohibit Matrix configurations to another device 9. Repeat step 5 through step 8 for each allow or prohibit configuration. 10. Click OK on the Manual Allow/Prohibit dialog box. 11. When you have completed the matrix, click Save if you started with a new matrix, or Save As if you edited a copy of an existing matrix. 12. Click Analyze Zone Conflicts. This operation can be done before or after a configuration is saved.
Saving or copying Allow/Prohibit Matrix configurations to another device 30 FIGURE 579 Save As/Duplicate dialog box 4. Enter a name for the configuration. 5. Enter a description for the configuration. 6. Select the check box for the switch to which you want to save the configuration in the Selected Switch list. 7. Click OK.
30 Activating an Allow/Prohibit Matrix configuration FIGURE 580 Save As/Duplicate dialog box 4. Enter a name for the configuration. 5. Enter a description for the configuration. 6. Select the check box for the device to which you want to save the configuration in the Selected Switch list. 7. Click OK. A message displays stating that the outstanding port configuration is discarded when copying a configuration from the switch with more ports to a switch with fewer ports and vice versa.
Deleting an Allow/Prohibit Matrix configuration 30 FIGURE 581 Activate Matrix Confirmation message 4. Select the Active=Saved check box to save the active configuration as the startup configuration (IPL). 5. Click OK to confirm. If you select the Active=Saved check box, the text [=Active] is appended to the IPL file in the Configure Allow/Prohibit Matrix dialog box. The Active=Saved check box and the IPL filename represent the current state of the Active=Saved Mode (ASM) bit on the switch.
30 Cascaded FICON fabric Changing window arrangement There are three options for the Allow/Prohibit Matrix display on the Configure Allow/Prohibit Matrix dialog box located in the Window Arrangement list above the display. • The matrix definitions may be cascaded (this is the default view). • The matrix definitions may be tiled horizontally. • The matrix definitions may be tiled vertically. Perform the following steps to change the display to the desired format. 1.
Cascaded FICON fabric 30 NOTE To enable DLS, all switches in the fabric must be 8 Gbps or faster and running Fabric OS 6.4 or later. NOTE You must enable FMS mode for logical fabrics running Fabric OS 7.3.0 or later. • (Optional) Turns on FICON Management Server (FMS) mode on all switches. Consider the following information when enabling FMS mode: - If switches are running Fabric OS 7.0 and later, FMS mode will not be enabled unless the switches have an active CUP license.
30 Cascaded FICON fabric FIGURE 582 Configure Cascaded FICON Fabric /Switch dialog box 2. Use the Fabric list to select the fabric you want to configure. NOTE (Fabric OS switches only) All switches in a fabric must be running Fabric OS version 5.3 or later. If a Fabric OS version earlier than version 5.3 is present in the topology, the fabric is not listed. 3. Select the FMS Mode check box to manage the fabric by a host-based management program using FICON CUP protocol.
Cascaded FICON fabric merge 30 • Device-Based enables device-based routing for the fabric if all switches in the fabric are 8 Gbps or greater platforms running Fabric OS 7.1 or later. If these requirements are not met, an error message displays. NOTE Exchange-based routing, port-based routing, or device-based routing is enabled on all switches of the selected fabric. You cannot enable a mixed routing policy. 7. Click OK if you want to proceed.
30 Cascaded FICON fabric merge • Checks the primary and secondary fabrics for any merge issues. • Configures High Integrity Fabric Configuration (HIFC) on the seed switch of the primary and secondary fabric. - SCC policy will be created or modified to limit connectivity to switches from both fabrics. Configures Fabric-Wide Consistency Policy (FWCP) on both fabrics. FWCP is configured in tolerant mode for SCC for an Fibre Channel Routing (FCR) fabric.
Cascaded FICON fabric merge 30 NOTE To enable DLS, all switches in the fabric must be 8 Gbps or faster and running Fabric OS 6.3 or later. • Primary fabric switches will not be disturbed for disruptive operations, such as IDID and APT. Instead, all primary fabric switches will be validated for current routing policies and the same policies will be enabled on all the secondary fabric switches.
30 Cascaded FICON fabric merge NOTE All switches in a fabric must be running Fabric OS version 5.3 or later and must be reachable. If a Fabric OS version earlier than version 5.3 is present in the fabric, the fabric is not listed. NOTE Switches running Fabric OS 6.3 or earlier cannot be merged with switches running Fabric OS 6.4 or later. NOTE For 8 Gbps switches, all switches in the fabric must be 8 Gbps or faster.
Cascaded FICON fabric merge 30 13. Perform the appropriate following action based on whether the connection is a long distance connection: • If it is not a long distance connection, click Next to view the Configure merge screen. Proceed to step 14. • If it is a long distance connection, expand the fabrics under Selected Fabrics to the switch port level. a. Select the E_Ports used for the connection on the local switch and on the remote switch, and click the right arrow.
30 Port groups To resolve merge conflicts, complete the following steps. 1. Select the failed test where the Description column contains the text “Resolvable”. 2. Click Resolve. A “The switches in fabric Name will be disabled prior to making the configuration change. The switches will be reenabled after the configuration changes are applied. Please confirm to proceed.” warning message displays. 3. Click OK on the warning message.
Port groups 30 Creating a port group NOTE At least one switch must be reachable to create a port group. To create a port group, complete the following steps. 1. Select Configure > Port Groups. The Port Groups dialog box displays, as shown in Figure 583 on page 1323. FIGURE 583 Port Groups dialog box 2. Click New. 3. Enter a name for the port group in the Name field. 4. Enter a description for the port group in the Description field. 5.
30 Port groups 1. Select Configure > Port Groups. The Port Groups dialog box displays only port groups defined by you. If a fabric becomes un-monitored, any port groups associated with that fabric do not display in the Port Groups list. Once the fabric becomes monitored again, the associated port groups display in the Port Groups list. For more information about monitoring and un-monitoring fabrics, refer to “SAN Fabric monitoring” on page 51.
Swapping blades 30 9. Click Update. 10. Click OK. Deleting a port group To delete a port group, complete the following steps. 1. Select Configure > Port Groups. The Port Groups dialog box displays. 2. Select the port group you want to delete in the Port Groups list. 3. Click Remove. The selected ports are removed from the Port Groups list. 4. Click OK. Swapping blades NOTE Blade-based port swap is mainly used for FICON and is only applicable for port blades.
30 Swapping blades 4. Select the blade with which you want to replace the first blade from the second Swap Blades list. 5. Select the Enable ports after swap is complete check box to enable ports on the destination blade after the swap is complete. 6. Click OK. NOTE This operation disrupts the traffic on all ports for the selected blades. 7. Click Yes on the confirmation message. Once the swap blade operation is complete, a “success” or “failure” message displays.
Chapter 31 IP Element Manager In this chapter • Element Manager overview . . . . . . . . . . . . . . . . . . . . . . . . . . . . . . . . . . . • Element Manager CLI . . . . . . . . . . . . . . . . . . . . . . . . . . . . . . . . . . . . . . . . • Element Manager interface overview . . . . . . . . . . . . . . . . . . . . . . . . . . . • Web Management interface . . . . . . . . . . . . . . . . . . . . . . . . . . . . . . . . . . . • Web Management interface troubleshooting . . . . . . . . . . . . . . . . .
31 Element Manager CLI Accessing the IP Element Manager CLI The Element Manager CLI uses SNMP to query the login authentication type (for example, Telnet Login or Enable Password Login) that the device uses to create the Telnet session token. If SNMP fails, the Element Manager CLI will not work for that device. To display the Element Manager CLI, complete the following steps. 1. Right-click a device on the Network Objects list or the IP or L2 Topology views and select CLI through Server.
Element Manager interface overview 31 Element Manager interface overview The Element Manager interface provides management and monitoring functions to troubleshoot issues on the Ethernet router series switch running firmware version 5.4 or later. Element Manager is accessible from the Management application and provides the details of the switch and its ports.
31 Element Manager interface overview 4. Element Manager toolbar - Provides quick access to dialog boxes and functions. For more information, refer to “Element Manager toolbar” on page 1332. 5. Port properties list - Displays the port properties for the selected view (Port, Table, or VLAN). For more information, refer to “Displaying port properties” on page 1333. 6. Status bar - Displays the Auto Rediscover progress and last discovered details of the switch.
Element Manager interface overview 31 FIGURE 586 Properties dialog box You can enable and disable port actions as well as access performance monitoring from the Ports tab of the Properties dialog box (Figure 587). Refer to “Port actions” on page 533 for more information.
31 Element Manager interface overview FIGURE 587 Properties dialog box - Ports tab Element Manager toolbar The Element Manager toolbar (Figure 588) is located beneath the switch properties. FIGURE 588 Element Manager - toolbar The Element Manager toolbar provides the following icons and buttons: 1. View list — Select a view (Port, Table, or VLAN) from the list. For more information, refer to “Displaying port properties” on page 1333. 2.
Element Manager interface overview 31 6. Rediscover button — Click to manually refresh the Element Manager and display the latest information from the switch. 7. Auto Rediscover check box — Select the check box to automatically refresh the Element Manager in five-minute intervals. Clear the check box to stop auto-rediscovery. 8. Product List Search — Use to search for a port in the port list. For detailed instructions, refer to “Search” on page 493. 9. Help — Click to display the online help.
31 Element Manager interface overview TABLE 123 Port View and Table View port properties (Continued) Field/Component SFP / Port Optics tab Description Select to display the details of all the SFP and port optics. NOTE: To export SFP details, click the link under the Physical Ports - SFP Details section of Detailed Report. Tx Power The power transmitted by the port in a device. Rx Power The power received by the port in a device. Transceiver Temperature The temperature of the port, in Celsius.
Element Manager interface overview 31 Comparing physical port properties You can compare multiple physical port properties, for example, a healthy port with an offline port. 1. From Port View or Table View, select two or more ports (press Ctrl and click each port). 2. Right-click one of the selected ports, and select Properties. FIGURE 589 Physical port properties For example, in Figure 589, ports 1/1, 1/3, and 1/5 are selected.
31 Element Manager interface overview 1. From VLAN View, select one or more virtual ports and physical ports. 2. Right-click one of the selected ports, and select Properties (Figure 591). FIGURE 591 Physical and virtual port properties The selected port properties are displayed in the Port Properties dialog box, where the selected physical port properties are displayed under the Ports tab and the selected virtual port properties are displayed under the Virtual Interfaces tab, as shown in Figure 592.
Element Manager interface overview 31 Status indicator icons Table 125 describes the icons that are used to indicate the status of a switch, slot, or port. TABLE 125 Status icon Status indicator icons Description Indicates the port is down. Indicates the switch is not reachable. Indicates a degraded link (the switch is reachable but cannot receive SNMP). Indicates an IP slot containing a line card. Indicates an IP slot containing no line card. Indicates a port in an IP slot containing no line card.
31 Element Manager interface overview • Collapse the table. Refer to “Customizing application tables” on page 488 for information on table functions. Performance data You can use the following options to monitor the performance data of a switch: • Real Time Graph/Table • Historical Graph/Table Real-time performance monitoring Real-time performance monitoring allows you to view a snapshot of the current performance data. To monitor the real-time performance of the switch, complete the following steps.
Configure dialog box 31 1. In the Element Manager, right-click a slot (or slots), trunk (or trunks), or port (or ports) and select Performance > Historical Graph/Table. Or Select a slot (or slots), trunk (or trunks), or port (or ports), and select Historical Graph/Table from the Performance button on the Element Manager toolbar, as shown in Figure 594.
31 Management Module switchover A warning message displays: You want to reset the selected interface statistics. Do you want to continue? Click Yes to clear all the statistics of the port. FIGURE 595 Resetting port counters Enable or Disable Enable or disable on a module will perform module power on or off. It is applicable only to the configuration module. To enable or disable a port, right-click a slot (or slots), trunk (or trunks), or port (or ports) and select Enable or Disable.
Switch Fabric Module 31 To access the MR switch over dialog box from Element Manager, right-click a module (or modules), trunk (or trunks), or port (or ports) and select MR Switch Over. FIGURE 596 MR Switch Over The MR Switch Over Status dialog box is displayed and confirms if the Management Module is active (as shown in Figure 597). NOTE MR Switch Over option will be disabled for single Management Module switch.
31 Port mirroring FIGURE 598 Switch Fabric Module Port mirroring Port mirroring analyzes the traffic flowing in a port by monitoring the particular port. Port mirroring helps to monitor the inbound traffic, outbound traffic, or both. Configuring port mirroring 1. Click the Configure icon in the Element Manager toolbar. 2. Select Port Mirroring (as shown in (Figure 599). The Port Mirroring dialog box is displayed (as shown in (Figure 605).
Port mirroring 31 • Right pane (Monitored Ports) — Displays the monitored ports of a device. - Identifier — Displays the ports where traffic must be monitored. - Mode — Displays if the traffic is inbound (TX), outbound (RX), or both. - Add — Adds monitored ports. - Edit — Edits the monitored ports. - Delete — Deletes the monitored ports. Adding a port to port mirroring To add mirror ports in a device, perform the following steps. 1. Select Configure > Port Mirroring.
31 sFlow sFlow The IP Element Manager supports sFlow to capture traffic data and configure sFlow collector. Configuring sFlow in Element Manager 1. Click the Configure icon in the Element Manager toolbar. 2. Select sFlow (as shown in Figure 600). or To access the sFlow from Element Manager, right-click a module (or modules), trunk (or trunks), or port (or ports) and select sFlow. FIGURE 600 sFlow dialog box 3. To configure sFlow, refer to “Configuring sFlow” on page 1688.
VRRP-E: VRRP/ VRRP-E management 31 FIGURE 601 Selecting VRRP/VRRP-E The Manage VRRP/VRRP-E dialog box is displayed (as shown in Figure 602). The Manage VRRP dialog box provides the following buttons to perform various functions. - Add — Adds the VRRP/VRRP-E router configuration. Delete — Deletes the VRRP/VRRP-E router configuration. FIGURE 602 Manage VRRP/VRRP-E dialog box Adding a VRRP/VRRP-E router To add a VRRP/VRRP-E router in an MLX device, perform the following steps. 1.
31 VRRP-E: VRRP/ VRRP-E management Select Add > IPV4 > Basic or Advanced. Or Select Add > IPV6 > Basic or Advanced. The dialog box displays based on the selection of IPV4 or IPV6 with the Basic or Advanced configuration. 3. Enter the Parameters value. Or Click Import to import the predefined parameter values in a comma-separated value (CSV) file. 4. (Optional) Click Preview to list the commands to be executed with replaced parameters. 5. Click OK.
VRF management 31 VRF management The IP Element Manager supports Virtual Routing and Forwarding (VRF) for MLX devices only. The VRF management is supported on the MLX Element Manager using the CLI Configuration Manager. When you launch the VRF dialog, the existing VRF configuration for the selected MLX device is displayed. Configuring VRF in an MLX device 1. Click the Configure icon in the Element Manager toolbar. 2. Select VRF (as shown in Figure 603).
31 VRF management FIGURE 604 Manage VRF dialog box Adding VRF in an MLX device To add VRF in an MLX device, perform the following steps. 1. Select Configure > VRF. The Manage VRF dialog box is displayed. 2. Select Add > IPV4 > Basic or Advanced. Or Select Add > IPV6 > Basic or Advanced. The dialog box displays based on the selection of IPV4 or IPV6 with the Basic or Advanced configuration. 3. Enter the Parameters value.
Web Management interface 31 The dialog box displays based on the selection of IPV4 or IPV6 with the Basic or Advanced configuration. 3. Enter the Parameters value. Or Click Import to import the predefined parameter values in a comma-separated value (CSV) file. 4. (Optional) Click Preview to list the commands to be executed with replaced parameters. 5. Click OK. The deployment details are deleted under the VRF Details pane of the Manage VRF dialog box.
31 Web Management interface FIGURE 605 Web Management interface If the device does not have a supported web interface, an error message displays: “Failed to connect to the web management interface. The product might not support web interface.” Accessing the IP device front panel To display the Element Manager front panel, choose one of the following options: • Select Configure > Element Manager > Front Panel.
Web Management interface troubleshooting 31 Web Management interface troubleshooting Table 126 lists a possible issue and the recommended solution for launching the Web Management interface. TABLE 126 Troubleshooting Problem Resolution The Web Management interface does not launch even when you configure both the IronWare OS products and the Management application server to use HTTPS to launch the Web Management interface.
31 1352 Web Management interface troubleshooting Brocade Network Advisor SAN + IP User Manual 53-1003155-01
Chapter 32 Configuration File Manager and Backup In this chapter • Configuration file manager . . . . . . . . . . . . . . . . . . . . . . . . . . . . . . . . . . . . • Configuration deviation . . . . . . . . . . . . . . . . . . . . . . . . . . . . . . . . . . . . . . . • Change tracking. . . . . . . . . . . . . . . . . . . . . . . . . . . . . . . . . . . . . . . . . . . . . • Configuration snapshots . . . . . . . . . . . . . . . . . . . . . . . . . . . . . . . . . . . . . . • Schedule backup . . . . . .
32 Configuration file manager FIGURE 607 Configuration File Manager dialog box — Product Configurations tab The Configuration File Manager dialog box displays the following information: • Product Name — The name of the backed-up product. • Date — The date when the configuration file was stored in the server and the time when the last backup attempt occurred. • Version — The version of the configuration file. The version number is incremented by one for each new version.
Configuration file manager 32 NOTE The Adaptive backup type is supported only on Network OS devices; it is not supported on the IronWare devices. Manual — Occurs when a user clicks the Save Running/Startup Configuration button. Scheduled — Occurs when backups are regularly scheduled. Startup Config Change Trap — When startup configuration is changed for a device, the Startup Config Change Trap is triggered and the configuration backup is captured.
32 Configuration file manager NOTE The Events Associated with Differences table is blank for configuration files triggered on a Fabric OS DCB device. NOTE The Events Associated with Differences table is blank when you select configuration files from different products. The Events Associated with Differences table is only available when you select two configuration backup files for the same product. List of events (up to 100) associated with the configurations.
Configuration file manager 32 • Export button — Select one or more configurations and click to launch the Export Configuration dialog box, which allows you to export the configurations to a text file. Refer to “Exporting a configuration to a text file” on page 1363 for more information. Saving the configuration status Use the Save Configuration Status dialog box to show the progress of the configuration retrieval for the product you select.
32 Configuration file manager FIGURE 608 Save Configuration Status dialog box 6. Review the progress and status of the configuration retrieval for the products you selected in the Status column and the Status Details field. 7. Click Close to close the dialog box, or click Abort to cancel the operation. Viewing the configuration 1. Click the IP tab. 2. Select Configure > Configuration File > Configuration File Manager. 3. Click the Product Configurations tab. 4.
Configuration file manager 32 • Previous button — Click to display the previous configuration (from current choice) in the Configurations list. • Next button — Click to display the next configuration (from current choice) in the Configurations list. • Export button — Click to export the currently viewed configuration to a text file. Comparing product configurations The Comparison dialog box allows you to display the contents of two configurations side-by-side.
32 Configuration file manager • Change Navigator buttons/legend — The Enabled when there is at least one change between to two compared files. Go to first change button ( ) — Click to move to the first change. Go to previous change button ( ) — Click to move to the previous change. Go to next change button ( ) — Click to move to the next change. Go to last change button ( ) — Click to move to the last change. Number of changes label — Indicates the number of changes.
Configuration file manager 32 6. Click Close. Restoring a configuration 1. Click the IP tab. 2. Select Configure > Configuration File > Configuration File Manager. 3. Click the Product Configurations tab. 4. Select the configuration you want to restore from the Configurations list. To restore configurations for multiple products, select one configuration for each product. 5. Click Restore. If you select to restore a VCS configuration, a message displays.
32 Configuration file manager FIGURE 610 Search Configuration File Manager dialog box 5. Select a product from the Available Products list and click the right arrow button to move one or more products to the Selected Products list. Press Ctrl or Shift and then click each product to select more than one product. 6. Enter a search text string, with a limit of 255 characters, into the Containing Text field. This text string is used to search on configurations of the selected products. 7.
Configuration deviation 32 NOTE To create the product groups, you must have the Configuration Management privilege. 12. Click Close to close the Search Configuration File Manager dialog box. Exporting a configuration to a text file The Export button on the Configuration File Manager dialog box allows you to export the configuration of the selected product to a text file. You must have the Configuration Management privilege in your Management application user account to perform this task.
32 Change tracking Viewing configuration deviation status The Management application enables you to view the configuration deviation status at a glance by providing a configuration deviation status icon on the Status Bar. Point to the configuration deviation status icon on the Status Bar. Depending on the status, one of the following status icons displays.
Change tracking 32 FIGURE 611 Configuration File Manager dialog box - Change Tracking tab The Configuration Change Tracking list displays the following information: • Name — The product name and IP address. • Baseline Time — The date and time when the baseline configuration for the device was copied into the repository of the management server. • • • • Backup Time — The time when the last backup attempt occurred for the selected device. Change Status — The change status of the latest device backup.
32 Change tracking NOTE The Adaptive backup type is supported only on the Network OS devices; it is not supported on the IronWare devices. - Startup Config Change Trap — Occurs when a startup configuration is changed. - Manual — Occurs when a user clicks the Save Running/Startup Configuration button.
Change tracking TABLE 128 32 Configuration change events for Adaptive backup (Continued) Message ID Type Description FABR-1014 LOG Indicates that the switch received an RBridge ID other than the one it requested. The port was disabled because the requested insistent RBridge ID could not be obtained. FABR-1030 LOG Indicates that the RBridge ID has changed. FABR-1041 LOG Indicates that a link reset was received before the completion of the trunking protocol on the port.
32 Change tracking TABLE 128 1368 Configuration change events for Adaptive backup (Continued) Message ID Type Description NSM-2006 DCE Indicates that the specified port-profile has been removed successfully. NSM-2007 DCE Indicates that the port-profile configuration mode has been enabled on the specified interface using the port-profile-port command.
Change tracking TABLE 128 32 Configuration change events for Adaptive backup (Continued) Message ID Type Description NSM-2032 DCE Indicates that the specified port-profile has been removed successfully. NSM-2033 DCE Indicates that the VLAN sub-profile has been deleted successfully. NSM-2034 DCE Indicates that the Fibre Channel over Ethernet (FCoE) sub-profile has been deleted successfully. NSM-2044 DCE Indicates that the specified domain is created.
32 Change tracking TABLE 128 1370 Configuration change events for Adaptive backup (Continued) Message ID Type Description SFLO-1003 LOG Indicates that the global sFlow sampling rate has been changed to the specified value. SFLO-1004 LOG Indicates that the global sFlow counter sampling interval has been changed to the specified value. SFLO-1005 LOG Indicates that the sFlow sampling rate has been changed on the specified port.
Change tracking TABLE 128 32 Configuration change events for Adaptive backup (Continued) Message ID Type Description SWCH-1007 LOG Indicates that the specified switch port is disabled due to the reason displayed in the message. UDLD-1000 LOG Indicates that the UniDirectional Link Detection (UDLD) protocol is enabled globally. UDLD-1001 LOG Indicates that the UniDirectional Link Detection (UDLD) protocol is disabled globally.
32 Configuration snapshots TABLE 128 Configuration change events for Adaptive backup (Continued) Message ID Type Description ZONE-1042 LOG The effective configuration has been disabled. ZONE-1043 LOG The Default Zone access mode is set to No Access. Configuration snapshots The Configuration File Manager dialog box - Configuration Snapshots tab, allows you to compare two configuration snapshots; for example, the pre-configuration and post-configuration snapshots. 1. Click the IP tab. 2.
Configuration snapshots 32 • CLI Template — The name of the snapshot template used for the pre- or post-snapshot deployment. • Status — The snapshot status 4. Click the following buttons to access the corresponding dialog boxes: • Search button — Click to launch the Search Pre/Post Snapshots dialog box, which allows you to search the contents of snapshots in the repository of the management server. Refer to “Searching the Configuration File Manager” on page 1361 for more information.
32 Configuration snapshots FIGURE 613 Compare dialog box The Compare dialog box displays the following information: • Product — The IP address of the device. • Date — The Displays the date the device configuration was taken. • Change Navigator buttons/legend — The Change Navigator buttons and legends are enabled when there is at least one change between two compared files.
Configuration snapshots 32 • Match Case check box — Click to render the search case-sensitive. • Repeats check box — Click to continue the search at the top when the bottom is reached. • Whole Words check box — Click to continue the search. Displays the combination of Highlight, Match Case, and Repeats searches. 6. Click Close. Generating a configuration snapshot report If the configuration snapshot list is too long, you can condense the list by running a report.
32 Configuration snapshots • Change — The device configuration deployment included both pre- and post-configuration snapshot options. There is a difference between the pre-configuration snapshot and the post- configuration snapshot. • No Change — The device configuration deployment included pre-configuration and post-configuration snapshots. There is no difference between the two snapshots. • Error — An error was encountered in one or more devices during the deployment of the snapshots.
Configuration snapshots 32 • Snapshot Type — The type of snapshot generated. There are three types: Manual: Generated manually by clicking the Save Snapshot button on the Backup Configuration Manager. Pre-Snapshot: Generated before the new configuration was deployed to the device. Post-Snapshot: Generated after the new configuration was deployed to the device. CLI Command — The name of the device-monitoring template from the CLI Configuration Manager used for the pre- or post-snapshot deployment.
32 Configuration snapshots 7. Click OK to save the configuration snapshot. The Save Snapshot Status dialog box displays details of the backup status. • Backup Status list — Displays the product name and IP address, as well as the progress and status of the configuration save. • Status Details — Displays details of a pending configuration save. Click Abort to abort a pending configuration save.
Schedule backup 32 Press Ctrl or Shift and then click each product to select more than one product. 6. Enter a search text string, with a limit of 255 characters, into the Containing Text field. This text string is used to search on snapshots of the selected products. Press Ctrl or Shift and then click each product to select more than one product. 7. Enable the following options, as required: • Match Case check box - Select the check box to make the search case-sensitive.
32 Schedule backup NOTE The Management application enables you to save the same switch configuration to the repository using two methods: on demand (Configure > Configuration File > Save), on defining a schedule (Configuration File> Schedule Backup), or by defining the adaptive backup support (Resync or Adaptive). To schedule a configuration backup, complete the following steps. 1. Click the IP tab. 2. Select Configure > Configuration File > Schedule Backup.
Schedule backup 32 • Day of the week - If you selected Weekly as the frequency type, select the day from the list. • Day of the month - If you selected Monthly as the frequency type, select the day of the month from the list. 6. Click OK. The new schedule appears in the Backup Scheduler list of the Schedule Backup dialog box. When scheduled backups begin, the Management application polls each product to check its current configuration. NOTE Software image backup is not initiated on VDX or VCS devices.
32 1382 Schedule backup Brocade Network Advisor SAN + IP User Manual 53-1003155-01
Chapter 33 IP Configuration Wizard In this chapter • Configuration requirements . . . . . . . . . . . . . . . . . . . . . . . . . . . . . . . . . . . • Payloads . . . . . . . . . . . . . . . . . . . . . . . . . . . . . . . . . . . . . . . . . . . . . . . . . . . • Creating a payload configuration . . . . . . . . . . . . . . . . . . . . . . . . . . . . . . . • Duplicating a payload configuration. . . . . . . . . . . . . . . . . . . . . . . . . . . . . • Modifying a payload configuration . . . . . . . . .
33 Payloads Payloads Payloads are defined as product payloads or interface payloads. Product payloads are deployed to the devices, whereas interface payloads are deployed to ports. The available payloads are listed in Table 129. TABLE 129 Payloads available for deployment Payload name Description Product Payloads: 1384 802.1Q Tag Type Sets the tag type, or tag ID, that identifies the aggregate VLAN.
Creating a payload configuration TABLE 129 33 Payloads available for deployment (Continued) Payload name Description TACACS+ Servers Indicates which TACACS/TACACS+ servers are to be used for authentication. Telnet Sets Telnet password and idle timeout value, and enables Telnet authentication on devices for use with AAA authentication. Time Zone/SNTP Specifies the time zone and specifies whether the date and time are to be set by an SNTP server clock.
33 Creating a payload configuration FIGURE 619 Configuration dialog box - Select Payload pane 3. Select Product Payloads or Interface Payloads, and select the payloads you want to configure. You can include more than one payload in a configuration. See Table 129 on page 1384 for a brief description of the payloads. 4. Click Next. The next pane that displays depends on the payloads you are configuring. For example, Figure 620 shows the next pane for the SNMP Identification payload.
Creating a payload configuration 33 FIGURE 620 Configuration dialog box - Product Payload - SNMP Identification pane 5. Enter the required information for the payload and click Next. Click Help for detailed information on each payload you can define. After all of the payloads you have selected are configured, the Deployment Targets pane displays, as shown in Figure 621 on page 1388.
33 Creating a payload configuration FIGURE 621 Configuration dialog box - Deployment Targets pane 6. In the Available Targets list, select the products, product groups, and IP subnets to which the payload configuration is to be deployed. • To select a target, expand the entry to display the entries under it, click the target in the Available Targets list, and click the right-arrow button to move it to the Selected Targets list. If the target is not on the list, run the discovery process.
Creating a payload configuration 33 FIGURE 622 Configuration dialog box - Deployment Properties pane 8. Select one of the persistence properties. • Don’t Save to Flash or Reload Select this option if you just want to update the device running configuration. The payload configuration is not saved to the device flash memory, nor is the device rebooted when the payload configuration is deployed.
33 Creating a payload configuration 9. (Optional) Enter the following information if you want the Management application to run and save a report before or after this configuration is deployed to the device. a. Select the Pre-Deployment check box if you want the Management application to run and save a report before this configuration is deployed. b. Select the Post-Deployment check box if you want the Management application to run and save a report after this configuration is deployed. c.
Creating a payload configuration 33 12. Select Save Without Scheduling Deployment or Schedule Deployment. If you select Schedule Deployment, select the frequency, time, and date parameters for the deployment. 13. Click Next. The Summary Page pane displays, as shown in Figure 624. FIGURE 624 Configuration dialog box - Summary Page pane 14. Review the information on the Summary Page pane. • The Deployment and Targets tab shows the deployment definition and the targets in the configuration.
33 Duplicating a payload configuration Duplicating a payload configuration You can create a payload configuration by copying an existing configuration. 1. Select Configure > Configuration Wizard. 2. Select a configuration from the Product Configurations list. 3. Click Duplicate. The Copy Configuration dialog box displays. 4. Enter a name for the new payload configuration.
Modifying a payload configuration 33 FIGURE 625 Configuration dialog box - Select Payload pane for editing a configuration 4. Add or remove payloads in the configuration. • To add a payload to the configuration, select either Product Payloads or Interface Payloads, and then select the payload you want to add. • To remove a payload from the configuration, clear the check box of the payload. Note that a configuration must have at least one payload.
33 Deploying a payload configuration Deploying a payload configuration Payload configurations are deployed to targets in one of the following ways: • On a scheduled basis, if a deployment schedule has been set up for the configuration. • On demand, if Save Without Scheduling Deployment is selected in the Deployment Schedule pane of the Configuration Wizard. Configurations can be manually deployed when required.
Chapter 34 CLI Configuration Management In this chapter • CLI configuration overview . . . . . . . . . . . . . . . . . . . . . . . . . . . . . . . . . . . . • Viewing existing templates . . . . . . . . . . . . . . . . . . . . . . . . . . . . . . . . . . . . • Product configuration templates . . . . . . . . . . . . . . . . . . . . . . . . . . . . . . . . • Changing product credentials. . . . . . . . . . . . . . . . . . . . . . . . . . . . . . . . . . • Importing parameter values into a configuration . . .
34 Viewing existing templates Configuration requirements Before you use the CLI Configuration, you should meet the following requirements: • Telnet or SSH (or both) must be selected on the Management application server to match the protocol(s) with the devices. For more information about configuring Telnet or SSH, refer to “Product communication settings” on page 215.
Product configuration templates 34 Product configuration templates You can create, modify, duplicate, delete, verify, and deploy a product configuration from the CLI Configuration dialog box. Product configurations allow you to create device configuration by entering a set of configuration CLI commands. To view a list of existing configurations, refer to “Viewing existing templates” on page 1396. For information about the example templates, refer to “CLI Templates” on page 2221.
34 Product configuration templates 4. Click the Target tab and complete the following steps. FIGURE 627 CLI Configuration Template dialog box - Target tab a. Select the devices to which you want the configuration deployed from the Available Targets table. The Available Targets table displays an inventory of the available product targets and includes the same detail as the Product List (refer to “IP Product List” on page 474).
Product configuration templates 34 5. Click the CLI Commands tab and complete the following steps. FIGURE 628 CLI Template dialog box - CLI Commands tab a. (Configuration templates only) Select the Evaluate CLI responses check box to validate the CLI commands. You can add a dash (-) to the beginning of a CLI command to ignore command validation even when you select the Evaluate CLI responses check box.
34 Product configuration templates c. To enter a parameter for a CLI command, select the parameter type from the CLI Commands list - Parameters folder and click the right arrow to move the parameter type to the CLI Commands text area. Parameters use the following format: $, where name is the parameter and data_type is the type of parameter.
Product configuration templates c. 34 Enter a value for each parameter in the associated field. Note that the Target column remains visible at all times in the Parameters table. Fields containing a green triangle ( ) in the lower right corner are editable. The fields only accepts valid values base on the parameter data type. Parameters include the following options: • • • • String — Enter a string with a maximum of 64 ASCII characters. Integer — Enter an integer with a maximum of 12 numeric characters.
34 Changing product credentials 11. Click OK. The Deployment Status dialog box displays, which allows you to view the progress and status of the deployment. Click Abort to stop the deployment. NOTE The abort action does not stop the tasks that have already started. When deployment is complete, click Report to view the CLI Deployments Report. 12. Click Close to close the Deployment Status dialog box. NOTE Closing the Deployment Status dialog box does not stop deployment.
Importing parameter values into a configuration 34 2. Enter the user name for the product in the Product Login Account - Username field. NOTE If Telnet is used to log in to the device and Telnet only requires a password, then enter the password in the Password field and leave the Username field blank. 3. Enter the password for the product in the Product Login Account - Password field. 4.
34 Previewing CLI commands TABLE 130 Different values for each target #Description of the template. This template provides different values for each target.. Target, LOOPBACK_INTERFACE|INTEGER, OSPF_AREA|INTEGER LOOPBACK_INTERFACE_IP|STRING 10.20.30.100, 1, 4, loopback1, 10.20.30.200, 2, 5, loopback2, Layer 2 Switch Products, 3, 6, loopback3, TABLE 131 Same value for each target #Description of the template. This template provides different values for each target..
CLI command guidelines 34 CLI command guidelines When adding CLI commands to the configuration, use the following guidelines: • Only configuration templates can be added to a template defined in the CLI Template dialog box. • Templates can be nested and the same template can be included several times as long as it does not cause a circular dependency. • Targets for deployment are only retrieved from the template you create, not any included templates.
34 CLI command guidelines • Click Deploy to deploy the configuration to the selected targets. Click Yes on the confirmation message. If you selected the Prompt for additional targets during manual deployment check box, the Target tab of the Deployment of Configuration_Name dialog box displays. Continue with step 6. If the configuration contains parameters that must be defined, the Deployment of Configuration_Name dialog box displays with a list of all parameters in the deployment. Go to step 7. 6.
Testing a configuration 34 • Click Deploy to deploy the configuration to the selected targets. Click Yes on the confirmation message. If you selected the Prompt for additional targets during manual deployment check box, the Target tab of the Deployment of Configuration_Name dialog box displays. Continue with step 6. If the configuration contains parameters that must be defined, the Deployment of Configuration_Name dialog box displays with a list of all parameters in the deployment. Go to step 7. 6.
34 Valid and invalid responses from devices 5. Edit the mode and the parameter values (refer to step 6), as needed. The Deployment Status dialog box displays detailing whether the configuration will deploy successfully. 6. Click Close to close the Deployment Status dialog box. Valid and invalid responses from devices When you deploy a configuration to a device, some commands may send responses back to the Management application.
Valid and invalid responses from devices 34 The strings on the left and the right side of the equal sign are Unicode regular expressions used for pattern matching. The expression on the left is matched against the command string, while the expression on the right is matched against the messages returned by the command that matches the pattern on the left.
34 Valid and invalid responses from devices Editing the Motorola Controller CLI responses properties file The MotorolaControllerCliResponse.properties file is under the Install_Home\conf\cli directory. Edit the file using a text editor. You can add a success response between the SUCCESS_RESPONSE_START and SUCCESS_RESPONSE_END tags using the following Unicode regular expressions format. #Success Map SUCCESS_RESPONSE_START ^su[port]*\s+s[witchd]*\s+=.*First Failure Data Capture.*enabled.
Deleting a configuration 34 NOTE If the response message does not fall in any of the categories above, it is treated as a success response from the device and stops the validation process. Using a dash character in CLI Configuration manager You can override how the Management application treats messages without editing the CLI responses properties file. To do this, enter a dash (-) at the beginning of each configuration line.
34 CLI configuration deployment 2. Select one or more configurations to delete in the Templates table and click Delete. 3. Click Yes on the “Do you want to delete?” message to confirm. 4. Click Close to close the CLI Configuration dialog box. CLI configuration deployment Deploy the configuration using one of the following methods: • At a scheduled date and time Schedule a configuration deployment in the CLI Template dialog box.
CLI configuration deployment 34 NOTE Closing the Deployment Status dialog box does not stop deployment. To check the results of the deployment in the Product CLI Report, refer to “CLI deployment reports” on page 1421. For details about valid and invalid responses when you deploy a configuration, refer to “Valid and invalid responses from devices” on page 1408.
34 Monitoring configurations Monitoring configurations You can create, modify, duplicate, and delete a monitoring configuration from the CLI Configuration dialog box. Monitoring configurations allow you to create device reports by entering a set of show CLI commands. To view a list of existing configurations, refer to “Viewing existing templates” on page 1396. For information about the example templates, refer to “CLI Templates” on page 2221.
Monitoring configurations 34 4. Click the Targets tab and complete the following steps. FIGURE 633 CLI Template dialog box - Target tab a. Select the devices to which you want the configuration deployed from the Available Targets table. You can deploy the configuration to individual devices, devices in a device group, or devices in an IP subnet.
34 Monitoring configurations 5. Click the CLI Command tab and complete the following steps. FIGURE 634 CLI Template dialog box - CLI Commands tab d. Enter the show commands in the CLI Commands text area. NOTE Only commands listed in the cliShowCommands.properties file can be entered for a monitoring configuration. For more information, refer to “Configuration error checking” on page 1411. For a list of guidelines to use when entering CLI commands, refer to “CLI command guidelines” on page 1405.
Monitoring configurations f. 34 Edit the parameter by entering the variable or character string you want to use for the parameter in place of the name variable. NOTE Each parameter must be unique. The Management application does not check for duplicate parameters. show interface ethernet $ In the example, show interface ethernet is the CLI command, port is the parameter variable, SLOT_PORT is the parameter type, and [Slot#]/Port# is the format for the port number. g.
34 Monitoring configurations c. Enter a value for each parameter in the associated field. Fields containing a green triangle ( ) in the lower right corner are editable. The fields only accepts valid values base on the parameter data type. Parameters include the following options: • • • • String — Enter a string with a maximum of 64 ASCII characters. Integer — Enter an integer with a maximum of 12 numeric characters. Slot/Port — Enter the slot number and port number.
Monitoring configurations 34 11. Click OK. The Deployment Status dialog box displays, which allows you to view the progress and status of the deployment. Click Abort to stop the deployment. NOTE The abort action does not stop the tasks that have already started. When deployment is complete, click Report to view the CLI Deployments Report. 12. Click Close to close the Deployment Status dialog box. NOTE Closing the Deployment Status dialog box does not stop deployment.
34 Monitoring configurations 8. Click OK. The Deployment Status dialog box displays, which allows you to view the progress and status of the deployment. Click Abort to stop the deployment. NOTE The abort action does not stop the tasks that have already started. When deployment is complete, click Report to view the CLI Deployments Report. 9. Click Close to close the Deployment Status dialog box. NOTE Closing the Deployment Status dialog box does not stop deployment.
CLI deployment reports 34 8. Click OK. The Deployment Status dialog box displays, which allows you to view the progress and status of the deployment. Click Abort to stop the deployment. NOTE The abort action does not stop the tasks that have already started. When deployment is complete, click Report to view the CLI Deployments Report. 9. Click Close to close the Deployment Status dialog box. NOTE Closing the Deployment Status dialog box does not stop deployment.
34 CLI configuration scheduling 3. Choose one of the following options: • To display a report for one device, click the IP address of the device on the list. • To display a report that includes all devices for which the report was generated, click the name of the report in the Template Name column. The Product CLI Report displays. To export a report refer to “Exporting and saving IP reports to a file” on page 2066.
CLI configuration scheduling 34 Configuring a daily deployment schedule To configure a daily deployment schedule, complete the following steps. 1. Select Daily from the Frequency list. 2. Select the time of day you want deployment to run from the Time (hh:mm) lists. Where the hour value is from 1 through 12, the minute value is from 00 through 59, and the day or night value is AM or PM. To finish configuring the deployment schedule, return to step 8 of “Creating a new product configuration” on page 1397.
34 CLI configuration scheduling Configuring a yearly deployment schedule To configure a yearly schedule, complete the following steps. 1. Select Yearly from the Frequency list. 2. Select the time of day you want deployment to run from the Time (hh:mm) lists. Where the hour value is from 1 through 12, the minute value is from 00 through 59, and the day or night value is AM or PM. 3. Click the Date list to select a date from the calendar.
Chapter 35 Image Repository for IP Products In this chapter • Obtaining software files . . . . . . . . . . . . . . . . . . . . . . . . . . . . . . . . . . . . . . • Products supporting the image import . . . . . . . . . . . . . . . . . . . . . . . . . . • Boot image management . . . . . . . . . . . . . . . . . . . . . . . . . . . . . . . . . . . . . • Software image management . . . . . . . . . . . . . . . . . . . . . . . . . . . . . . . . . • Unified image management . . . . . . . . . . . . . . . . . .
35 Products supporting the image import Products supporting the image import Table 132 lists the products that support the boot images, software images, and unified images.
Boot image management 35 • Delete — Deletes the boot or monitor image from the Management application. • Help — Provides information about the boot image feature. • Update — Updates the firmware images by way of the Firmware Management dialog box. NOTE The image features discussed in this section are available only to the products listed in “Products supporting the image import” on page 1426.
35 Boot image management d. Enter the label for the image in the either the Image Label field or the User Defined Label field. These fields allow from 1 through 32 alphanumeric characters and allow the following special characters: underscore (_), period (.), and hyphen (-). The image file name excludes the file extension. For example, if the file name is M2B07504.bin, the Image Label is M2B07504. Enter additional information for the image in the User Defined Label field.
Software image management 35 Software image management Software images are program files other than boot, monitor, or unified images. You can manage software images using the following Management application modules: • Discovery — Copies software images from IronWare products on the network into the Management application. • Backup Scheduler — Copies software images from IronWare products on a regularly scheduled basis.
35 Software image management After the import completes successfully, you see a message that the software image imported successfully. The Software Image tab lists the image version and the image label.
Software image management 35 You can change the default schedule from the Backup Scheduler by performing the following tasks. 1. Click the IP tab. 2. From the Management application menu bar, select Configure > Configuration > Schedule Backup. or Right-click Configuration > Schedule Backup. The Schedule Backup dialog box displays, as shown in Figure 636. FIGURE 636 Schedule Backup dialog box 3. Select the automatic software image backup task from the list, and click Edit.
35 Unified image management 1. Click the Software Images tab on the Firmware Management dialog box. 2. Select the software image that you want to delete. 3. Click the Delete button. A confirmation warning displays. 4. Click Yes to continue with the delete, or No to cancel it. Unified image management Unified images contain all images required to manage the product. Instead of upgrading each type of image separately, you can use a unified image to upgrade all image types.
Unified image management 35 FIGURE 638 Firmware Management dialog box - Unified Firmware Images tab The Unified Firmware Images tab contains the following buttons: • Import — Opens a dialog box that allows you to browse and select the unified image file you want to import into the Management application. Newly imported images are saved to the Management application. • Delete — Deletes the unified image from the Management application.
35 Unified image management NOTE You must install the Management application on an external FTP server or SCP server to activate the Import Firmware Image from File dialog box. 6. In the Import Firmware Image from File field, enter the location of the unified image, or click Browse to search for an existing image file. The image file can be in one of the following formats: .tar, .gz, .zip, or .bin. 7.
Unified image management 35 Updating unified images Use the Firmware Management dialog box to update firmware images. You can access the Firmware Management dialog box using he following method. 1. Select Configure > Firmware > Management. 2. Click the Unified Firmware Images tab on the Firmware Management dialog box. 3. Click Update. For NetIron CER/CES devices running 5.4, when deploying the simplified firmware image from 5.4 to 5.5, complete the following steps. 1.
35 Unified image management 1. Select Configure > Firmware > Management. The Firmware Management dialog box displays. 2. Click the desired Image tab and click Update. The Product Payload- Image Update: Software pane displays. 3. Click Next. The Deployment Target pane displays, as shown in Figure 639. FIGURE 639 Firmware Management dialog box - Deployment Targets pane 4.
Unified image management 35 FIGURE 640 Firmware Management dialog box -Summary Page pane 9. Review the information on the Summary Page pane. • The Deployment And Targets tab shows the deployment definition and the targets in the configuration. The Selected Targets list in table format allows you to verify to which devices the payloads in the configuration are deployed. • The Configuration tab summarizes the payloads in the configuration you have created. 10. Click Deploy.
35 Serial firmware update and activation for Network OS devices Serial firmware update and activation for Network OS devices With Network OS release 4.0, you can update and activate firmware on an entire cluster (either logical chassis mode or fabric cluster mode), on selected nodes in the cluster, or on nodes in standalone mode, by performing the following steps. 1. Click the IP tab in the upper-left corner of the Management application. 2.
Chapter 36 VLAN Management In this chapter • VLAN Manager . . . . . . . . . . . . . . . . . . . . . . . . . . . . . . . . . . . . . . . . . . . . . . • Port VLANs . . . . . . . . . . . . . . . . . . . . . . . . . . . . . . . . . . . . . . . . . . . . . . . . . • Spanning Tree Protocol configuration . . . . . . . . . . . . . . . . . . . . . . . . . . . • VLAN routing . . . . . . . . . . . . . . . . . . . . . . . . . . . . . . . . . . . . . . . . . . . . . . .
36 VLAN Manager Private VLAN NOTE PVLAN read-only support is provided. Private VLAN (PVLAN) provides device isolation through the application of Layer 2 forwarding constraints. PVLAN allows end devices to share the same IP subnet while being isolated at Layer 2. This enables network designers to employ larger subnets and thereby reduce the address management overhead.
VLAN Manager 36 FIGURE 643 Remote Switch Port Analyzer Transparent LAN Support Transparent LAN Support (TLS) supports the VLAN group rather than an individual VLAN. The TLS service provided is associated with a single transparent VLANs that represents all the VLAN in a group. When Transparent LAN Support (TLS) is assigned to a Virtual Fabric VLAN, the ports that are tagged to TLS allow you to configure multiple cTags.
36 VLAN Manager Displaying a list of VLANs To view the list of VLANs that were discovered on the network, select Configure > VLANs. The VLAN View tab of the VLAN Manager dialog box displays. The VLAN Manager tool bar contains the following buttons: • • • • Add — Launches the Add VLAN dialog box. Edit — Launches the Edit VLAN dialog box. Delete — Launches the Delete VLAN dialog box. STP — Allows you to configure STP, RSTP, MSTP, PVST, or RPVST information for a product, port, or VLAN.
VLAN Manager 36 VLAN Manager tabs VLAN Manager has three views: • VLAN view Displays distinct Layer 2 broadcast domains by VLAN ID. If FDP or LLDP is not enabled on a device, each VLAN from each device is displayed in separate folders by VLAN ID. If FDP or LLDP is enabled on the devices, a VLAN folder shows device connectivity on the Layer 2 broadcast domains. If there are super-aggregated VLANs that have been configured on the network, VLANs are grouped by their super-aggregated VLAN memberships.
36 VLAN Manager FIGURE 645 VLAN Manager dialog box - VLAN View tab To view the VLANs or products in the VLAN View tab, complete the following steps. 1. Click the VLAN View tab in the VLAN Manager dialog box. 2. Expand the folder under the VLAN View tab, then double-click a super-aggregated VLAN to display its port VLANs or products. VLANs are listed by their topologically distinct broadcast domains.
VLAN Manager 36 • Port Type — A description of the type of interface on the product, for example, ETHERNET_INTERFACE or VIRTUAL_INTERFACE. • Port Name — The name of the interface, if one was configured. • Port Mode — Indicates the tag mode of the interface. Tagged represents the port is in dual mode but is in the tagged state for that particular VLAN. Untagged represents the port is untagged for that particular VLAN. The third port mode is Converged. • STP — Indicates whether STP is enabled or disabled.
36 VLAN Manager FIGURE 646 VLAN Manager dialog box - Product View tab 2. Expand a product to display the port VLANs that have been configured on that product. 3. Click a VLAN in the list to display the interfaces on that product that belong to the VLAN. 4. Click MAC Group IDs to display the MAC group address (Figure 647). The MAC group address dialog box is displayed.
VLAN Manager 36 Enabling or disabling the VCS Virtual Fabric mode To enable or disable the VCS Virtual Fabric mode, complete the following steps. 1. Select Configuration Manager > VLAN Manager. The VLAN Manager dialog box with the VLAN View option displays (as shown in Figure 648). 2. In the Ports list, select a product and click Manage. FIGURE 648 VLAN Manager dialog box - VLAN View option The Manage VCS Virtual Fabric dialog box displays (as shown in Figure 649).
36 Port VLANs Port VLANs VLAN Manager facilitates the creation, modification, and deletion of port VLANs on products that are known to the Management application. It also aids in the bulk deployment of these VLANs. For example, VLAN 3 can be configured on four products. If the VLAN definition for VLAN 3 is modified, the new definition can be deployed to all four products at one time.
Port VLANs 36 4. Click the Load Products button. Products that already have the entered VLAN IDs configured on them are automatically moved to the Selected Products list. The Load Products button is disabled by default. 5. Under the Available Products list, select one or more products to which the VLAN will be assigned. You can also use the Search tool to find ports. 6. Click the right arrow button to move your selection to the Selected Products list. 7.
36 Port VLANs The Select Classifiers button is disabled by default. To enable the button, select an untagged and classifier-configured port in the Selected Ports list.. FIGURE 651 Select Classifier Groups dialog box NOTE The cTag classifier list is disabled when Untagged is selected.
Port VLANs 7. 36 Click the Untag button and click the left arrow to assign the port as an untagged port to the selected VLAN. The Selected Ports list shows the interface listed under the VLAN to which it was assigned. 8. Select the same interface from the Available Ports list. 9. Select another VLAN from the Select VLANs list. 10. Click the Tag button and click the right arrow to assign the port as a tagged port to the second VLAN.
36 Port VLANs FIGURE 652 Add VLAN dialog box — Properties tab 2. Click the VLAN View option to view the products to which the VLANs are to be deployed, or click the Product View option to display the VLANs that are to be deployed to that product. 3. Select the Fabric OS (FOS) VLAN, IronWare (IOS) VLAN, or Network OS (NOS) VLAN type from the Target Context list. You must select only one VLAN type. If multiple VLAN types are selected, the target context becomes the default and an error message displays. 4.
Port VLANs 36 • Transparent VLAN Flooding (NetIron 5.4 and later) — Selecting this check box allows packets to be forwarded without any form of CPU intervention including MAC learning and MAC destination lookups. NOTE Because this feature floods all VLAN packets in hardware, it is not expected to work in conjunction with routing functions. For FOS VLAN properties: - Name — Displays the name of the VLAN, which is editable.
36 Port VLANs Deleting port VLANs from products Deleting a port VLAN removes all the interfaces on a product from that VLAN. A port VLAN can be deleted in both the VLAN and Product views. Deleting a port VLAN in VLAN view 1. On the VLAN Manager dialog box, select VLAN View. 2. Select the VLAN to be deleted. You can select multiple VLANs by holding down the Ctrl and Shift keys and clicking the VLAN nodes. 3. Click Delete to launch the Deploy VLANs dialog box. 4.
Spanning Tree Protocol configuration 36 4. Enter a description in the Description field that will be used to identify the configured VLAN. 5. Click the Schedule check box, which is available if you selected Schedule as a deployment option, to select a frequency. 6. Click the Snapshots check box if you want the Management application to run and save a report after this configuration is deployed to the device. You can run snapshots before and after deployments only for IronWare products.
36 Spanning Tree Protocol configuration 1. Perform one of the following tasks to select the VLAN on which STP or RSTP will be configured: • On the VLAN View tab, expand the list of VLANs and select one or multiple VLANs on which STP or RSTP will be configured. • On the Product View tab, expand the product, product group, or IP subnet folder that contains the products on which the VLAN you want is configured.
Spanning Tree Protocol configuration TABLE 135 36 Spanning tree configuration matrix (Continued) Target context STP type NOS VLAN MSTP NOS Port STP, RSTP, MSTP, PVST, and RPVST 4. Select the type of Spanning Tree Protocol from the Spanning Tree list. 5. Select the Enable check box if you want to enable the protocol you selected. 6. Enter a value in the Priority field to identify the root bridge in a spanning tree (instance of STP).
36 Spanning Tree Protocol configuration 1. Select a deployment option: • Click the Deploy now option if you want to deploy the STP configuration. • Click the Save deployment only option if you want to save the STP configuration without scheduling its deployment. • Click the Schedule option if you want to schedule the deployment of the STP configuration. 2. Select a Save Configuration option: • Click the Save to running option to save the configuration while the system is running.
Spanning Tree Protocol configuration 36 FIGURE 654 STP Configuration dialog box (with MSTP selected) 5. Select the Enable check box if you want to enable MSTP. 6. Enter a value in the Priority field to identify the root bridge in a spanning tree (instance of MSTP). The bridge with the lowest value has the highest priority and is the root. A higher numerical value means a lower priority; thus, the highest priority is 0. The values range from 0 through 61440. The default is 32768. 7.
36 VLAN routing Assigning an MSTP instance to a VLAN NOTE For Network OS products in standalone mode, you can configure from 1 through 31 MSTP instances and for Fabric OS DCB switches, you can configure from 1 through 15 MSTP instances; for the Fabric OS converged 10 GbE switch module for the IBM BladeCenter, you can configure from 1 through 31 MSTP instances. 1. Click the STP button on the VLAN Manager dialog box to display the STP Configuration dialog box. 2.
VLAN routing 36 NOTE An SVI is also called a Virtual Routing Interface (VRI) in IronWare OS terms and Virtual Ethernet (VE) in Network OS terms. The SVI in DCB products, VRI in IronWare OS products, and VE in Network OS products are the same. Managing IP addresses on an SVI Switch Virtual Interfaces (SVIs) can be added to port VLANs when you create or modify VLAN definitions. SVIs can only be created in Layer 3 products.
36 VLAN routing • Primary or Secondary options (DCB products only) — Indicates whether the IP address is the primary or secondary IP address of the VLAN. • Type — Select the type of IP address you want to assign to the VLAN. Choose CIDR or IP/Subnet. • Enter the IP address in the fields provided: - If you chose the CIDR format, enter a subnet address in the subnet_address/subnet_mask_bits format (for example, 192.168.2.10/24).
Chapter 37 MPLS Management In this chapter • MPLS pre-configuration. . . . . . . . . . . . . . . . . . . . . . . . . . . . . . . . . . . . . . . • MPLS licensing . . . . . . . . . . . . . . . . . . . . . . . . . . . . . . . . . . . . . . . . . . . . . • MPLS overview. . . . . . . . . . . . . . . . . . . . . . . . . . . . . . . . . . . . . . . . . . . . . . • LSP . . . . . . . . . . . . . . . . . . . . . . . . . . . . . . . . . . . . . . . . . . . . . . . . . . . . . . .
37 MPLS licensing 7. Create VLL instances using the Customer-facing ports using the Management application (refer to “VLL manager” on page 1488). 8. Create VPLS instances using the Customer-facing ports using the Management application (refer to “VPLS Manager” on page 1504). MPLS licensing The following are MPLS capable products: • Ethernet Backbone router, Ethernet Core router, and Ethernet router running version 5.0.
MPLS overview 37 The following conditions must be met for inclusion in the MPLS Licensed and Configured Products product group: • Your version of the Management application supports MPLS. • Adding the product does not exceed the MPLS product license limit. For more information about how the Management application counts MPLS products, refer to Brocade Network Advisor Software Licensing Guide.
37 LSP 1. Select the Set option to set the selected settings in the product configuration. This creates a new configuration newly or overwrites the existing configuration. Unset removes the settings. NOTE To enable MPLS on the target devices, select the Set option then click Add and complete the wizard. 2.
LSP 37 In addition to the topology information in the TED, the product considers attributes and requirements specified in configuration statements for the LSP. The LSP allows you to specify and adjust many of the parameters used when the product calculates a traffic-engineered path for a signalled LSP, including the following: • • • • • • An RSVP signalled LSP address for the egress LER. Explicit path to be used by the LSP. Bandwidth required by the LSP. Setup priority for the LSP. Metric for the LSP.
37 LSP 3. Use the View selector to choose between displaying by Product or Admin Group ID. - Product - The product view shows a tree structure under Products/Admin Groups with products at the top level. Click the product name to expand the tree and display any associated admin groups. - ID - The ID view groups admin group instances by admin group ID. An admin group instance may be configured in multiple products, so the same product may be displayed under different admin group IDs. 4.
LSP 37 4. Select a path to display the path name in the Name field, the Product name in the Product field, and the Hop Details. The Hop Details include the following: - Hop IP Address - The IP addresses for all the defined hops are listed. Hop Type - Either Strict or Loose. Strict means that the node must be directly connected to the previous node on the Hop Details list. Loose, means that there may be one or more hops between the previous node on the Hop Details list.
37 LSP 5. Click LDP Configuration to launch the LDP configuration wizard. Viewing saved LSP configurations Take the following steps to view all saved LSP configurations. 1. Select Configure > MPLS > LSP. 2. Select the Saved Configurations tab (Figure 661). FIGURE 661 LSP dialog box, Saved Configurations tab Saved LSP configurations are listed by name, description, payload, and deployment schedule.
LSP 37 Adding an LSP admin group MPLS interfaces can be organized into administrative groups (admin groups). Typically, an admin group is used to identify a network segment. You can use admin groups to manage CSPF path selection by including or excluding network segments identified as admin groups. If you include an admin group, only those segments in that admin group are selected. If you exclude an admin group, that admin group is excluded from CSPF path selection.
37 LSP FIGURE 663 Add Admin Groups Configuration dialog box, Deployment Properties pane 8. Select the desired properties. 9. Click Deploy. Editing an LSP admin group You can edit an LSP admin group by taking the following steps. 1. Select Configure > MPLS > LSP. 2. Select the Admin Groups tab. 3. Select the admin group you want to edit. 4. Click the Edit button. The Edit Admin Group Configuration dialog box of the Admin Group Configuration wizard displays (Figure 662).
LSP 37 Deleting an LSP admin group You can delete an LSP admin group by taking the following steps. 1. Select Configure > MPLS > LSP. 2. Select the Admin Groups tab. 3. Select the admin group to be deleted. 4. Click the Delete button. The Delete Admin Group Configuration dialog box of the Admin Group Configuration wizard displays. 5. Click on a series of Next buttons to deploy. Adding an LSP path An LSP path is a list of router hops across an MPLS domain. Paths are configured separately from LSPs.
37 LSP 5. Click the Add button. Use the Up and Down buttons to move the selected hop higher or lower in the table. An empty line is added under Hop Details. The first entry is always considered to be the local node and the Ingress LER. LER nodes should be then be added in order from Ingress to Egress. If you need to change the order, you can select an entry and use the Up and Down arrows to change its position. Actual routing depends on whether or not Type is set to Strict or Loose.
LSP 37 Duplicating an LSP path When you want to add a new LSP path, you can save work by duplicating an existing path and editing the name and any other parameters you may want to change. You can duplicate an LSP path by taking the following steps. 1. Select Configure > MPLS > LSP. 2. Select the Paths tab. 3. Select the path you want to duplicate. 4. Click the Duplicate button. The Path Configuration dialog box of the Path Configuration wizard displays (Figure 664).
37 LSP Configuring advanced RSVP LSP settings Resource Reservation Protocol (RSVP) can be used to send signalling messages to each LSR in the LSP to reserve resources and cause labels to be dynamically associated with interfaces. This enables you to engineer network traffic routing to avoid points of congestion and make efficient use of high bandwidth interfaces.
LSP 37 8. Click Advanced Settings to establish traffic engineering parameters. The RSVP LSP Advanced Settings dialog box has three tabs: Global, Paths, and Fast Reroute. The default view is the Global tab (Figure 667). FIGURE 667 RSVP LSP Advanced Settings Global tab From the Global tab you can set the following: - Adaptive checkbox - Select the Adaptive checkbox to allow you to change parameters while an LSP is in enabled state.
37 LSP You can place selected admin groups into any of the following categories: • Include All - An interface must be a member of all selected groups. • Include Any - An interface is included if it is a member of any of the selected groups. • Exclude All - Interfaces in the selected groups are excluded. - Bidirectional Forwarding Detection (BFD) check box - This check box allows you to enable or disable BFD.
LSP - 37 Path Select Mode - The choices are Manual and Unconditional. If Manual is chosen, traffic is shifted to an alternate path only if the selected path fails. If the path recovers, traffic is shifted back. If Unconditional is chosen, the traffic stays on the selected path even if the path fails. If you do not want to specify a path select mode or want to remove the configured path select mode, select None. • Primary - Selected by default.
37 LSP • Maximum Rate - Sets the maximum data rate supported for data bursts above the mean rate. • Maximum Burst - Sets the maximum number of bytes that can be handled at the maximum rate. - Use LSP for OSPF shortcuts - Enables the use of traffic engineering data carried in OSPF extensions that contain information about the interface’s metric, bandwidth reservations, and admin group memberships. - Use LSP for IS-IS shortcuts - Enables you to configure the IS-IS shortcut parameters.
LSP a. 37 Use the Primary Path Select button to display the Path Selector dialog box (Figure 670). FIGURE 670 Path Selector dialog box b. Select the path you want to use as the primary path from Available Paths, and use the right arrow to move the path to Selected Paths. c. Click OK. Secondary paths for the LSP are listed under Paths. Use the Add and Delete buttons to add or delete a secondary path. Use the up and down arrows to move entries up and down in the table. 10.
37 LSP From the Fast Reroute tab you can configure an LSP to request a facility backup provided by a bypass LSP in the event of a failure along the LSP path. Each LSR in an LSP except the egress router may act as a Point of Local Repair (PLR). If a failure occurs on an LSP, the PLR tries to initiate a bypass LSP to provide a backup route for the protected path. The PLR then becomes the ingress of a bypass LSP. The bypass LSP carries the traffic of the LSPs it protects around the break.
LSP 37 Editing an RSVP LSP You can edit an RSVP LSP by taking the following steps. 1. Select Configure > MPLS > LSP. 2. Select the RSVP LSP tab. 3. Select the RSVP LSP you want to edit. 4. Click the Edit button. The RSVP LSP Configuration dialog box of the RSVP LSP Configuration wizard displays (Figure 666). Refer to “Configuring advanced RSVP LSP settings” for a description of how to use the RSVP LSP Configuration wizard.
37 LSP FIGURE 673 Delete RSVP Configuration wizard 5. Click a series of Next buttons to deploy the payload. Editing a saved LSP configuration You can edit a saved LSP configuration by taking the following steps. 1. Select Configure > MPLS > LSP. 2. Select the Saved Configuration tab. 3. Select the saved configuration 4. Click the Edit button.
LSP 37 Deleting a saved LSP configuration You can delete a saved LSP configuration by taking the following steps. 1. Select Configure > MPLS > LSP. 2. Select the Saved Configuration tab. 3. Select the saved configuration 4. Click the Delete button. Displaying LSP Topologies Refer to the View Management chapter for descriptions for topology map layout options and navigation aids. You can display topology maps for configured LDP and RSVP LSPs by taking the following steps. 1.
37 LSP FIGURE 675 LSP Topology View Options 4. Use the LSP Type selector to limit the display to RSVP LSPs Only or LDP Tunnels Only. If you right-click on an LSP, three options are displayed (Figure 676).
MPLS Virtual Leased Line (VLL) overview 37 • Select Drill-down to LSP Hops Topology to display LSPs and hops as a line from the ingress router with an arrow to indicate direction. Operationally enabled LSPs are shown with a solid line. Operationally disabled LSPs are shown with a dotted line. • Select LSP Ping to launch the LSP Ping dialog box. • Select LSP Traceroute to launch the LSP Trace Route dialog box.
37 VLL manager The PE router pushes two labels onto the packet: • The inner VC label is used for determining what happens to the packet once it reaches the VLL peer. This label is significant only to the VLL peer. • The outer tunnel label is used for forwarding the packet through the MPLS domain. This label corresponds to an RSVP-signalled tunnel LSP. After applying the two labels to the packet, the PE router forwards it to the next LSR in the tunnel LSP. 3.
VLL manager 37 1. Select Configure > MPLS > VLL. 2. Select the VLL Manager Views tab (Figure 678).
37 VLL manager 3. You can filter output by name or by VCID by using the selector next to the VLL field. - You can use an Asterisk (*), as a wildcard character if you select By Name. You can enter individual VCIDs or a range of VCIDs if you select By VCID. NOTE If you choose By VCID you can search only for remote VLLs (VLLs whose endpoints are on two different products), but not for local VLLs (VLLs whose endpoints are on the same product). 4.
VLL manager • • • • 37 All peers are up. All peers are down. Some peers are down. VCID - The VCID of the VLL. Endpoint Settings display the following information about the A Endpoint and Z Endpoint of the selected VLL in the fields below: • • • • Name - The endpoint device name and IP address. COS - Class of Service associated with the endpoint. VLL Mode Tagged: A VLAN ID tag is added to the packets on the ingress router.
37 VLL manager FIGURE 679 VLL Manager Saved Configurations tab 3. You can use the Name field to filter output by configuration name. You can use an Asterisk (*) as a wild card character. 4. Click the Get button to begin the search. Configurations that match the filter criteria display under Saved Configurations, showing the configuration ID, the configuration name, and the RBAC user name that created the configuration. 5.
VLL manager 37 Adding or editing a VLL instance To add a new VLL instance do the following: 1. Select Configure > MPLS > VLL. 2. Select either the Views tab or the Saved Configurations tab. 3. Click the Add button. The VLL Configuration wizard Target Selector dialog box displays (Figure 680). FIGURE 680 VLL Manager Target Selector dialog box 4. Enter a name for the endpoint in the Name field. The name must be unique on each product and cannot contain spaces, asterisks (*), or question marks (?). 5.
37 VLL manager 11. Click Next. The VLL Configuration wizard Product Configuration dialog box displays (Figure 681). FIGURE 681 VLL Configuration wizard Device Configuration dialog box NOTE If you are configuring a local VLL, you cannot make changes to this dialog box. If you are configuring a non-local VLL, select a device from the device list. Configuring devices using the VLL Manager 1. From the Product Configuration pane of the VLL Configuration Wizard, click each device entry.
VLL manager 37 3. Click Next. The VLL Configuration wizard Port Configuration dialog box displays (Figure 682). FIGURE 682 VLL Configuration wizard Port Configuration dialog box The last discovered port settings for VLLs are displayed in the Discovered Endpoint Settings table. You can make changes to the settings in the Configured Endpoint Settings table. 4.
37 VLL manager • You can only define one dual tagged endpoint per port. • You cannot define a dual tagged endpoint on a port if there is a 802.1ag configuration defined on the port. c. For tagged ports only, enter a VLAN ID for the customer end point in the Inner VLAN ID field. Packets with this VLAN ID are transmitted out the specified interface. d. From the COS list, select a COS for the port. This field applies only to local VLLs. 5. Click Apply. If any of the endpoints 6. Click Next.
VLL manager 37 FIGURE 684 VLL configuration wizard Deployment Properties Deploying VLL properties using the VLL Manager 1. From the Deployment Properties pane of the VLL Configuration Wizard, under Persistence Properties, chose one of the following: - Do not Save to Flash or Reload - Use this option if you want to update the running configuration. The payload configuration is not saved to the device flash memory, nor is the device rebooted when the VLL configuration is deployed.
37 VLL manager 3. Click Next. If you did not select Save configuration on the Deployment Properties dialog box, the Summary dialog box displays (Figure 686), and you may skip to step 1. If you selected Save configuration on the Deployment Properties dialog box, the Deployment Schedule dialog box displays (Figure 685). Refer to “Scheduling deployment using the VLL Manager” on page 1498. FIGURE 685 VLL configuration wizard Deployment Schedule dialog box Scheduling deployment using the VLL Manager 1.
VLL manager 37 2. Click Next. The VLL configuration wizard Summary dialog box displays (Figure 686). FIGURE 686 VLL configuration wizard Summary dialog box Reviewing the VLL Manager summary 1. From the Summary pane of the VLL Configuration Wizard, review the VLL configuration wizard Summary information. The Deployment and Targets tab displays the information you entered on the previous pages. The Configuration tab displays the configuration in CLI format. Reviewing the VLL Manager configuration 1.
37 VLL manager Creating a new VLL instance using duplicate To create a new VLL instance using duplicate, do the following. 1. Select Configure > MPLS > VLL. 2. Select either the Views tab or the Saved Configurations tab. 3. Select the instance you want to duplicate from the list of VLL instances. 4. Click the Duplicate button. The Target Selection dialog box displays. 5. The text Source_Name_Copy is displayed for Name. Enter a unique name for the new instance.
VLL manager 37 Filtering VLL traffic monitoring The VLL Manager Monitor dialog box allows you to monitor traffic on VLLs. 1. Select Monitor > MPLS > VLL. The VLL Monitor Dialog box displays (Figure 687). FIGURE 687 VLL Monitor dialog box 2. You can filter output by name or by VCID by using the selector next to the VLL field. - You can use an Asterisk (*), as a wildcard character if you select By Name. You can enter individual VCIDs or a range of VCIDs if you select By VCID.
37 Virtual Private LAN Services (VPLS) overview 5. Click the Get button to begin the search. VLLs that match the filter criteria display under VLL Instances. NOTE If a VLL is from a device that is not covered by the MPLS license, the row is grayed out. You will not be able to edit that VLL, but you can delete it from the device. The VLL Instances table shows the following information: - VCID of the VLL - In Packets - Number of packets received by the A Endpoint.
Virtual Private LAN Services (VPLS) overview 37 CE Device Customer A R2 R3 R1 CE Device CE Devices Customer A MPLS Domain Customer A VLAN 200 VLAN 100 Customer B Customer B CE Devices VLAN 200 VLAN 100 R4 FIGURE 688 VPLS configuration with two customer VPNs Unlike a Virtual Leased Line (VLL), a VPLS instance can have multiple endpoints. The PE device performs local and remote VLAN tag translation, so that multiple VLANs can be specified under a single VPLS instance.
37 VPLS Manager VPLS Manager The VPLS Manager allows you to manage VPLS instances. You can perform the following tasks from the VLL manager: • View current VPLS instances and peer topologies. • View VPLS configurations. • Add, edit, duplicate, or delete VPLS instances. NOTE When configuring VPLS, a check is made to determine if there are LSPs configured for the target products. You may proceed with configuration, but an LSP is needed for a working connection.
VPLS Manager 37 3. To specify new filter criteria, select By Name or By VCID from the VPLS list. You can use the following to filter the VPLS instances: • Asterisk (*) as a wildcard character if you select By Name. • Individual VCIDs or a range of VCIDs, separating each entry with a comma if you selected By VCID. 4. Click Get to begin the search. Information about products that match the search criteria displays under VPLS Settings, PE Products, and Endpoints on the Details tab.
37 VPLS Manager FIGURE 690 VPLS Manager Peer Topology tab Viewing Saved VPLS configurations To view current VPLS configurations, do the following: 1. Select Configure > MPLS > VPLS. 2. Select the Saved Configurations tab (Figure 691).
VPLS Manager 37 FIGURE 691 VPLS Manager Saved Configurations tab 3. You can use the Name field to filter output by configuration name. You can use an Asterisk (*) as a wild card character. 4. Click Get to begin the search. Configurations that match the filter criteria display under Saved Configurations, showing the configuration ID, the configuration name, and the name of the user that created the configuration.
37 VPLS Manager • Endpoints table — Displays the following information: Endpoints — Names and IP addresses of the endpoint devices. Tag Mode — Tagged if a VLAN tag is used. Untagged if a VLAN tag is not used. Outer VLAN ID — Present if the Tag Mode for the endpoint is Tagged. The service provider end point tag. Inner VLAN ID — Present if the Tag Mode for the endpoint is Tagged. The customer end point tag. L2 Status — Displays whether L2 is up or down. 5.
VPLS Manager 37 6. Use the right arrow button to move the port to the Selected Endpoints box. Make sure you select two endpoints from two different devices. NOTE The device folder lists all MPLS capable devices, whether or not they are covered by your MPLS license. If you select an MPLS capable device that in not covered by your MPLS license, you will not be able to configure VPLS services for that device.
37 VPLS Manager c. You can select the IP address of the peer by clicking the drop down arrow for Peer IP address. By default, the ingress IP address of a tunnel is selected. d. Enter the maximum number of MAC entries that the VPLS instance is allowed to learn. Determine the range of values you can enter by checking the configuration guide for your device. 3. Click Next. The Port Configuration page displays (Figure 694).
VPLS Manager 37 FIGURE 695 VPLS Configuration wizard Deploy Target Action dialog box The VPLS instance name and VCID are shown in the Name and VCID fields. Deploying target actions using VPLS Manager 1. From the Deploy Target Actions pane, the Endpoint Targets column lists the names and IP addresses of the devices to which the VPLS instance will be deployed. Expand the folder for a device to display any VLANs and ports to which the VPLS instance will be deployed.
37 VPLS Manager FIGURE 696 VPLS Configuration wizard Deployment Properties dialog box Deploying VPLS properties using VPLS Manager 1. From the Deployment Properties pane, choose one of the following persistence properties: - Do not Save to Flash or Reload - Use this option if you want to update the running configuration. The payload configuration is not saved to the device flash memory, nor is the device rebooted when the payload configuration is deployed.
VPLS Manager 37 FIGURE 697 VPLS Configuration wizard Deployment Schedule dialog box Scheduling deployment using VPLS Manager 1. If the Deployment Schedule dialog box displays, select from the following deployment options: - Save without scheduling deployment - saves the payload configuration without a deployment schedule. - Schedule Deployment - enables you to schedule a time for deployment using the Frequency, Time (hh:mm), and Date selectors. 2. Click Disable Schedule to disable a schedule.
37 VPLS Manager FIGURE 698 VPLS Configuration wizard Deployment Summary dialog box Reviewing the VPLS Manager summary 1. On the Deployment and Targets Summary pane, review the summary information. The Deployment and Targets tab displays the information you entered on the previous pages. The Configuration tab displays the configuration in CLI format. 2. Click the Previous to return to pages that you want to modify. Click Cancel to cancel the configuration. When you have finished, click Next.
VPLS Manager 37 4. The next available VCID in the VCID pool is automatically placed in the VCID field. You can change the VCID if desired as long as it is not used in a current VLL instance. 5. Modify any of the remaining values in the instance by following the procedure presented in “Adding or editing a VPLS instance” on page 1508. NOTE The device folder under Available Endpoints lists all MPLS capable devices, whether or not they are in the All MPLS Licensed and Configured Devices group.
37 VPLS Manager Filtering for VPLS traffic monitoring The VPLS Manager Monitor allows you to filter and monitor VPLS traffic. 1. Select Monitor > MPLS > VPLS. The VPLS Monitor dialog box displays (Figure 699). FIGURE 699 VPLS Monitor dialog box 2. You can filter output by name or by VCID by using the selector next to the VPLS field. - You can use an Asterisk (*), as a wildcard character if you select By Name. You can enter individual VCIDs or a range of VCIDs if you select By VCID. 3.
VCID pools 37 VCID pools VCID pools contain VCID that can be used in a VLL or VPLS instance. You may create a combined VCID pool containing VCIDs that are shared by VLL and VPLS, or you may create a segmented VCID pool that provides separate VCID pools for VLL and VPLS configurations. Viewing, creating, and deleting VCID pools To view a VCID Pool and to create or delete VCID pools, do the following: 1. Select Configure > MPLS > VCID Pool. The VCID Pool dialog box displays (Figure 700).
37 802.1ag Connectivity Fault Management 5. Edit the Start and End fields to specify the desired range of VCIDs. You can use any numbers between 1 to 4294967294. If you are creating a segmented pool, be sure the VLL and VPLS VCIDs do not overlap. 6. Click OK. 802.1ag Connectivity Fault Management 802.1ag Connectivity Fault Management (CFM) is an IEEE standard used to define protocols and practices for Ethernet Operations, Administration, and Maintenance (OAM). 802.
802.1ag Connectivity Fault Management 37 1. Choose one of the following options: • From the VPLS Manager dialog box, Views tab, choose one of the following options: Select a device from the VPLS Peer Status/VPLS Name/VCID list and click 802.1ag CFM. Select the Peer Topology tab and right-click a device in the topology and select 802.1ag CFM. From the VLL Manager dialog box, Views tab, select an instance from the VLL Instances table and click 802.1ag CFM.
37 802.1ag Connectivity Fault Management 12. Select the MEP direction from the Direction list. Options include: • Up — Select to set the MEP direction away from the monitored VLAN. • Down — Select to set the MEP direction towards the monitored VLAN. 13. Click the right arrow button to move the defined MEP to the Selected Maintenance End Points table.
802.1ag Connectivity Fault Management 37 18. Click Close on the Configure 802.1ag CFM dialog box. Editing a maintenance association You can access 802.1ag CFM from the following features: • VPLS Manager (requires the IP - MPLS – VLL prvilege with read-write or read-only permission) • VLL Manager (requires the IP - MPLS – VPLS prvilege with read-write or read-only permission) • VLAN Manager (requires the VLAN Manager prvilege with read-write or read-only permission) NOTE 802.
37 802.1ag Connectivity Fault Management 9. To add a MEP, complete the following steps. a. Select a product from the Product list. The list contains all products that are part of the VPLS. b. Select a VLAN ID from the VLAN ID list. The list contains all VLAN IDs in the VPLS. c. Select a port from the Port list. The list contains all VPLS end-points for the selected VLAN ID. d. Enter a unique identifier for the end-point in the End Point ID field. Valid values include 1 through 8191. e.
802.1ag Connectivity Fault Management 37 11. Click OK on the Edit Maintenance Association dialog box. The Deploy to Products dialog box displays. 12. Select one of the following options: • Save to running — Select to update the running configuration; however, the deployment is not saved to the product’s flash memory. • Save to running and startup — Select to update the running configuration as well as save the deployment configuration to the product’s flash memory.
37 802.1ag Connectivity Fault Management NOTE You cannot configure an 802.1ag CFM on a maintenance end point (MEP) configured with dual tagged VLANs. To add a MEP to an existing maintenance association, complete the following steps. 1. Click 802.1ag CFM. The Configure 802.1ag CFM dialog box displays. 2. Select the maintenance association you want to edit in the Maintenance Association Details table. 3. Click Edit. The Edit Maintenance Association dialog box displays. 4.
802.1ag Connectivity Fault Management 37 10. Click OK on the Edit Maintenance Association dialog box. The Deploy to Products dialog box displays. 11. Select one of the following options: • Save to running — Select to update the running configuration; however, the deployment is not saved to the product’s flash memory. • Save to running and startup — Select to update the running configuration as well as save the deployment configuration to the product’s flash memory.
37 802.1ag Connectivity Fault Management NOTE You cannot configure an 802.1ag CFM on a maintenance end point (MEP) configured with dual tagged VLANs. To edit a MEP in an existing maintenance association, complete the following steps. 1. Click 802.1ag CFM. The Configure 802.1ag CFM dialog box displays. 2. Select the maintenance association you want to edit in the Maintenance Association Details table. 3. Click Edit. The Edit Maintenance Association dialog box displays. 4.
802.1ag Connectivity Fault Management 37 • Save to running and startup then reboot — Select to update the running configuration, save the deployment configuration to the product’s flash memory, and reboot the product. Selecting this option is the equivalent to entering a write memory and a reload command on the product CLI. 13. Click OK on the Deploy to Products dialog box. The Deployment Status dialog box displays.
37 802.1ag Connectivity Fault Management • Select the Peer Topology tab and right-click a device in the topology and select 802.1ag CFM. - From the VLL Manager dialog box, Views tab, select an instance from the VLL Instances table and click 802.1ag CFM. - From the VLAN Manager dialog box - VLAN View or Product View, select a VLAN from list and click 802.1ag CFM. The Configure 802.1ag CFM dialog box displays. 2. Select the maintenance association in the Maintenance Association Details list.
802.1ag Connectivity Fault Management 37 To delete a maintenance association, complete the following steps. 1. Right-click a device and select 802.1ag CFM. The Configure 802.1ag CFM dialog box displays. 2. Select one or more maintenance associations you want to delete in the Maintenance Association Details table. 3. Click Delete. A confirmation message displays with a Delete the maintenance domain? check box. Make sure that the check box is selected. 4. Click Yes on the confirmation message.
37 802.1ag Connectivity Fault Management 4. Select the MEP for which you want to check the status of remote MEPs in the Maintenance End Points (MEP) table. 5. Click Connectivity. The 802.1ag CFM Connectivity dialog box displays. 6. Review the connectivity details: • • • • • • • • • • 7. Source Product - The product that contains the selected MEP. Domain - The domain of the selected MEP. Association - The maintenance association of the selected MEP. Source MEP - The port number of the selected MEP.
802.1ag Connectivity Fault Management 37 1. Choose one of the following options: • From the VPLS Manager dialog box, Views tab, choose one of the following options: Select a device from the VPLS Peer Status/VPLS Name/VCID list and click 802.1ag CFM. Select the Peer Topology tab and right-click a device in the topology and select 802.1ag CFM. From the VLL Manager dialog box, Views tab, select an instance from the VLL Instances table and click 802.1ag CFM.
37 802.1ag Connectivity Fault Management • VPLS Manager (requires the IP - MPLS – VLL prvilege with read-write or read-only permission) • VLL Manager (requires the IP - MPLS – VPLS prvilege with read-write or read-only permission) • VLAN Manager (requires the VLAN Manager prvilege with read-write or read-only permission) NOTE 802.1ag CFM is only supported on IronWare Ethernet Routers devices running firmware release 5.2 or later. NOTE You cannot configure an 802.
802.1ag Connectivity Fault Management 37 8. Enter the number of hops to allow before dropping the packet in the Time to Live (TTL) field. The time to live value is decremented by each router that forwards the message. The message is dropped if the time to live reaches zero. The time to live value can be from 1 through 64 hops. 9. Click Execute to send the linktrace message. The details of the hop display in the Hop Details table. 10.
37 802.1ag Connectivity Fault Management 1. Choose one of the following options: • From the VPLS Manager dialog box, Views tab, choose one of the following options: Select a device from the VPLS Peer Status/VPLS Name/VCID list and click 802.1ag CFM. Select the Peer Topology tab and right-click a device in the topology and select 802.1ag CFM. From the VLL Manager dialog box, Views tab, select an instance from the VLL Instances table and click 802.1ag CFM.
Chapter 38 VIP Servers In this chapter • VIP Servers overview . . . . . . . . . . . . . . . . . . . . . . . . . . . . . . . . . . . . . . . . . • Viewing the VIP Servers. . . . . . . . . . . . . . . . . . . . . . . . . . . . . . . . . . . . . . . • Viewing VIP Server information. . . . . . . . . . . . . . . . . . . . . . . . . . . . . . . . . • Enabling or disabling servers or server ports . . . . . . . . . . . . . . . . . . . . . • Server port statistics . . . . . . . . . . . . . . . . . . . . . . . . .
38 Viewing the VIP Servers FIGURE 701 VIP Servers dialog box The View list allows you to select which real server, real server port, virtual server, or virtual server ports you want to view. For detailed information, refer to “Viewing VIP Server information” on page 1537. The VIP Servers list displays the ServerIron devices that have been discovered by the Management application ports, and information about the real server or virtual server.
Viewing VIP Server information 38 Viewing VIP Server information 1. From the View list on the VIP Servers dialog box, select which ports you want to view from the following options: • Real server ports view of the virtual server, shown in Figure 702 • Virtual server ports view of the real server, shown in Figure 703 • Real server view of the virtual server, shown in Figure 704 on page 1538 2.
38 Viewing VIP Server information FIGURE 704 Real server view of the virtual server The following fields describe the components in the VIP Servers list on the VIP Servers dialog box. VIP Servers list • The name and IP addresses of the real server or virtual server. • The name or port numbers of the real server port or virtual server port. • Only the servers in a Management application user’s AOR are listed in the list.
Enabling or disabling servers or server ports 38 Enabling or disabling servers or server ports If you have the VIP Server Manager privilege with read-write permission, you can enable and disable real servers, virtual servers, real server ports, and virtual server ports. If you have the VIP Server Manager Leaf Node privilege with read-write permission, you can enable and disable only the server leaf nodes.
38 Server port statistics • • • • • RX Packets — The number of packets received by the port. TX Packets — The number of packets transmitted by the port. RX Bytes — The number of bytes received by the port. TX Bytes — The number of bytes transmitted by the port. Last Update — The date and time when information for the server was updated.
Chapter 39 Global Server Load Balancing In this chapter • GSLB Manager. . . . . . . . . . . . . . . . . . . . . . . . . . . . . . . . . . . . . . . . . . . . . . . • GSLB policy management. . . . . . . . . . . . . . . . . . . . . . . . . . . . . . . . . . . . . • GSLB site management . . . . . . . . . . . . . . . . . . . . . . . . . . . . . . . . . . . . . . • GSLB zone configuration. . . . . . . . . . . . . . . . . . . . . . . . . . . . . . . . . . . . . . . • Controller configuration . . . . . . . . .
39 GSLB Manager Viewing the GSLB Manager To view the GSLB Manager, perform the following steps. Select Configure > Application Delivery > GSLB. The Policy Configuration tab in the GSLB dialog box, shown in Figure 705, displays. FIGURE 705 GSLB dialog box - Policy Configuration tab The GSLB dialog box displays the following buttons: • • • • Add — Creates a new GSLB policy, site, or zone definition and a new controller configuration. Edit — Modifies existing GSLB Manager definitions and configurations.
GSLB policy management 39 GSLB policy management A GSLB policy allows a GSLB ServerIron ADX product to evaluate each IP address in a DNS reply, based on defined criteria called metrics. The GSLB ServerIron ADX product can reorder the list of addresses and place the IP address for the best site at the top of the list. Creating a GSLB policy To create a GSLB policy, perform the following steps. 1. Select Configure > Application Delivery > GSLB. 2. Click the Policy Configuration tab.
39 GSLB policy management FIGURE 706 Policy Configuration dialog box - Metrics tab 4. Provide the following information on the Policy Configuration dialog box. a. Enter a policy name for the GSLB policy in the Policy Name field. The combination of a GSLB policy name and the Management application user who created it must be unique. b. Select the policy type from the Policy Type list. Options include the Global or Host policy types. c.
GSLB policy management e. 39 Select the tie breaker method from the Tie Breaker list. This value is used in case multiple addresses pass the policy criteria without one address emerging as the best choice: • Least Response: Selects the address of the site that has been selected least often in previous DNS responses. Note: ADX-type products do not support the Least Response tie-breaker method.
39 GSLB policy management To apply policy metrics, perform the following steps. 1. Click the Metrics tab on the Policy Configuration dial box. 2. Select the order from the Metric Order list. Metric order is the order in which the GSLB ServerIron ADX product applies the policy metrics: • Default Order: Metrics are applied in a fixed order as defined in the GSLB ServerIron ADX product. • Select Order: Metrics are applied in the order specified in this parameter. 3.
GSLB policy management 39 FIGURE 707 Policy Configuration dialog box - Prefix tab 3. Enter the IP address and select a location from the Location list. If you select NONE for the location, the prefix is considered static. If you select any other location, the prefix is considered geographical (Geo). Static prefixes never age out, but geographical prefixes are dynamic and can age out. Deleting a prefix from the Prefix list 1. Click the Prefix tab on the Policy Configuration dialog box. 2.
39 GSLB policy management 5. Enter a list of prefix networks and locations in the text box. Each entry should be on a separate line, and separate the prefix network and location with a comma. The location must be one of the following: • • • • • Asia Europe North America South America None If the location is None, it is added as a static prefix. 6. Select one of the following options: • Overwrite: Deletes and replaces any prefix in the list. • Append: Adds to the prefixes in the list.
GSLB site management 39 GSLB site management The Site Configuration dialog box allows you to configure a GSLB ServerIron ADX product with site parameters. A GSLB site contains GSLB ServerIron ADX products that belong to that site. Click the Site Configuration tab on the GSLB dialog box to view the GSLB sites that have been defined for the system, and perform one of the following tasks: • Click Add to create a new GSLB site. • Select an existing GSLB site, and click Edit if you want to modify it.
39 GSLB site management NOTE The weight of the ServerIron ADX product displays in the IP Weights list of the Add Hosts dialog box. Adding ServerIron ADX products to the site You must add at least one site ADC/ADX product to create a site configuration. 1. Click the Add button. When you click Add, a row is added to the Site ADCs list. The ServerIron ADX products that the Management application has discovered appear in the Site ADC column.
GSLB zone configuration 39 GSLB zone configuration When you manage GSLB zones, you specify the DNS zone name and the host information (applications) within each zone for which you want the GSLB ServerIron ADX product to provide GSLB. There are no defaults for zone parameters.
39 GSLB zone configuration 2. Enter a name for the zone in the Zone Name field. The combination of a GSLB zone name and the Management application user who created it must be unique. 3. Perform one of the following tasks: • Click the Add button to open the Add Hosts dialog box, where you can add hosts to a zone. • Select the host from the Hosts list, and click Edit to modify information for a host. • Select the host from the Hosts list, and click Delete to delete a host.
GSLB zone configuration 39 • www.brocade.com (HTTP application) • ftp.brocade.com (FTP application) Some e-commerce sites also accept just a zone name as an alias for a specific application within that zone. For example, a site might accept both “www.brocade.com” and “brocade.com” as valid names for the HTTP application on the web host. In this case, the second name has a null host name. No application is explicitly associated with the “brocade.
39 Controller configuration 1. Select the zone you want to delete from the Hosts list of the Zone Configuration dialog box. 2. Click Delete. 3. When the confirmation dialog box appears, click Yes. Editing the list of IP addresses and weights The List of IP Addresses and Weights dialog box allows you to import a list of IP addresses and weights by overwriting existing entries or appending to existing entries. 1. Select Configure > Application Delivery > GSLB. 2. Click the Zone Configuration tab. 3.
Controller configuration 39 a. Click Add to launch the Controller Configuration dialog box, which you use to deploy a policy to a GSLB ServerIron ADX product that is the GSLB controller. b. Select an existing controller configuration and click Edit to modify an existing controller definition. c. Select an existing controller configuration and click Duplicate to create a controller configuration by copying an existing one. d.
39 Controller configuration FIGURE 712 Controller Configuration dialog box 1. Enter a name for the configuration in the Configuration Name field. The combination of a GSLB controller name and the Management application user who created the definition must be unique. 2. Select the ServerIron ADX product from the Controller list that will be the GSLB controller. 3. Select the controller policy from the Controller Policy list that will be deployed to the controller.
Controller configuration 39 NOTE The ServerIron ADX product sends the log messages only to the external syslog servers you have configured on the ServerIron ADX product. The messages do not appear in the ServerIron ADX product syslog buffer. 7. Select the Save to Flash check box if you want this configuration to be saved to the ServerIron ADX product memory when it is deployed to the product. 8.
39 Controller configuration 1. Select Configure > Application Delivery > GSLB. 2. Click the Controller Configuration tab. 3. Select the configuration you want to deploy from the Controller list. 4. Click Deploy. NOTE When you deploy a controller configuration, the Management application deletes all GSLB configurations from the ServerIron ADX product to which the configuration is deployed, and then adds the configuration to the ServerIron ADX product.
Controller configuration 39 4. Provide the following information. a. Click the Save Without Scheduling Deployment option if you want to save the deployment definition without scheduling it. b. Click the Schedule Deployment option if you want to schedule and save the deployment definition. c. Select a schedule type from the Frequency list: • • • • • • One Time Hourly Daily Weekly Monthly Yearly The Time (hh:mm) list appears if you select any schedule type except Hourly. d.
39 1560 Controller configuration Brocade Network Advisor SAN + IP User Manual 53-1003155-01
Chapter 40 SSL Certificates for ServerIron Products In this chapter • SSL certificates . . . . . . . . . . . . . . . . . . . . . . . . . . . . . . . . . . . . . . . . . . . . . • SSL certificate configuration . . . . . . . . . . . . . . . . . . . . . . . . . . . . . . . . . . • Generating a certificate signing request . . . . . . . . . . . . . . . . . . . . . . . . . • Adding an SSL certificate and key file . . . . . . . . . . . . . . . . . . . . . . . . . . . • Editing an SSL certificate and key file .
40 SSL certificate configuration You must have the appropriate user privileges to access SSL Certificates. NOTE SSL Certificates does not generate signed certificates and keys. You can generate a certificate signing request (CSR), but the signed certificates and keys managed by SSL Certificates must be signed by a certificate authority (CA) and must be stored in an accessible location.
SSL certificate configuration 40 The SSL certificates and keys can only be deployed from SSL Certificate Manager to the following SSL-capable IronWare OS devices: • • • • ServerIron with WSM6-SSL module, running software release 10.2.01c or later ServerIron with WSM6-SSL-Slave module, running software release 10.2.01c or later ServerIron 4G-SSL (Stackable), running software release 10.2.01c or later ADX running software release 12.1.00 or later NOTE If the ADX is running software release 12.3.
40 SSL certificate configuration - Need Deploy — Yes if the certificate or key is not deployed to the product. No if the certificate or key is deployed to the product. - Description — A text area that shows user comments and annotations. - Chain button — Use to chain certificates. Certificates selector — Use this selector to Add, Edit, Duplicate, Append, or Delete certificates. View button — Use to view certificates.
SSL certificate configuration 40 FIGURE 715 SSL Certificates dialog box - Product View tab The Product View tab contains the following fields and components. - Products — A product tree structure. When you select a product, certificates are displayed under Certificates. If the ADX is running software release 12.3.00 or later, you can only view and manage SSL certificates to Virtual IP servers that are in your Area of Responsibility (AOR).
40 Generating a certificate signing request - Need Deploy — Yes if the certificate or key is not deployed to the product. No if the certificate or key is deployed to the product. - View button — Launches the View Certificate dialog box. Delete button — Deletes a selected certificate. Import button — Import a certificate or key from a file. Deploy button — Launches the Deploy Certificate/Key dialog box.
Generating a certificate signing request 40 FIGURE 717 Generate CSR Key dialog box 7. Enter your organization’s user data: • • • • Common Name - A common name for the CSR (1 through 32 alphanumeric characters). Unit Name - A unit name for the CSR (1 through 32 alphanumeric characters). Organization - The name of your organization (1 through 64 alphanumeric characters). E-mail Address - The e-mail address for the CSR. This is the From: address when the CSR is submitted for signing.
40 Adding an SSL certificate and key file 10. Enter the key password in the Password field, if necessary. By default, the Password field displays the password (entered in the Certificate Signing Request dialog box) as asterisks (*). 11. Click OK. The generated CSR displays in the CSR field. 12. The CSR needs to be copied and pasted into a file. Obtain instructions from the CA for submitting the CSR for signing.
Editing an SSL certificate and key file 40 The certificate request must be in .PEM format, and must not be expired. No size limit is enforced. 5. If you want a key to accompany the certificate, select the With Private Key check box. This enables the Key Name, Key, and Password fields. If you select With Private Key, continue with step 6. If you do not select With Private Key, continue with step 9. 6. Enter a name in the Key Name field. Any alphanumeric character can be used except a space.
40 Duplicating an SSL certificate and key file Related topic “SSL certificate configuration” Duplicating an SSL certificate and key file You can only edit the certificate name, the key name, and the certificate key decription from the Duplicate Certificate dialog box. 1. Select Configure > Application Delivery > SSL Certificates. The SSL Certificates dialog box displays. 2. From the Certificate View tab, use the Certificates arrow to select Duplicate . The Duplicate Certificate dialog box displays. 3.
Importing certificates and keys from file locations 40 3. Click Close. Importing certificates and keys from file locations NOTE If the ADX is running software release 12.3.00 or later, you can only view and manage SSL certificates that are bound to Virtual IP servers that are in your Area of Responsibility (AOR).
40 Importing certificates and keys from products 8. Enter the password associated with the key in the Password field. 9. (Optional) Enter a description of the certificate in the Description field. 10. Click OK to import the certificate and key files. Related topic “SSL certificate configuration” Importing certificates and keys from products NOTE If the ADX is running software release 12.3.
Exporting certificates and keys 40 FIGURE 720 Import from Product - SSL Certificates/Keys dialog box 3. Select a product from the Available Sources list. 4. Use the right arrow button to move the selected product to the Selected Sources list. 5. Click OK to import certificates and keys for the selected products. Related topic “SSL certificate configuration” Exporting certificates and keys NOTE If the ADX is running software release 12.3.
40 Deploying certificates and keys If you export the certificate file only (no key file), the PKCS option is not enabled. 4. Enter the location of the file in the File Location field or click Browse to browse to the location. 5. Enter the certificate name in the Certificate Name field. 6. Enter the key name in the Key Name field. If you export the certificate file only (no key file), the Key Name field is not enabled. If you select PKCS as the export format, the Key Name field is not enabled. 7.
Creating key passwords 40 FIGURE 721 Deploy Certificates/Keys dialog box 4. Select a product from the Available Targets list. 5. Use the right arrow button to move the selected product to the Selected Targets list. 6. Click OK. The certificate and key selected from the Certificate View tab are deployed to the selected products.
40 Creating key passwords FIGURE 722 Key Passwords dialog box 3. Under Add/Edit Key Password, enter an ASCII character string (from 1 through 16 characters) in the Display Label field that identifies the password you enter in the Password field. Use the key name or a character string that is easy to identify with a specific key. The label provides a means for identifying the password. The password itself is not exposed. 4.
Appending SSL certificates 40 Appending SSL certificates NOTE If the ADX is running software release 12.3.00 or later, you can only view and manage SSL certificates that are bound to Virtual IP servers that are in your Area of Responsibility (AOR). To add a Virtual IP server to your AOR, refer to “Assigning products to an AOR” on page 245 You can append an SSL certificate with another certificate. 1. Select Configure > Application Delivery > SSL Certificates. The SSL Certificates dialog box displays. 2.
40 Chaining SSL certificates 3. Click Chain. The Chain Certificates dialog box displays (Figure 723). FIGURE 723 Chain Certificates dialog box The Certificates table includes the following details: • ID — A unique system-assigned ID for each certificate entry. • Status — Possible values are Valid, About to Expire, or Expired. • Certificate — The user-assigned certificate name. The same name may be used on different products. • Key — The user-assigned key name.
Deleting SSL certificates 40 4. Select the certificate you want to chain to the certificate you selected in step 2. The Chain status for the selected certificate must be Yes. Make sure the Status for the second certificate is Yes. The description of the certificate displays in the Description field, if a description was entered when the certificate was created. 5. Click OK.
40 1580 Deleting SSL certificates Brocade Network Advisor SAN + IP User Manual 53-1003155-01
Chapter 41 Deployment Manager In this chapter • Introduction to the Deployment Manager . . . . . . . . . . . . . . . . . . . . . . . . • Editing a deployment configuration . . . . . . . . . . . . . . . . . . . . . . . . . . . . . • Duplicating a deployment configuration . . . . . . . . . . . . . . . . . . . . . . . . . • Deleting a deployment configuration . . . . . . . . . . . . . . . . . . . . . . . . . . . . • Deploying a configuration . . . . . . . . . . . . . . . . . . . . . . . . . . . . . . . . .
41 Duplicating a deployment configuration FIGURE 724 Task Scheduler dialog box 2. Select a deployment configuration in the Saved or Scheduled tab. Policy-based routing configurations cannot be edited. 3. Click Edit. A dialog box specific to the type of deployment displays. This is the same dialog box that was used when the deployment was created. 4. Update the dialog box with the information you want to change. Duplicating a deployment configuration 1. Select Configure > Task Scheduler.
Deleting a deployment configuration 41 A copy of the deployment configuration is created with the name “originalName copyn”. For example, if the original name is “test”, the new name is “test copy1”. If you duplicate “test” again, the name of the second duplicate is “test copy2”. Deleting a deployment configuration 1. Select Configure > Task Scheduler. The Task Scheduler dialog box displays. 2. Select a deployment configuration in the Saved or Scheduled tab. 3. Click Delete. 4.
41 Generating a deployment configuration snapshot report 3. Click Report. An HTML report displays. You can click the Configuration Name or Deployment Time to see additional details. Generating a deployment configuration snapshot report 1. Select Configure > Task Scheduler. The Task Scheduler dialog box displays. 2. Select a deployment in the Saved or Scheduled tab. 3. Click Deploy. The Deployment Status dialog box displays. 4. Click Snapshot Report. The Configuration Snapshot Report dialog box displays.
Searching the configuration snapshots 41 6. Click Find. The Management application displays the list of snapshots that match the search criteria you specified.
41 1586 Searching the configuration snapshots Brocade Network Advisor SAN + IP User Manual 53-1003155-01
Chapter Fibre Channel Troubleshooting 42 In this chapter • FC troubleshooting . . . . . . . . . . . . . . . . . . . . . . . . . . . . . . . . . . . . . . . . . . 1587 • FCIP troubleshooting . . . . . . . . . . . . . . . . . . . . . . . . . . . . . . . . . . . . . . . . . 1596 FC troubleshooting NOTE FC troubleshooting is only available for Fabric OS devices.
42 FC troubleshooting Tracing FC routes The Management application enables you to select a source port and a destination port and displays the detailed routing information from the source port or area on the local switch to the destination port or area on another switch. NOTE Trace route cannot be performed on offline devices. NOTE Trace route cannot be performed in a mixed (Fabric OS) fabric. Fabric OS trace route requirements • Fabric OS trace route is only supported in a pure-Fabric OS fabric.
FC troubleshooting 42 • Trace Route Summary — This table shows a brief summary of the trace including the following: Port WWN Port Name FC Address Switch Name (Fabric OS only) Whether ping was successful (Fabric OS only) (Fabric OS only) Round trip time (minimum, maximum, and average) (Fabric OS only) Whether the device ports are in active zones.
42 FC troubleshooting • Enter the source and destination ports directly by selecting the Enter port FC Address option and completing the following steps. a. Enter the source port in the Source field. b. Enter the destination port in the Destination field. c. Click Search and Add. • Select the source and destination ports from a list by selecting the Select two device ports option and completing the following steps. a. Right-click a fabric in the Available Device Ports table and select Expand All.
FC troubleshooting 42 Confirming Fabric Device Sharing NOTE Fabric device sharing is only available with Trial or Licensed version. NOTE Fabric device sharing is only available on pure Fabric OS fabrics. To confirm that two or more fabrics have been configured to share devices, complete the following steps. 1. Select Monitor > Troubleshooting > FC > Fabric Device Sharing. The Fabric Device Sharing Diagnosis dialog box displays. 2.
42 FC troubleshooting ATTENTION If you run more than one test per slot, the result may go wrong or the test may fail. TABLE 136 D-Port test support matrix D-Ports Tests Fabric OS 7.0 Fabric OS 7.1 HBA driver 3.
FC troubleshooting 42 • Link traffic • Latency measurement • Measure link distance TABLE 137 Supported link distance measurements SFP speed Accuracy Precision 10 Gbps 124 meters + or - 50meters 16 Gbps 5 meters + or - 5 meters If any of the tests fail, the Management application does not rollback to already executed operations. When the test successfully completes, the Management application performs the following operations to change the port type back to E-port: 1. Disable the source port. 2.
42 FC troubleshooting TABLE 138 Status Detail messages Operation/Test Possible message Failed to enable the port slot_number/port_number of the switch switch_IP_address. Reason: CAL_error_message Disable the diagnostic mode on source or destination D ports Disabled diagnostic mode on port slot_number/port_number of the switch switch_IP_address. Failed to disable diagnostic mode on port slot_number/port_number of the switch switch_IP_address.
FC troubleshooting TABLE 138 42 Status Detail messages Operation/Test Possible message If any test fails, that test displays as failed and a Failure report displays. Sample failure report : Errors detected (local): CRC, Bad_EOF, Enc_out Errors detected (remote): CRC, Bad_EO Run portstatsshow and porterrshow for more detail on the errors. 7.
42 FCIP troubleshooting The Diagnostic Port Test dialog box displays. Return to step 5 of “Troubleshooting port diagnostics” on page 1591. FCIP troubleshooting NOTE FCIP troubleshooting is only available for Fabric OS devices. You can perform the following operations using FCIP troubleshooting: • Ping. Use to confirm that the configured FCIP tunnels are working correctly. • Trace Route.
FCIP troubleshooting TABLE 139 42 FCIP IP Ping Response Details Field or Component Description Status Always displays ‘Completed’. If there is a failure, an error message displays instead of the IP Ping Result dialog box. Packets Sent Always displays ‘4. This is not configurable. Packets Received The number of received responses. Packets Lost Equal to the number of packets sent minus the number of packets received.
42 FCIP troubleshooting Trace route cannot be performed on the offline devices or virtual devices. NOTE Trace route is only supported on Fabric OS devices running Fabric OS 5.2 or later. To trace routes, complete the following steps. 1. Select Monitor > Troubleshooting > FCIP > Trace Route. The IP Traceroute dialog box displays. 2. Select a switch from the Available Switches table. 3. Select a port from the GigE Port list. 4. Select an IP address switch from the IP Interface list. 5.
FCIP troubleshooting 42 Viewing FCIP tunnel performance NOTE IP Performance is only supported on the 4 Gbps Router, Extension Switch and Encryption Blade running Fabric OS 5.2 or later. NOTE If you run IP Performance over a link also being used for production traffic, it will impact the production traffic performance. To view FCIP tunnel performance, complete the following steps. 1. Select Monitor > Troubleshooting > FCIP > Performance. The IP Performance dialog box displays. 2.
42 FCIP troubleshooting 7. Field/Component Description DELAY The average round trip time to send a packet of data and receive the acknowledgement. PMTU (Path Maximum Transmission Unit) The largest packet size that can be transmitted over the end path without fragmentation. This value is measured in bytes and includes the IP header and payload. IP Performance tries the configured Fabric OS Jumbo MTU value (anything over 15000, then 1500, then 1260.
Chapter 43 Performance Data In this chapter • SAN performance overview. . . . . . . . . . . . . . . . . . . . . . . . . . . . . . . . . . . . . • SAN real-time performance data . . . . . . . . . . . . . . . . . . . . . . . . . . . . . . . • SAN historical performance data . . . . . . . . . . . . . . . . . . . . . . . . . . . . . . . . • SAN end-to-end monitoring. . . . . . . . . . . . . . . . . . . . . . . . . . . . . . . . . . . . . • SAN Top Talker monitoring . . . . . . . . . . . . . . . . . . . . . .
43 SAN performance overview The Professional version only allows you to monitor your SAN by gathering and displaying real-time performance data (Switch Ports - FC, Switch Ports - GE, Switch Ports - 10GE, ISL Ports, E_Port Trunks, end-to-end Monitors, FCIP Tunnels, device Ports, managed HBA Ports, managed CNA Ports). • Persist and display historical performance data (Switch Ports - FC ports, ISL ports, device Ports, FCIP tunnels, SFP, and Switch Ports - 10 GE Ports) for selected fabrics or the entire SAN.
SAN performance overview 43 • Tx MB/Sec — Available for FC, GE, managed HBA ports, managed CNA ports, 10GE ports, E_port trunks, FCIP tunnels, and end-to-end monitors. • Rx MB/Sec — Available for FC, GE, managed HBA ports, managed CNA ports, 10GE ports, E_port trunks, FCIP tunnels, and end-to-end monitors. • CRC Errors — Available for FC, managed HBA ports, managed CNA ports, 10GE ports and end-to-end monitors.
43 SAN performance overview • • • • • • Alignment Errors — Available for 10GE ports only. • • • • Dropped Frames — Available for managed HBA ports and managed CNA ports. NOS Count — Available for managed HBA ports and managed CNA ports. Error Frames — Available for managed HBA ports and managed CNA ports. Under Sized Frames — Available for managed HBA ports and managed CNA ports. Over Sized Frames — Available for managed HBA ports and managed CNA ports.
SAN performance overview 43 • Make sure that the SNMP credentials in the Management application match the SNMP credentials on the device. - To check the SNMP v1 credentials on the device, use the snmpconfig --show snmpv1 command. Example of SNMP v1 HCLSwitch:admin> snmpconfig --show snmpv1 SNMPv1 community and trap recipient configuration: Community 1: Secret C0de (rw) Trap recipient: 10.103.4.63 Trap port: 162 Trap recipient Severity level: 4 Community 2: OrigEquipMfr (rw) Trap recipient: 10.1.12.
43 SAN performance overview Trap recipient Port : (0..65535) [162] - To check the SNMP v3 credentials on the device, use the snmpconfig --show snmpv3 command.
SAN performance overview 43 Trap Recipient's IP address : [2.168.71.32] UserIndex: (1..6) [1] Trap recipient Severity level : (0..5) [4] Trap recipient Port : (0..65535) [162] Trap Recipient's IP address : [1.1.1.1] UserIndex: (1..6) [2] Trap recipient Severity level : (0..5) [4] Trap recipient Port : (0..65535) [162] Trap Recipient's IP address : [10.64.209.171] UserIndex: (1..6) [1] Trap recipient Severity level : (0..5) [4] Trap recipient Port : (0..65535) [162] Trap Recipient's IP address : [0.0.0.
43 SAN real-time performance data Example of showing FCIP-MIB FCRRouter:admin> snmpconfig --show mibcapability FCIP-MIB: YES - To enable FCIP-MIB capability, use the snmpconfig --set mibcapability command.
SAN real-time performance data 43 NOTE Virtual Fabric logical ISL ports are not included in performance collection. • Choose to display the same Y-axis range for both the Tx MB/Sec and Rx MB/Sec measure types for easier comparison of graphs. Generating a real-time performance graph You can monitor the device performance through a performance graph that displays transmit and receive data. The graphs can be sorted by the column headers. You can create multiple real-time performance graph instances.
43 SAN real-time performance data FIGURE 726 Realtime Port Selector - Hosts dialog box 2. From the Show list, select the object type for which you want to performance graph. NOTE Devices with 10 GbE ports must be running Fabric OS 6.4.1 or later to obtain the correct TE_Port statistics (TX/RX). NOTE Devices with 10 GbE ports must have the RMON MIB enabled on the switch. For more information about the rmon collection command, refer to the Fabric OS Converged Enhanced Ethernet Command Reference.
SAN real-time performance data 43 For a list of possible performance measures, refer to “SAN performance measures” on page 1602. 3. To select more than one measure, click the Additional Measures expand arrows and select the check box for each additional measure. If the Additional Measures area is not shown, click the down arrow. For a list of possible performance measures, refer to “SAN performance measures” on page 1602. 4.
43 SAN historical performance data Select any of the columns and click Add Flow to create an add flow defintion. For more information, refer to “Flow Monitor” on page 1737. Exporting real-time performance data To export real-time performance data, complete the following steps. 1. Generate a performance graph. To generate a performance graph, refer to “Generating a real-time performance graph” on page 1609. 2. Right-click anywhere in the graph table and select Export Table.
SAN historical performance data 43 • Use the Round Robin Database (RRD) style aging scheme. • Enable a granularity for data collection: - 5 minute granularity for last 8 days - 30 minutes granularity for last 14 days - 2 hour granularity for last 30 days - 1 day granularity for last 730 days • Plot advanced monitoring service (AMS) violation events received during the chart time range and Master Log events logged on the same product as the measure being plotted. • Generate reports.
43 SAN historical performance data FIGURE 727 Historical Data Collection dialog box 3. Select the fabrics for which you want to collect historical performance data in the Available list. NOTE Devices with 10GE ports must be running Fabric OS 6.4.1 or later to obtain the correct TE_Port statistics (TX/RX). NOTE Devices with 10GE ports must have the RMON MIB enabled on the switch.
SAN historical performance data 43 Disabling historical performance collection Perform the following steps to disable historical performance collection on all fabrics. 1. Select Monitor > Performance > Historical Data Collection. The Fabric Selector dialog box displays. 2. Select Disable All. Historical performance data collection is disabled for all fabrics in the SAN.
43 SAN historical performance data 3. Select a default or custom-saved port and time from the Favorites list or filter the historical data by completing the following steps. a. Select the number of results to display from the Display list. b. Select the type of port from which you want to gather performance data from the From list. NOTE Devices with 10GE ports must be running Fabric OS 6.4.1 or later to obtain the correct TE port statistics (TX/RX).
SAN historical performance data 43 The Source and Destination icons and the Graph column do not display. j. Add flow button - Select any of the column and click Add Flow to create Add flow defintion. For more information, refer to “Flow Monitor” on page 1737 k. Click Apply. The selected graph automatically displays in the Historical Performance Graph dialog box, if you do not select the Display tabular data only check box.
43 SAN historical performance data • Select Print to print the graph. Filtering data by ports To filter data for a historical performance graph by ports, complete the following steps. 1. Select Custom from the From list on the Historical Performance Graph dialog box. The Custom Port Selector dialog box displays. 2. Select the type of ports from the Show list, as shown in Figure 729 on page 1618. FIGURE 729 Custom Port Selector dialog box 3.
SAN historical performance data 43 1. Click Monitor > Performance > Historical Graph. The Historical Performance Graph dialog box displays. 2. Select Custom from the For list. The Custom Time Frame dialog box displays as shown in Figure 730 on page 1619. Perform one of the following steps: • Select the Last option and enter the number of minutes, hours, or days that you want to monitor.
43 SAN historical performance data Exporting historical performance data To export historical performance data, complete the following steps. 1. Generate a performance graph. To generate a performance graph, refer to “Generating and saving a historical performance graph” on page 1615. 2. Right-click anywhere in the graph table and select Export. The Save to a tab delimited file dialog box displays. 3. Browse to the file location where you want to save the performance data. 4.
SAN historical performance data 43 Performance database views The following view names are used to extract data similar to the 11.3.0 database schema from the server with the version greater than or equal to 12.0.2. NOTE The FC_PORT_STATS and FCIP_STATS views definition are available under the tree view of databases >dcmdb>Schemas>dcm>Views node hierarchy and can be extracted from the 12.0.
43 SAN historical performance data Performance statistics counters Table 142 details the formulas used to calculate performance statistics based on counter type and protocol. To calculate FC, GE, FCIP and TE port statistics, the Management application uses SNMP to query the respective object identifiers (OID) (listed in Table 142). To calculate HBA and CNA statistics, the Management application uses APIs provided by HCM.
SAN historical performance data TABLE 142 43 Performance statistic counters Counter name Type Protocol Source OID value Formula TX% / RX% FCIP N/A N/A TX% or RX% = ((bytes transferred) / (maximum bytes transmitted))*100 where maximum bytes transmitted = tunnel speed * 134217728 (maximum bytes transmitted 1 Gbps). If utilization is less than 1, the value is 0.0. TX% / RX% (Pre-Fabric OS 6.4.
43 SAN end-to-end monitoring TABLE 143 Performance counters Counter name Type Protocol Source OID value Current FC SNMP .1.3.6.1.4.1.1588.2.1.1.1.28.1.1.3 Rx Power FC SNMP .1.3.6.1.4.1.1588.2.1.1.1.28.1.1.4 Tx Power FC SNMP .1.3.6.1.4.1.1588.2.1.1.1.28.1.1.5 Invalid Oredered Set FC SNMP .1.3.6.1.3.94.4.5.1.45 BB Credit Zero FC SNMP 1.3.6.1.3.94.4.5.1.8 Truncated Frames FC SNMP 1.3.6.1.3.94.4.5.1.47 FEC Corrected Blocks FC SNMP 1.3.6.1.4.1.1588.2.1.1.1.27.1.
SAN end-to-end monitoring 43 • End-to-end monitoring on an Access Gateway device requires Fabric OS 7.0 or later with an Advanced Performance Monitor license. Performance monitoring enables you to provision end-to-end monitors of selected target and initiator pairs. These monitors are persisted in the database and are enabled on one of the F_Ports on the connected device (the Management application server determines the port).
43 SAN end-to-end monitoring 3. Select an initiator port from the Select an initiator port list. 4. Select a target port from the Select a target port list. 5. Click the right arrow to move the selected initiator and target ports to the Monitored Pairs list. The system automatically determines the initiator SID and the target DID identifiers for the pair and displays them in the Monitored Pairs list. 6. Click Apply.
SAN end-to-end monitoring 43 For systems using Fabric OS version 7.2 or later, when you select a device or device port, and then select Monitor > Performance > End-to-End Monitors, a message displays that you can use Flow Vision to provide End-to-End monitoring. You have these options: • To use Flow Vision, delete existing monitors, then use the Add Flow Definition dialog box to define an initiator and target port pair for monitoring. Refer to Chapter 44, “Flow Vision” for more information.
43 SAN Top Talker monitoring Deleting an end-to-end monitor pair Procedures in this section pertain to deleting monitors on systems using the legacy End-to-End Monitor feature instead of using Flow Vision. For systems using Fabric OS version 7.2 or later, when you select a device or device port, and then select Monitor > Performance > End-to-End Monitors, a message displays that you can use Flow Vision to provide End-to-End monitoring.
SAN Top Talker monitoring 43 You can create Top Talker monitors on selected devices. Use Top Talkers to display the connections which are using the most bandwidth on the selected device or port. Top Talkers can be enabled on the device or one of the F_Ports on the device. You can only use Top Talkers to view real-time performance data. You can have multiple Top Talker monitors configured at the same time.
43 SAN Top Talker monitoring The Top Talker Selector dialog box displays, as shown in Figure 732 on page 1630. FIGURE 732 Top Talker Selector dialog box 3. Select Fabric in the Top Talker Mode list to select a switch to monitor. 4. Select an available switch from a fabric in the left panel, and then the right arrow to move it to the right panel. You can select only one device on which to enable Top Talkers. 5. Click OK on the Top Talker Selector dialog box. Top Talkers is enabled on the selected device.
SAN Top Talker monitoring 43 Configuring an F_Port mode Top Talker monitor Procedures in this section pertain to configuring the legacy Top Talkers feature instead of using Flow Vision. For systems using Fabric OS version 7.2 or later, when you select a device or device port, and then select Monitor > Performance > Top Talkers, a message displays that you can use Flow Vision to provide Top Talkers monitoring.
43 SAN Top Talker monitoring The top 20 conversations display in the Current Top Talkers list. The Top Talkers Summary list displays all Top Talkers that occurred since the Top Talker Selector dialog box was opened (displays a maximum of 360). When the maximum is reached, the oldest Top Talker drops as a new one occurs.
Bottleneck detection 43 • Clicking OK opens the legacy Top Talkers dialog box. To use the legacy Top Talkers feature, you must deactivate existing flows defined for the switch for Flow Vision. To pause a Top Talker monitor on systems using Fabric OS before 7.2, complete the following steps. 1. Select the dialog box of the Top Talker monitor you want to pause.
43 Bottleneck detection The bottleneck detection feature detects two types of bottlenecks: • Latency bottleneck • Congestion bottleneck A latency bottleneck is a port where the offered load exceeds the rate at which the other end of the link can continuously accept traffic, but does not exceed the physical capacity of the link. This condition can be caused by a device attached to the fabric that is slow to process received frames and send back credit returns.
Bottleneck detection 43 NOTE A bottleneck cleared alert is sent if you disable bottleneck detection on a bottlenecked port, even though the port is still bottlenecked. Bottlenecks can be highlighted in the Connectivity Map and Product List. Select Monitor > Performance > View Bottlenecks. If a port is experiencing a bottleneck, a bottleneck icon is displayed in the Connectivity Map for the switch and fabric, and in the Product List for the port, switch, and fabric, as shown in Figure 733.
43 Bottleneck detection NOTE It is recommended that you enable bottleneck detection on every switch in the fabric. When you enable bottleneck detection, you also determine whether alerts are to be sent when the bottleneck conditions at a port exceed a specified threshold. The alert parameters include whether alerts are sent and the threshold, time, and quiet time options. These alert parameters apply to all ports in the switch, unless you override them later.
Bottleneck detection 43 4. Select the Latency Alerts check box to enable alerts for latency bottlenecks. If you enabled alerts, enter values for the following thresholds: • Threshold - Enter values between 1 and 100, which is the percentage of one-second intervals affected by congestion conditions within a specified time window that will trigger a latency alert.
43 Bottleneck detection 9. Select the following options at the bottom of the dialog box as necessary: - Show Bottleneck Graph. This displays the Bottleneck Graph Port Selector dialog box for configuring a bottleneck graph. Refer to “Displaying bottleneck statistics” on page 1639. - Show Affected Devices. Lists the hosts and targets that might be affected by the selected bottlenecked port. - Inherit From Switch. Restores the switch bottleneck parameters to a port that has direct assigned settings.
Bottleneck detection 43 You can select fabrics or switches or ports, but you cannot select a mix of fabrics, switches, and ports. 5. Click the right arrow. The bottleneck parameters are applied to the selected items. 6. Click OK or Apply to save your changes. Displaying bottleneck statistics You can display a graph of bottleneck statistics for up to 32 ports at one time. You can display a graph showing the history of bottleneck conditions, for up to the last 150 minutes. 1.
43 Thresholds and event notification 1. Select Monitor > Performance > Bottlenecks. The Bottlenecks dialog box displays. 2. In the Current Settings list, select a bottlenecked port (a port with “Bottlenecked” in the Bottleneck Status column). 3. Click Show Affected Devices. The Show Affected Devices dialog box displays. 4. Select a port in the Bottleneck Ports list to display the affected hosts and targets in the table on the right side of the dialog box. 5.
Thresholds and event notification 43 NOTE If you set the threshold for a particular critical event to 100 percent, by the time you are notified, it may be too late to prevent a failure. However, when you set the threshold to 85 percent, for example, you may be able to prevent the failure from occurring. Example The values at 1 second, 3 seconds, and 5 seconds generate events because they exceed boundaries.
43 Thresholds and event notification FIGURE 736 Set Threshold Policies dialog box NOTE Policies set for switches enabled for Monitoring and Alerting Policy Suite (MAPS) also display in this dialog box. 2. To edit a current policy, select a policy form the Available Threshold Policies list and click Edit. The Edit Threshold Policy dialog box displays, as shown in Figure 737 on page 1642. FIGURE 737 Edit Threshold Policy dialog box 3. To add a new policy, perform the following steps. a. Click Add.
Thresholds and event notification 43 FIGURE 738 New Threshold Policy dialog box b. Enter a name for the policy (100 characters maximum) in the Name field. 4. Select a policy type from the Policy Type list. You can only define policies for E_Port and F_Port, and FL_Ports. 5. Select a measure from the Measure list. You can only define policies for the Tx % Utilization and Rx % Utilization measures. You cannot add the same measure more than once.
43 Thresholds and event notification FIGURE 739 Confirm Threshold Changes dialog box 14. Make the threshold changes by selecting one of the following options: • To add only new thresholds, select the Keep currently set thresholds and only add new thresholds check box. • To overwrite all existing thresholds on all fabrics and devices, select the Overwrite all thresholds currently set on all switches check box. 15. Click OK on the Confirm Threshold Changes dialog box.
Thresholds and event notification 43 Press Ctrl or Shift and then click to select multiple policies. 3. Select one or more fabrics or devices to which you want to assign the policy in the Available Threshold Policies list. If you choose to assign the policy to a fabric and a M-EOS logical switch is present in the fabric, the policy is not assigned to the M-EOS logical switch. You must directly assign a policy to a M-EOS physical chassis.
43 SAN connection utilization • To overwrite all existing thresholds on all fabrics and devices, select the Overwrite all thresholds currently set on all switches check box. 7. Click OK on the Confirm Threshold Changes dialog box. SAN connection utilization NOTE Connection utilization is only supported on the following managed objects: E_Ports, F_Ports, N_Ports, 10 GE_Ports and FCIP tunnels. NOTE Fabrics where performance data collection is not enabled display connections as thin black lines.
SAN connection utilization TABLE 144 43 Utilization Legend Line color Utilization defaults Red line 80% to 100% utilization Yellow line 40% to 80% utilization Blue line 1% to 40% utilization Gray line 0% to 1% utilization Black line Utilization disabled Enabling connection utilization To display the connection utilization, complete the following steps. 1. Choose from one of the following options: • Select Monitor > Performance > View Utilization. • Press CTRL + U.
43 IP performance monitoring and traffic analysis Disabling connection utilization To turn off the connection utilization, choose one of the following options while connection utilization is enabled: • Select Monitor > Performance > View Utilization. • Press CTRL + U. • Click the Utilization icon ( ). The Utilization Legend is removed from the main interface window. Changing connection utilization percentages You can change the utilization percentages.
IP configuration requirements • IP historical performance monitoring. . . . . . . . . . . . . . . . . . . . . . . . . . . . • IP Custom performance reports . . . . . . . . . . . . . . . . . . . . . . . . . . . . . . . . . • IP sFlow configuration . . . . . . . . . . . . . . . . . . . . . . . . . . . . . . . . . . . . . . . . • IP Traffic analyzer monitoring and sFlow reports . . . . . . . . . . . . . . . . . . . • IP traffic accounting . . . . . . . . . . . . . . . . . . . . . . . . . . . . . . . . . . . .
43 IP real-time performance monitoring IP real-time performance monitoring Real-time performance monitoring allows you to view a snapshot of current performance data. You can enable real-time performance monitoring without configuring historical data collectors. The data is not stored in the database. Performance monitoring allows you to define a data collector by mapping a Management Information Base (MIB) object to a unit name (refer to “MIB data collectors” on page 1681).
IP real-time performance monitoring 43 2. Select the products you want in the Available Products list and click the right arrow button to move them to the Selected Products list. NOTE You cannot select more than 100 products and ports. 3. Select the ports you want in the Available Ports list and click the right arrow button to move them to the Selected Ports list. 4. Click OK. The Real Time Graphs/Tables dialog box displays. 5.
43 IP real-time performance monitoring TABLE 145 Collection status icons Failed. No value was ever collected for this collectible. Warning: Data collection failed in the last polling cycle. Successful: Last collection successful. Scheduled but not currently active. • Last Value - The last (most current) value collected. • Last Time Polled - The time that the collector was last polled. 10. Click Sources to add products and ports to or remove products and ports from real-time performance monitoring.
IP real-time performance monitoring 43 5. The Real Time Graphs/Tables dialog box displays. Adding measures to products To add measures to products, complete the following steps. 1. Right-click a device and select Performance > Real Time Graph/Table. The Real Time Graphs/Tables dialog box displays. 2. Select Products from the Show list. The available products display in a list. 3. Select a product in the list and click Measures. The Select measures - Real Time Graphs/Tables dialog box displays. 4.
43 IP real-time performance monitoring 3. Select a product in the list and click Measures. The Select measures - Real Time Graphs/Tables dialog box displays. 4. Select Device Measures from the Show list. 5. To remove an MIB or expression from the product, complete the following steps. a. Select the MIB or expression you want to remove from the product in the Selected Measures list. Select multiple MIBs and expressions by holding down the CTRL key and clicking more than one MIB or expression. b.
IP real-time performance monitoring 43 8. Click OK. The Real Time Graphs/Tables dialog box displays. Removing measures from ports To remove measures from ports, complete the following steps. 1. Right-click a device and select Performance > Real Time Graph/Table. The Real Time Graphs/Tables dialog box displays. 2. Select Products from the Show list. The available products display in a list. 3. Expand the list and select a port in the list and click Measures.
43 IP real-time performance monitoring a. Select Show > Products to show devices on the network that are being polled for collectible data. b. Select the port you want to include in performance in the tree. Press CTRL and click to select multiple ports. c. Click the right arrow button. The graph and table are populated with the collectible performance values. All collectibles defined for the selected port display beneath the graph. 3. Add an individual collectibles by completing the following steps.
IP real-time performance monitoring 43 • Select the Use Logarithmic Axis check box to present data on a logarithmic or non-logarithmic axis. • Select the Show Values check box to annotate data point values in the graph. • Select the Enable Auto Scrolling check box to automatically jump to display the new data when new data is collected while the graph is in view.
43 IP real-time performance monitoring FIGURE 744 Show data points graph NOTE Although these settings will apply to all performance graphics in the Management application, the change will not reflect instantly on the performance monitor that displays the graph. Rather, the change will be updated the next time those monitors are launched. 3. Click Options to launch the Graph Options dialog box. Refer to “Configuring graph options” on page 1659 for instructions on using this dialog box. 4.
IP real-time performance monitoring 43 9. (Real Time Graphs/Tables and Historical Graphs/Tables dialog boxes only) Click Save as Widget to create a performance monitor published widget on the active dashboard. For instructions, refer to “Configuring a monitor from a performance graph” on page 451. Configuring graph options Use the following steps to configure graph options for real time performance graph display as well as time series monitors on the Dashboard tab. 1. Click Options on the graph.
43 IP real-time performance monitoring • Use logarithmic axis check box — Data can be presented on a logarithmic or non-logarithmic axis. Each unit in a non-logarithmic axis presents the data in equal segments. However, logarithmic axis units are not equal and can increase exponentially by 10. Therefore, use a logarithmic axis if you have a large amount of data to view. • Show values check box — Annotates data point values in the graph.
IP real-time performance monitoring 43 FIGURE 747 Show events graph 5. In the Time Range area, select one of the following options: • Select Relative time to set a time range relative to the present for the display of historical data. a. (Historical graphs and monitors only) Select the granularity of the data points to display on the graph from the Granularity list. Options are 5 minutes, 30 minutes, 2 hours, or 1 day.
43 IP historical performance monitoring • Spreadsheet (.csv) • Image (.png) The Save dialog box displays. 3. Browse to the location where you want to save the export file. 4. Enter a name for the export file. 5. Click Save. Printing a graph To print a graph, complete the following steps. 1. Right-click the graph and select Print. The Page Setup dialog box displays. 2. Edit the paper, orientation, and margins, as needed. 3. Click Printer to select a printer. 4. Click OK.
IP historical performance monitoring 43 • Create a custom graph or table display for data by defining options such as the following: - Selecting a product for displaying data. - Selecting measures to collect. - Modifying collectors. - Plotting minimum and maximum values. - Displaying data points or polling intervals. - Displaying events. - Selecting a graph or table format.
43 IP historical performance monitoring • • • • • • • Name - Collector Basics page Device or port level - Collector Basics page Polling interval - Collector Basics page Schedule setting - Collector Basics page MIB selection - MIB Object page Expression selection - Expression page MIB index - MIB Index page NOTE The MIB Index page for system collectors will not show because you cannot configure the MIB index for system collectors.
IP historical performance monitoring 43 • Collectibles Type - At what level the data will be collected and the types of MIB objects used: - Product Level - SNMP data is collected at the product (device) level. - Port Level - SNMP data is collected at the port level. • Source Defined - Whether or not the information source (product or port) is defined (Yes) or not configured (No). • System Collectors - Whether or not this is a system data collector.
43 IP historical performance monitoring The Data Collector wizard Collector Basics dialog box displays where you can add values for a new collector. FIGURE 749 Data Collector wizard Collector Basics dialog box 3. Enter a descriptive name for the data collector in the Name field. 4. Use the Polling Interval list to set the polling interval. The choices are 1 minute, 5 minutes, 10 minutes, 15 minutes, and 30 minutes. 5. Select the Target Type.
IP historical performance monitoring 43 • If you select Weekly, the Time (hh:mm) and Day of the Week selectors display. • If you select Daily, the Time (hh:mm) selector displays. • Duration - Enter a value in the Duration field, and then select the unit of measure. The options are Minutes, Hours, and Days. 7. Click Next on the Collector Basics dialog box. The MIB Objects dialog box displays.
43 IP historical performance monitoring FIGURE 751 Data Collector wizard Expressions dialog box The Available Expressions list shows all expressions that are available by default and any that have been defined by the user. 12. Select an expression from the Available Expressions list. A description of the expression displays under Details of . 13. To include the expression in your data collector, click the right arrow button to move the expression to the Selected Expressions list.
IP historical performance monitoring 43 FIGURE 752 Data Collector wizard Select Sources dialog box The Available Products/Ports tree structure includes all products and ports that can be monitored. You can expand folders to display all available products and ports. If you have selected Port Level on the Collector Basics dialog box, trunk objects will be included as available targets in the form of LAG, vLAG, or TRILL objects. Only ifindex-based MIBs or expressions are supported. 15.
43 IP historical performance monitoring FIGURE 753 Data Collector wizard MIB Index dialog box You can define index values for each MIB object that requires an index. 17. From the MIB Instances list, select the required MIB variable. The Complete SNMP OID, the Index Name, and the Index Value display beneath the MIB Instances list. 18. You have several options for entering index information: • Select the Dynamic walk check box to dynamically select index values for a particular index.
IP historical performance monitoring 43 19. Click Next on the MIB Index dialog box. The Threshold & Rearm dialog box displays. FIGURE 754 Data Collector wizard Threshold & Rearm dialog box This Threshold & Rearm dialog box allows you to establish a a threshold value that triggers a trap message when the threshold is met, and to establish conditions for repeating threshold check and trap messages. 20. Select the Enable threshold and rearm events check box to enable the Threshold and Rearm selectors. 21.
43 IP historical performance monitoring Adding third-party device MIB objects manually To add a third-party device MIB object manually, complete the following steps. 1. Copy the third-party device MIB objects to the Install_Home\conf\mibs\ip directory. 2. Go to Install_Home\conf\mibs and open the mibs_to_compile.txt file in a text editor. 3. Add the MIB file names to the mibs_to_compile.txt file. 4. Save and close the mibs_to_compile.txt file. 5.
IP historical performance monitoring 43 1. Select Monitor > Performance > Historical Data Collectors. 2. Select the data collector you want to duplicate. 3. Click Duplicate. The Data Collector wizard is launched. The wizard is pre-populated with the data for the selected data collector. The Name field shows the name of the collector followed by the word copy. Go to any step to edit any of the values. 4. Click Finish on any of the wizard dialog boxes when you are done.
43 IP historical performance monitoring 2. Perform either of the following steps: • Click Add. The Add Expressions dialog box displays. FIGURE 756 Add Expressions dialog box • Select the expression you want to edit or duplicate from the Expressions list and click Edit or Duplicate. The Edit Expression or Duplicate Expression dialog box displays with the details for the selected expression. If you are duplicating an expression, the Management application appends _copy to the name of the expression. 3.
IP historical performance monitoring 43 • MIB Object.Delta — Assuming the MIB value polled in the current polling period is M(T1) and the value polled in the previous polling period is M(T0), the MIB value to be used in the expression is calculated using M(T1)- M(T0). • MIB Object.
43 IP historical performance monitoring FIGURE 757 Historical Graphs/Tables Data Monitoring tab 3. Use the Show selector to toggle the tree structure display in the left panel between Products and Collectibles. • Select Products and the left panel displays the tree structure of devices and device interfaces on the network being polled for collectible data. The right panel displays measures currently being collected for the selected product or port in the left panel.
IP historical performance monitoring 43 FIGURE 758 SAN Fibre Channel port display FIGURE 759 SAN FCIP tunnel display FIGURE 760 NetIron Historical Graph display Brocade Network Advisor SAN + IP User Manual 53-1003155-01 1677
43 IP historical performance monitoring FIGURE 761 Wireless access point devices and controllers display • Select Collectibles and the left panel displays measures (MIB objects and expressions) currently being collected. Select a measure, and the targets (products or ports) from which the measure was collected display in the right panel. If SAN historical data collection is enabled, corresponding SAN products and ports display.
IP historical performance monitoring 43 If a table is displayed, the first column displays the time of the collection. The remaining columns display the value of each collectible at the specified time. There is one column for every collectible you select to display. 7. Optional: To add the performance monitor published widget to the active dashboard, click Save As Widget. The Performance Dashboard Monitor Title dialog box displays.
43 IP historical performance monitoring • Status - The status field uses the following icons:. Failed. No value was ever collected for this collectible. Warning: Data collection failed in the last polling cycle. Successful: Last collection successful. Scheduled but not currently active. • Last Value - The last (most current) value collected. • Last Time Polled - The time that the collector was last polled.
MIB data collectors 43 MIB data collectors The Management application enables you to define a data collector by mapping a MIB object to a unit name in the mib_unit.properties file. This property file is located in the Install_Home/conf/mibs directory. The default mib_unit.properties file contains commonly used MIB unit definitions. Once mapped, the unit name displays on the line chart of the performance graphs when you select that MIB object as a data collector.
43 IP Custom performance reports “IP Custom performance reports” “IP Custom performance reports” “IP sFlow configuration” “IP Traffic analyzer monitoring and sFlow reports” “IP traffic accounting” Creating a custom report Complete the following steps to create a report. 1. Select Monitor > Performance > Custom Reports. The Performance Custom Reports dialog box displays, as shown in Figure 763 on page 1682. FIGURE 763 Performance Custom Reports dialog box 2.
IP Custom performance reports 43 FIGURE 764 Add/Edit /Duplicate Report Definition dialog box - Collection Items tab By default, the Collection Items tab is selected. On this tab, the collectibles in all data collector configurations are listed by device in the Available Collection Items list. 3. Select the collectible you want to include in the report and click the right arrow button to move it to the Selected Collection Items list.
43 IP Custom performance reports FIGURE 765 Add/Edit Report Definition dialog box - Time Settings tab You can choose from the following settings: • Relative Time - Enables you to select a time range relative to the present for the display of historical data. The choices are incremental from the last 30 minutes to the last 24 hours. • Absolute Time - Enables you to get a snapshot of data from a specific time range, as specified by the Start Date, Start Time, End Date, and End Time parameters.
IP Custom performance reports 43 6. To arrange the order of the columns in the generated report, click the Result Settings tab. FIGURE 766 Add/Edit Report Definition dialog box - Result Settings tab • Data types that will be collected are listed in the Available Columns list. Select the data type you want to include in the report and click the right arrow button to move it to the Selected Columns box. • Select a data type to be used to sort the report.
43 IP Custom performance reports 7. Click the Identification tab. FIGURE 767 Add/Edit Report Definition dialog box - Identification tab 8. Enter a name for the report in the Name field. You can use up to 64 alphanumeric characters. This name appears under the Name column on the SNMP Monitor reports tree. This name must be unique for each SNMP Monitor report. 9. Enter a title for the report, which will be used as the title of a generated report, in the Title field.
IP Custom performance reports 43 12. Select the user accounts that will be able to view and run this definition in the Available Users list and click the right arrow button to move those user accounts into the Selected Roles box. Click the left arrow button to move the user accounts back to the Available Users list. You can share this definition with specific Management application users.
43 IP sFlow configuration IP sFlow configuration The Management application supports the creation of sFlow reports to capture traffic data. Configuring sFlow You can use the sFlow configuration wizard to configure an sFlow data collector and a destination for the sFlow data collector. 1. Select Monitor > Traffic Analysis > Configure sFlow. The Interface Payload - sFlow Configuration dialog box displays.
IP sFlow configuration 43 2. Click Next. The Interface Payload - sFlow Settings dialog box displays. FIGURE 769 Interface Payload - sFlow Settings dialog box 3. Under Global Settings, select Enable to have the sFlow report enabled when it is deployed. Select Disable to deploy the sFlow report as initially disabled. 4. Use the Rate Sampling selector to choose either Adaptive or Custom sampling. If you choose Adaptive, the management server selects the sampling interval and traffic sampling rate.
43 IP sFlow configuration If you choose Custom, you may set your own sampling interval and traffic sampling rate. - Global Settings • Counter sampling interval - defines the interval in seconds between samples. For Ironware devices, the range is 0 to 86400. For Network OS devices, the range is 1 to 65535. • Traffic sampling rate - the ratio between the total number of incoming packets and the number of flow samples taken at the product level.
IP sFlow configuration 43 A new row appears under Collector Details for the collector you just added. NOTE A limit of four collectors is enforced in the Collector Details table. If you add more than four collectors, an error message displays. An error message also displays if you try to add a collector with the same IP address and UDP port combination as an existing collector. NOTE For VCS devices running Network OS v4.0 and above, you can deploy up to five collectors.
43 IP sFlow configuration Creating custom sFlow reports You may create custom sFlow reports if you want to capture traffic analysis information that is not available in the standard reports. 1. Select Monitor > Traffic Analysis > Custom Reports. The Traffic Analyzer Custom Reports dialog box displays. FIGURE 770 Traffic Analyzer Custom Reports dialog box, Definition tab 2. Select the Report Definitions tab. 3. Click the Add button. The Add Report Definitions dialog box displays.
IP sFlow configuration 43 4. Select the Product & Port tab. FIGURE 771 Add Report Definitions dialog box, Product & Port tab The Product & Port tab contains tables of available products and ports that may be selected for sFlow data collection. 5. Determine if you want a report on only one product or port or on two or more products or ports, and select either Single or Multiple as appropriate. Options are displayed differently depending on your choice of Single or Multiple.
43 IP sFlow configuration For VCS fabrics, if you select Single mode, the following report definition behavior may occur: - Displays all ports from all members of the selected VCS fabric in the available ports tables on the Product & Port tab. - Automatically includes fabric changes (adding or deleting members) when you run the report.
IP sFlow configuration 43 8. If you do not chose the Prompt check box, complete the following for each field. - Source VM — Enter the name, IP address, or MAC address of the source VMs in comma separated value (CSV) format or click the ellipsis button to the right of the field to select the VMs from the Select VMs dialog box.
43 IP sFlow configuration 12. Select the Layer 3 & 4 tab. FIGURE 774 Add Report Definitions dialog box, Layer 3 & 4 tab 13. Examine each listed item and decide the following: - Do you want to enter values in the field, or be prompted to enter the value when running the report? If you want to be prompted, select the Prompt check box.
IP sFlow configuration 43 - Destination Address Groups — Enter the addresses in comma separated value (CSV) format or click the ellipsis button to the right of the field to select the addresses from the L3 Source Address Groups dialog box. - TOS/DSCP values — Enter one or more TOS or DSCP value (0-255). Layer 4 Protocols — The layer 4 protocols you can use as a filter depends on which layer 3 protocols you selected.
43 IP sFlow configuration 18. Examine each listed item and decide the following: Do you want to enter values in the field, or be prompted to enter the value when running the report? If you want to be prompted, select the Prompt check box. If you do not chose the Prompt check box, you may enter any of the following in the fields provided: - Source Subnet Bits - Enter the source subnet of the route. Destination Subnet Bits - Enter the destination subnet of the route. Local AS - Enter the local AS number.
IP sFlow configuration 43 21. Select the Result Settings tab. FIGURE 778 Add Report Definitions dialog box, Result Settings tab 22. Select one of the following options for displaying report data from Result Type list: - Detailed Table - Displays data in table format. - Bottom N Chart and Table - Displays a pie chart of the bottom N talkers above the tabular data. Top N Chart and Table - Displays a pie chart of the top N talkers for your selected sorting options above tabular data.
43 IP sFlow configuration FIGURE 779 Add Report Definitions dialog box, Result Settings tab 23. If you selected Bottom N Chart and Table or Top N Chart and Table, select the top or bottom number (N) of talkers that you want in the report by clicking the arrows on the selector to the right of the Result Type list. Select a minimum of 5, with increments of 5 to a maximum of 25.
IP sFlow configuration 43 26. Select the Identification tab. Add Report Definitions dialog box displays, as shown in Figure 780 on page 1701. FIGURE 780 Add Report Definitions dialog box, Identification tab 27. Enter a name for the report in the Name field. The name must be unique among all sFlow reports, and can be a maximum of 64 alphanumeric characters. 28. Enter the report title in the Title field. The Title field supports a maximum of 128 alphanumeric characters. 29.
43 IP sFlow configuration FIGURE 781 Example report for top 5 MAC Talkers Scheduling custom sFlow reports You can schedule a custom sFlow report from the Schedules tab of the Custom Reports dialog box. 1. Select Monitor > Traffic Analysis > Custom Reports. 2. Select the Schedules tab. Custom sFlow Reports dialog box displays, as shown in Figure 782 on page 1703.
IP sFlow configuration 43 FIGURE 782 Custom sFlow Reports dialog box, Schedules tab 3. Click Add. The Add Schedule dialog box displays, as shown in Figure 783 on page 1704.
43 IP sFlow configuration FIGURE 783 Add Schedule dialog box 4. Enter a name for the schedule in the Name field. 5. Use the Report Definition selector to select the report definition you want to schedule. NOTE Report definitions that included a prompt are not listed. 6. Use the Format selector to choose either HTML or CSV format. 7. Use the Frequency selector to choose to run the data collector on a Yearly, Monthly, Weekly, Daily, Hourly, or One Time basis.
IP Traffic analyzer monitoring and sFlow reports 43 12. You may include text that you want to add before the auto-generated report content in the Body Prologue field. 13. You may include text that you want to add after the auto-generated report content in the Body Epilogue field. 14. Click OK. Suspending a custom sFlow report schedule To suspend the schedule of a custom sFlow report, complete the following steps. 1. Select Monitor > Traffic Analysis > Custom Reports. 2. Select the Schedules tab. 3.
43 IP Traffic analyzer monitoring and sFlow reports 802.1X configuration requirements 802.1X user information can be displayed on sFlow reports. To ensure that this information is displayed, do the following: • Make sure the device and software release it is running supports 802.1X. • 802.1X must be enabled on the device ports. • Clients must be running software platforms that support 802.1X (for example, Windows XP operating system). • RADIUS authentication servers must have the 802.
IP Traffic analyzer monitoring and sFlow reports 43 4. To launch the sFlow Configuration wizard and configure an sFlow data collector, select Configure sFlow. Selecting a report Use the report header to configure the report display. This section explains the available fields and selection options. Report list Select the type of traffic that you want to view from the list. • • • • For Layer 2 reports, select MAC, VM, or VLAN. For L3/L4 reports, select IPv4, IPv6, IPX, AppleTalk (AT), VM, or Others.
43 IP Traffic analyzer monitoring and sFlow reports Also, if you select 1, 2, 4, or 6 hours for span, top talkers are shown as stacked bar graphs; each bar represents two minutes of data. For example, each bar below represents 2 minutes of data. Each bar is divided into the top talkers for that 2-minute period. Measure list Select how data is to be sorted: Bytes or Frames. Frames is the default.
IP Traffic analyzer monitoring and sFlow reports 43 Include Remaining Talkers The sFlow monitoring reports display the top five talkers and remaining talkers. To exclude any remaining talkers in the chart area, select this check box. Report Title and Device Group Name or Device Name and Device IP Address This field shows the name of the report, followed by one of the following: • Device group name (Group level): If you selected a report for a device group.
43 IP Traffic analyzer monitoring and sFlow reports • The 12 and 24 hour graphs show bars (not stacked bars). Each bar represents a flow aggregated for a 1-hour period. There are six bars to a set, starting with red and ending with gray. Each set represents all the flows in the system aggregated for a 1-hour period, beginning with the time shown on the x-axis. You see this time halfway between the set of six bars. The first five colors used on the graph represent the top five resource users.
IP Traffic analyzer monitoring and sFlow reports 43 • To view a report for a product, click the name of the product group to which the product belongs, and on the Product list page, click the icon for the product. 3. Click View to display the report. 4. In the Category list, select L3/L4 Reports. 5. In the Reports list, select MAC. The following information is provided: • MAC - The source and destination MAC addresses of the traffic and the VM host (Top VM Talkers reports).
43 IP Traffic analyzer monitoring and sFlow reports • MAC - The source and destination MAC addresses of the traffic and the VM host (Top VM Talkers reports). If Source and Destination VM Host column values are not related to VM, no values will display. • User (802.1X) - The name of the user who originated the traffic and the user who received the traffic. This name is the ID the client used to gain access to the network. • Frames - The size of the traffic in frames.
IP Traffic analyzer monitoring and sFlow reports 43 • L3 columns - Source - The source IP addresses of the IPv4 traffic and VM hosts (Top VM Talkers reports). If enabled, host names of the IP address are shown in parentheses. - Destination - The destination IP addresses of the IPv4 traffic and VM hosts (Top VM Talkers reports). If enabled, host names of the IP address are shown in parentheses. - TOS/DSCP - The TOS bit value or the Differentiated Services Code Points (DSCP) value in the packets.
43 IP Traffic analyzer monitoring and sFlow reports The report shows the following information: • IPV4 - Source - The source IP addresses of the IPv4 traffic. If enabled, host names of the IP address are shown in parentheses. - Destination - The destination IP addresses of the IPv4 traffic. If enabled, host names of the IP address are shown in parentheses. - TOS/DSCP - The TOS bit value or the Differentiated Services Code Points (DSCP) value in the packets.
IP Traffic analyzer monitoring and sFlow reports 43 Viewing IPv4 – top UDP talkers The Top IPV4–UDP Talkers report shows the top users of IPv4 UDP services. Complete the following steps to display the report. 1. Select Monitor > Traffic Analysis > Monitor sFlow. 2. On the Monitor sFlow dialog box, choose one of the following options: • To view a report for a device group, click the report icon for the device group you want.
43 IP Traffic analyzer monitoring and sFlow reports A subtotal is displayed for each of the top users. This subtotal is displayed by source and destination IP addresses. If the report is for a device group, the name and IP address of the device that the traffic accessed appear in parentheses. If the report is for an individual device, only the source and destination IP addresses appear. At the end of the report, a subtotal for the remaining network users and a total for the entire network are displayed.
IP Traffic analyzer monitoring and sFlow reports 43 • Mbytes - Size of the traffic in megabytes for the time duration shown on the report. A subtotal is displayed for each of the top users. This subtotal is displayed by source and destination IP addresses. If the report is for a device group, the name and IP address of the device that the traffic accessed appear in parentheses. If the report is for an individual device, only the source and destination IP addresses appear.
43 IP Traffic analyzer monitoring and sFlow reports Viewing other Layer 3 or Layer 4 Top Talkers The Others report under the Layer3/Layer 4 report category provides information on Layer 3 protocols excluding IPV4, IPV6, IPX, and AppleTalk services. Complete the following steps to display the report. 1. Select Monitor > Traffic Analysis > Monitor sFlow. 2.
IP Traffic analyzer monitoring and sFlow reports 43 Enabling and viewing TCP reports You can monitor TCP traffic to determine if there is any unusual activity on the network, such as TCP attacks. Identifying unusual activity will aid in understanding the nature of the traffic and the ports that are affected, so that you can take corrective actions. For example, you may decide to disable a port on which TCP attacks are being received.
43 IP Traffic analyzer monitoring and sFlow reports 2. Select IP Preferences from the Software Configurations list in the Category pane. 3. Go to the SFlowDataMonitoring preferences section. 4. Click in the TCPFlags_InvalidCombos parameter field to edit the invalid bit combinations. 5. Click Apply or OK to save your work. Displaying the invalid TCP Flags report Complete the following steps to display the invalid TCP flags report. 1.
IP Traffic analyzer monitoring and sFlow reports 43 • Frames - Size of the traffic in frames. • MBytes - Size of the traffic in megabytes for the time duration shown on the report. Viewing BGP paths report The BGP Paths report shows source and destination traffic based on BGP autonomous systems paths. Complete the following steps to display the report. 1. Select Monitor > Traffic Analysis > Monitor sFlow. 2.
43 IP traffic accounting Troubleshooting sFlow reports If the sFlow Monitoring report launches with an error on RedHat Linux, use the following steps to resolve. 1. Stop the server. 2. Run the command unset DISPLAY on the terminal. 3. Restart the server. NOTE You can only restart the server using the Server Management Console (Start > Programs > Management_Application_Name 11.X.X > Server Management Console).
IP traffic accounting 43 4. You have three options for displaying traffic accounting information: • Click Summary to view the entire accounting summary report for the selected group. • Click In Traffic to view inbound traffic on the ports in the selected group. • Click Out Traffic to view outbound traffic on the ports in the selected group. The number of records gathered for each device is limited to 10,000 by default.
43 1724 IP traffic accounting Brocade Network Advisor SAN + IP User Manual 53-1003155-01
Chapter 44 Flow Vision In this chapter • Flow Vision overview . . . . . . . . . . . . . . . . . . . . . . . . . . . . . . . . . . . . . . . . . . • Flow Vision features . . . . . . . . . . . . . . . . . . . . . . . . . . . . . . . . . . . . . . . . . . • Flow Vision flows . . . . . . . . . . . . . . . . . . . . . . . . . . . . . . . . . . . . . . . . . . . . . • Flow Monitor . . . . . . . . . . . . . . . . . . . . . . . . . . . . . . . . . . . . . . . . . . . . . . . . • Flow Generator . . . . . . . . .
44 Flow Vision overview Supported port types Flow Vision is supported on the following 8 Gbps- or 16 Gbps-capable FC port types. For more information on support for a specific feature, such as Flow Monitor, Flow Mirror, or Flow Generator, refer to the appropriate sections on those features. • • • • • • • • E_Ports F_Ports EX_Ports E_Port trunk F_Port trunk M_Ports (Mirror ports) SIM-Ports Base E-port Flow Vision terminology Table 148 explains the terms used in the discussion of Flow Vision.
Flow Vision features 44 Flow Vision features Flow Vision has three features: Flow Monitor, Flow Generator, and Flow Mirror. The following sections describe each feature and provide links to a more detailed explanation and to step-by-step procedures for each feature. Flow Monitor Flow Monitor provides flow monitoring and the gathering of frame statistics for fabric application flows, including the ability to learn (discover) flows automatically.
44 Flow Vision flows • Direction — A direction is implicitly defined from an ingress port to an egress port, or a source device to a destination device. For example, source device=x, destination device=y indicates traffic flowing from x to y. The bidirectional option causes the flow definition to be monitored in both directions. Figure 786 illustrates how the frame and port parameters apply to a flow.
Flow Vision flows TABLE 149 Flow definition rules Parameters Field names Rules Port Ingress Egress Frame Source Destination LUN Frame Type1 • • • • 1. 44 • Only one field must be specified Values must be explicit At least one field must be specified Values for source and destination can be explicit or “*” (“*” indicates a learned flow) Values for LUN and frame type must be explicit Refer to Table 150 for more information on frame types.
44 Flow Vision flows Supported port configurations for each feature Table 151 lists the supported configurations for each Flow Vision feature using only the basic flow parameters (ingress port and source device, egress port and destination device).
Flow Vision flows TABLE 152 44 Supported flow parameters Parameter Flow Generator Flow Monitor Flow Mirror Mirror port Not applicable Not applicable Supported LUN ID Not applicable Supported Supported Frame type Not applicable Supported Supported Number of supported flows On chassis-based platforms, Flow Vision supports a maximum of 512 user-defined flows. On fixed-port platforms, Flow Vision supports a maximum of 128 user-defined flows.
44 Flow Vision flows you must deactivate the flow and then reactivate it to use the new zone values. Flow Generator allocates the first four flows per source ID to zoned destination IDs. The rest of the destination IDs are not tested. For learned flows, no zone enforcement is applied to either the source or destination SIM-Ports. If the source or destination port for a sub-flow goes offline, the root flow is deactivated and traffic will be stopped on all sub-flows of that root flow.
Flow Vision flows 44 Monitoring flows Flow Vision enables you to monitor flows defined on devices through the Management application or CLI. Summary data for flows includes all measures supported by the Flow Vision features as well as MAPS violations on monitored flows. You can display summary data for multiple flows, set the time durations, hide and display SCSI and frame-related measures, launch performance graphs for flow data, and view flow data for any discovered fabric.
44 Flow Vision flows TABLE 154 Flows Definitions table fields and components Field and components Description Violation The number of Monitoring and Alerting Suite (MAPS) violations for the flow over the selected time duration. This field updates dynamically every 5 minutes with the violation count received from MAPS. Target Switch The switch on which you created the flow definition. Frame Type All frame types defined in the flow definition.
Flow Vision flows 44 For step-by-step instructions, refer to “Resetting flow statistics” on page 1735". 5. Delete a flow by selecting the flow that you want to delete and selecting Flow > Delete. For step-by-step instructions, refer to “Deleting flows” on page 1736". 6. Configure a MAPS monitor for a flow by selecting the flow and selecting Flow > MAPS > Configure. For step-by-step instructions, refer to “Configuring a MAPS policy” on page 2010". 7.
44 Flow Vision flows 4. Select feature_name > Reset (where feature_name is Monitor, Generator, or Mirror) from the Feature list. This clears the flow feature data for the selected device. Activating flows Activating a flow automatically clears any existing flow statistics for that flow. To activate a flow definition, complete the following steps. 1. Select the device on which you defined the flow and select Monitor > Fabric Vision > Flow > Monitor.
Flow Monitor 44 Flow Monitor Flow Monitor enables you to monitor all the traffic passing through E_Ports, EX_Ports, F_Ports, and XISL_Ports using hardware-supported flow parameters. It also lets you define your own monitoring flows using combinations of ingress or egress ports, source and destination devices, logical unit numbers (LUNs), and frame types to create a flow definition for a specific use case.
44 Flow Monitor Flow Monitor limitations The following limitations apply to all Flow Monitor flows: • Only one active learned flow is supported per ASIC. • Only supports learned flows on 16 Gbps-capable FC platforms. • For scsiread, scsiwrite, and scsirdwr frame type parameters, only monitors SCSI 6-, 10-, 12-, and 16-bit Read and Write values. Flow Monitor cannot monitor Read Long and Write Long values. • • • • • • Flow Monitor is not supported on ports with Encryption or Compression enabled.
Flow Monitor 44 • They cannot show statistics for SIM-ports. • They do not support learned flows. Creating a Flow Monitor flow definition This procedure provides step-by-step instructions for configuring a Monitor flow definition. For more specific example procedures, refer to “Flow Monitor example procedures” on page 1752". 1. Select the object on which you want to configure a flow monitor from the Connectivity Map or Product List.
44 Flow Monitor FIGURE 788 Add Flow Definition dialog box 3. Enter a name for the flow in the Name field. The name cannot be over 20 characters and can only include alphanumeric characters or underscores. NOTE For a physical switch, the name must be unique. However, for logical switches, the name does not have to be unique. 4. Select the Monitor check box. 5.
Flow Monitor 44 The Select Switch dialog box displays. To manually set the Target Switch, refer to “Selecting the target switch from a list of Fabric Vision-capable switches” on page 1743". 9. Select one of the following format options for End Device mode: • Port Address (port ID) — Select to display the source and destination device address using the port ID. • WWN (world wide name) — Select to display the source and destination device address using the port WWN. 10.
44 Flow Monitor 15. Enter the egress port data in Port (slot/port) or D,I (domain ID,port number) format in the Egress field or click the ellipsis button to select a port from the list. Enter an asterisk (*) to use any port. To select the egress port from a list, refer to “Selecting an ingress or egress port from a list of available switch ports” on page 1745". NOTE You must enter the slot number and the port number for the chassis, the slot number cannot be 0 (zero).
Flow Monitor 44 22. Select OK to save the definition. When the flow definition activates, the Flow Vision dialog box displays with the new flow selected (highlighted) in the Flow Definitions table. To review the sub-flow data for the selected flow (refer to “Monitoring a Flow Monitor flow” on page 1748"). Selecting the target switch from a list of Fabric Vision-capable switches To change target switch for the flow definition, complete the following steps. 1.
44 Flow Monitor FIGURE 789 Select Device Ports dialog box.
Flow Monitor 44 3. Select the Expand All check box to expand the Group/Product tree to show supported device ports for all discovered devices. 4. Select a device port in the Available Device Ports list and click the right arrow to move to the Selected Device Ports list. Select the Use Any Port (*) option to use any supported device port. If you already selected a device port, selecting this option clears the selection.
44 Flow Monitor Selecting a fabric or virtual fabric ID from a list of available products To select the fabric or virtual fabric ID, complete the following steps. 1. Click the ellipses button to the right of the Source or Destination field. The Select Fabric ID dialog box displays expanded to display all supported fabrics in the Available Products list. Unsupported products do not display in the Available Products list. FIGURE 791 Select Fabric ID dialog box 2.
Flow Monitor 44 Selecting a mirror port from a list of available ports Only supported on 16 Gbps-capable ports on devices running Fabric OS 7.3 or later. To select the mirror port, complete the following steps. 1. Click the ellipses button to the right of the Mirror Port field. The Select Mirror Port dialog box displays expanded to display all unoccupied, loopback, and mirror ports for the target switch in the Available list. Unsupported ports do not display in the Available list.
44 Flow Monitor Selecting a LUN ID from a list of available LUNs 4. Use this dialog box to select the LUNs associated with discovered fabrics. To select the LUN ID, complete the following steps. 1. Click the ellipses button to the right of the LUN field. The Select LUN dialog box displays with a list of fabrics with associated LUNs. FIGURE 793 Select LUN dialog box 2. Select a LUN ID in the Available Products list and click the right arrow to move to the Selected Products list.
Flow Monitor 44 4. Click the right arrow button to display the selected flow in the Flows table. You can sort the Flows table by clicking any column head. You can reverse the sort order by clicking the column head again. 5. Select the SCSI check box to display SCSI-related measures. SCSI-related measures include SCSI read count, write count, read rate, write rate, read data, write data, and read and write frame data. Clear the check box to hide SCSI-related measures. 6.
44 Flow Monitor FIGURE 794 Flow Vision dialog box (Monitor Flows table) Table 155 describes information on sub-flows displayed in the Flows table when you select Monitor from the Feature list above the Flows table. TABLE 155 1750 Flows table fields and components (Monitor flow) Fields and components Description Violation MAPS violation for the flow over the time duration selected. This column gets updated dynamically for every 5 mins with the violation count receiving from MAPS.
Flow Monitor TABLE 155 44 Flows table fields and components (Monitor flow) (Continued) Fields and components Description SCSI Read Frame Count (frames) The number of SCSI read frames as reported in the last data point for the flow. SCSI Write Frame Count (frames) The number of SCSI write frames as reported in the last data point for the flow. SCSI Read Frame Rate (f/s) The SCSI read frame rate in frames per second as reported in the last data point for the flow.
44 Flow Monitor TABLE 155 Flows table fields and components (Monitor flow) (Continued) Fields and components Description LUN Any LUN values defined in the flow definition. Bi-Directional Whether the flow is bidirectional (yes) or not (no). Flow Definition Persistence Whether the flow is configured to Persist over switch reboots (yes) or not (no). Last Updated Time The date and time the sub-flow was last updated.
Flow Monitor 44 1. Right-click an initiator port and select Fabric Vision > Flow > Add. The Add Flow Definition dialog box displays with the following criteria and flow identifiers pre-populated: • • • • • Feature — Monitor Direction — Bidirectional Source Device — Source identifier (0x010502) Destination Device — * (an asterisk allows you to use any port) Ingress port — port number (5) 2. Enter a name (lunFlow11) for the flow definition in the Name field.
44 Flow Monitor 2. Enter a name (summlow1) for the flow definition in the Name field. The name cannot be over 20 characters and can only include alphanumerics or underscores. NOTE For a physical switch, the name must be unique. However, for logical switches, the name does not have to be unique. 3. Select the Source to Destination option to gather flow data from the source device to the destination device. 4. Select the Persist over switch reboots check box to persist this flow definition over reboots.
Flow Monitor 44 5. Select the Activate all selected features check box to immediately activate the flow after creation. 6. Enter * in the Source and Destination fields to monitor frames on the ingress port (30) between all devices. 7. Click OK. The Flow Vision dialog box displays with the new flow definition highlighted. 8. Select OK to save the definition. When the flow definition activates, the Flow Vision dialog box displays with the new flow selected (highlighted) in the Flow Definitions table.
44 Flow Monitor Configuring a frame monitor flow You can use the Frame Type field to create a frame monitor flow. For more information about frame monitoring, refer to “Frame Monitor” on page 1821". The following example creates a Flow Monitor flow that counts SCSI Read-Write (scsirw) frames egressing port 2 of the switch on which the flow is running. 1. Right-click a switch port (2) on which you want to monitor frames and select Fabric Vision > Flow > Add.
Flow Monitor 44 Configuring a Top Talker monitor flow You can use the learn flow parameter (“*”) to create the equivalent to a Top Talker monitor. Use a Top Talker monitor to identify high volume flows passing a port. NOTE The Top Talker monitor is only supported on F_Ports. The following example creates an ingress Top Talker monitor.
44 Flow Monitor Configuring a Flow Monitor flow for a trunk group NOTE You cannot create a learned flow in a trunk group. Flow Monitor supports monitoring trunk ports subject to the following conditions: • Although the flow created on the trunk master port monitors data traffic for the entire port, you must create the same flow on all trunk member ports.
Flow Monitor 7. 44 Enter the egress port data in Port (slot/port) or D,I (domain ID,port number) format in the Egress field. NOTE You must enter the slot number and the port number. For Backbone chassis, the slot number cannot be 0 (zero). For switches, you must enter 0 (zero) as the slot number. For logical (virtual) switches, follow the rule for the physical chassis (either Backbone chassis or switch) from which you created the logical switch. 8. Click OK.
44 Flow Monitor FC router fabric monitors using WWNs The following examples present the flow definitions with the End Device mode set to WWN. In Figure 796, the physical devices are A, B, and C, and have the port WWNs a, b, and c, respectively. FIGURE 796 FC router fabric example In Figure 797, provides the port WWN values for the following example procedures.
Flow Monitor 44 Configuring an edge-to-edge flow through an ingress port using WWNs Figure 796, provides the values for and a diagram of the following example procedure which monitors a flow from Device A to Device B ingressing through EX_Port1 (traffic is running from left to right).
44 Flow Monitor Configuring an edge-to-edge flow through an egress port using WWNs Figure 796, provides the values for and a diagram of the following example procedure which monitors a flow from Device B to Device A egressing through EX_Port1 (traffic is running from right to left).
Flow Monitor 44 Configuring a backbone-to-edge flow through an egress port using WWNs Figure 796, provides the values for and a diagram of the following example procedure which monitors a flow from Device C to Device A egressing through EX_Port1 (traffic is running from right to left). The following procedure creates a flow (b2e_dst_dcx) that filters out frames passing from the backbone fabric (20:02:00:11:0d:51:00:00) to an edge fabric (10:00:00:05:1e:e8:e2:00) using a specific egress port (219). 1.
44 Flow Monitor Configuring an edge-to-backbone flow through an ingress port using WWNs Figure 796, provides the values for and a diagram of the following example procedure which monitors a flow from Device A to Device C ingressing through EX_Port1 (traffic is running from left to right). The following procedure creates a flow (e2b_src_dcx) that filters out frames passing from the backbone fabric (10:00:00:05:1e:e8:e2:00) to an edge fabric (20:02:00:11:0d:51:00:00) using a specific egress port (219). 1.
Flow Monitor 44 FC router fabric monitors using virtual port IDs The following examples present flow definitions configured with the End Device mode set to Port Address (port ID). In Figure 798, the physical devices are A, B, and C. The virtual devices are Device A′, B′, C′, A″, B″, and C″, representing the physical devices A, B, and C, respectively.
44 Flow Monitor Configuring an edge-to-edge flow through an ingress port using virtual port IDs Figure 799, provides the values for and a diagram of the following example procedure which monitors a flow from Device A to Device B ingressing through EX_Port1, the source device is Device A, the destination device is Device B′, and the ingress port is EX_Port1 (traffic is running from left to right).
Flow Monitor 44 Configuring an edge-to-edge flow through an egress port using virtual port IDs Figure 799, provides the values for and a diagram of the following example procedure which monitors a flow from Device B to Device A egressing through EX_Port1, the source device is Device B′, the destination device is Device A, and the egress port is EX_Port1 (traffic is running from right to left).
44 Flow Monitor Configuring a backbone-to-edge flow through an egress port using virtual port IDs Figure 799, provides the values for and a diagram of the following example procedure which monitors a flow from Device C to Device A egressing through EX_Port1, the source device is Device C′, the destination device is Device A, and the egress port is EX_Port1 (traffic is running from right to left).
Flow Monitor 44 Configuring a edge-to-backbone flow through an ingress port using virtual port IDs Figure 799, provides the values for and a diagram of the following example procedure which monitors a flow from Device A to Device C ingressing through EX_Port1, the source device is Device A, the destination device is Device C′, and the ingress port is EX_Port1 (traffic is running from left to right).
44 Flow Monitor FC router fabric monitors using fabric IDs The following examples present flow definitions configured with the FCR/XISL mode set to Fabric ID (FC router fabric ID). NOTE This feature is only supported on 16 Gbps-capable platforms running Fabric OS 7.3 or later.
Flow Monitor 44 12. Select OK to save the definition. When the flow definition activates, the Flow Vision dialog box displays with the new flow selected (highlighted) in the Flow Definitions table. To review the sub-flow data for the selected flow, refer to “Monitoring a Flow Monitor flow” on page 1748".
44 Flow Monitor When the flow definition activates, the Flow Vision dialog box displays with the new flow selected (highlighted) in the Flow Definitions table. To review the sub-flow data for the selected flow, refer to “Monitoring a Flow Monitor flow” on page 1748".
Flow Monitor 44 XISL and backbone E_Port monitors Flow Monitor supports both static and learned monitoring of fabric-wide statistics on both XISL_Ports and backbone E_Ports. You can use this data to estimate the logical fabric or inter-fabric utilization of an XISL_Port or a Backbone E_Port. The following examples present flow definitions configured with the FCR/XISL mode set to VFID (virtual fabric ID). NOTE This feature is only supported on 16 Gbps-capable platforms running Fabric OS 7.3 or later.
44 Flow Monitor 7. Select the VFID option for FCR/XISL mode. 8. Enter the source edge fabric ID in the Source field. To select the source from a list, refer to “Selecting a fabric or virtual fabric ID from a list of available products” on page 1746". 9. Enter the destination edge fabric ID in the Destination field. To select the destination from a list, refer to “Selecting a fabric or virtual fabric ID from a list of available products” on page 1746". 10. Select OK to save the definition.
Flow Monitor 44 11. Select OK to save the definition. When the flow definition activates, the Flow Vision dialog box displays with the new flow selected (highlighted) in the Flow Definitions table. To review the sub-flow data for the selected flow, refer to “Monitoring a Flow Monitor flow” on page 1748".
44 Flow Generator Flow Generator Flow Generator is a test traffic generator for pre-testing the SAN infrastructure (including internal connections) for robustness before deploying it. Flow Generator provides you with the ability to: • Configure a 16 Gbps FC-capable port as a simulated device that can transmit frames at full 16 Gbps line rate. • Emulate a 16 Gbps SAN without actually having any 16 Gbps hosts or targets or SAN-testers.
Flow Generator 44 FIGURE 800 Flow Generator flow structure Flow Generator limitations The following limitations apply specifically to Flow Generator: • If used on a live production system, Flow Generator traffic will compete with any existing traffic. Consequently, E_Ports and FCIP links can become congested when using Flow Generator, leading to throughput degradation. FCIP links are more prone to congestion than E_Ports. • Flow Generator is only supported on 16 Gbps-capable FC devices.
44 Flow Generator SIM-Ports Before you create and activate a Flow Generator flow, you must set the source device and destination device ports in simulation mode (SIM-Port mode). Setting the port to SIM-Port mode sets an internal loopback on the port and creates a filter that discards all incoming Flow Generator frames. This ensures that test flows are not unintentionally transmitted to real devices. A SIM-Port simulates an F_Port on the switch using the port WWN or virtual WWN.
Flow Generator 44 • SIM-Ports cannot be configured as any of the following port types; these restrictions also apply at the time a SIM-Port is enabled: - Any port running encryption or compression Any F_Port connected to a real device (unless the port is disabled) D_Port (Diagnostic Port) E_Port EX_Port F_Port trunk Fastwrite port FCoE port ICL port L_Port M_Port (Mirror Port) VE port • The following features of a SIM-Port are persistent across a reboot: - Each SIM-Port is assigned a PID.
44 Flow Generator Disabling SIM-Port mode To disable SIM-Port mode, use the following steps. 1. Select the SIM-Port for the source device in the Product List, and then select Monitor > Fabric Vision > Flow > SIM Mode > Disable. 2. Select the SIM-Port for the destination device in the Product List, and then select Monitor > Fabric Vision > Flow > SIM Mode > Disable. Creating a Flow Generator flow definition This procedure provides step-by-step instructions for configuring a Generator flow definition.
Flow Generator 44 10. Select one of the following format options for End Device mode: • Port Address (port ID) — Select to display the source and destination device address using the port ID. • WWN (world wide name) — Select to display the source and destination device address using the port WWN. 11. Enter the address or WWN of the source port in the Source field or click the ellipsis button to select a port from the list. Enter an asterisk (*) to use any port.
44 Flow Generator 16. Enter the egress port in Port (slot/port) or D,I (domain ID,port number) format for the SIM-Port in the Egress field or click the ellipsis button to select a port from the list. Enter an asterisk (*) to use any port. To select the egress port from a list, refer to “Selecting an ingress or egress port from a list of available switch ports” on page 1745". NOTE You must enter the slot number and the port number. For Backbone chassis, the slot number cannot be 0 (zero).
Flow Generator 44 3. Select Generator > Configure from the Feature list. The Configure Generator dialog box displays. FIGURE 801 Configure Generator dialog box 4. Define the frame payload size by choosing one of the following options: • To configure a specific frame payload size in bytes, select the Bytes option and enter the size you want in the Bytes field. The frame payload size value must be a multiple of 4 in the range from 64 through 2048. (64, 120, 140, 320, 512 and so on).
44 Flow Generator 5. Select the SCSI check box to display SCSI-related measures. SCSI-related measures include SCSI read count, write count, read rate, write rate, read data, write data, and read and write frame data. Clear the check box to hide SCSI-related measures. 6. Select the Frame check box to display frame-related measures.
Flow Generator 44 FIGURE 802 Flow Vision dialog box (Generator Flows table) Table 155 describes information on sub-flows displayed in the Flows table when you select Generator from the Feature list above the Flows table. TABLE 157 Flows panel information (Generator flow) Column Information Displayed Sub Flow Id The sub-flow database identifier. Target Switch The switch on which you created the flow definition. Frame Type All frame types defined in the flow definition.
44 Flow Generator TABLE 157 Flows panel information (Generator flow) (Continued) Column Information Displayed Generator Number of complete runs (count) The number of complete runs reported in the last data point received for the flow. Generator Percent Complete of the Curent run (percentage) The percentage completion of the current run reported in the last data point received for the flow. Ingress Port The ingress port defined in the flow definition. The port name is a hyperlink.
Flow Generator 44 The Add Flow Definition dialog box displays with the following criteria and flow identifiers pre-populated: • • • • • Feature — Monitor Direction — Bidirectional Source Device — Source identifier (0x040100) Destination Device — * (an asterisk allows you to use any port) Ingress port — SIM-Port number (1/1) 3. Enter a name (flowcase1) for the flow definition in the Name field. The name cannot be over 20 characters and can only include alphanumeric characters or underscores.
44 Flow Mirror • • • • • Feature — Monitor Direction — Bidirectional Source Device — Source identifier (0x010100) Destination Device — * (an asterisk allows you to use any port) Ingress port — SIM-Port number (1/1) 3. Enter a name (flowCase3Src) for the flow definition in the Name field. The name cannot be over 20 characters and can only include alphanumeric characters or underscores. NOTE For a physical switch, the name must be unique.
Flow Mirror 44 Flow Mirror duplicates the specified frames in a user-defined flow, and sends them to a mirror port. There are two types of mirrors: • CPU Mirroring — Sends the duplicated frames to the local switch Control Processor Unit (CPU); however, CPU Mirroring has a limit of 256 frames per second. • Local Flow Mirroring (LFM) — Sends the duplicated frames to an unoccupied, loopback, or mirror port on the same physical switch on which you defined the flow.
44 Flow Mirror Flow Mirror limitations • • • • Flow Mirror is only supported on 16 Gbps-capable FC devices. Flow Mirror is only supported on F_Ports or F_Port trunks operating at 8 Gbps or less. Flow Generator flows can only be mirrored at the ingress port. Flow Mirror requires a Fabric Vision license on the device where you are creating a mirrored flow. • Flow Mirror only supports one active flow per device. • Flow Mirroring is supported in Virtual Fabric and non-Virtual Fabric mode.
Flow Mirror 44 5. Select one of the following options: • CPU Mirroring Select to mirror traffic to the switch CPU, which enables you perform debugging without disturbing existing connections. By default, CPU Mirroring is enabled. • Local Flow Mirror Select to mirror traffic to an unoccupied, loopback, or mirror port on the selected target switch, which enables you to mirror a flow to a specific port, which is present on the same physical switch on which you defined the flow.
44 Flow Mirror 13. Select one of the following format options for Switch mode: • Port (slot/port) — Select to display the switch ingress or egress port using the slot and port number. • D,I (domain ID, port number) — Select to display the switch ingress or egress port using the domain ID and port number. 14. Enter the ingress port in Port (slot/port) or D,I (domain ID,port number) format in the Ingress field or click the ellipsis button to select a port from the list.
Flow Mirror 44 To select a port from a list, refer to “Selecting a mirror port from a list of available ports” on page 1747". 20. Enter a frame type in the Frame Type field or click the ellipsis button to select a frame type from a list. To select a frame type from a list, refer to “Selecting a mirror port from a list of available ports” on page 1747". 21. Enter a LUN ID in the LUN field or click the ellipsis button to select a LUN ID from the list. NOTE You cannot use LUN IDs for Bidirectional flows.
44 Flow Mirror 6. Select the Frame check box to display frame-related measures. Frame-related measures include transmit (Tx) and receive (Rx) frame count, transmit frame and receive frame rate, transmit and receive word count, and transmit and receive throughput. Clear the check box to hide frame-related measures. 7. Review the sub-flow data for the selected Flow Mirror flow.
Flow Mirror 44 FIGURE 805 Flow Vision dialog box (Mirror Flows table) Table 158 describes the sub-flow data displayed in the Flows table when you select Mirror from the Feature list above the Flows table. TABLE 158 Flows table fields and components (Mirror Flow) Field and components Description Sub Flow Id The sub-flow database identifier. Target Switch The switch on which you created the flow definition. Frame Type All frame types defined in the flow definition.
44 Flow Mirror TABLE 158 Flows table fields and components (Mirror Flow) (Continued) Field and components Description Mirrored Receive Frames (frames) The number of received mirrored frames as reported in the last data point received for the flow. Ingress Port The ingress port defined in the flow definition. The port name is a hyperlink. Click to launch the port’s property sheet. A yellow icon indicates a bottlenecked port. Egress Port The egress port defined in the flow definition.
Flow Mirror 44 2. Enter a name (flow_scsi) for the flow definition in the Name field. The name cannot be over 20 characters and can only include alphanumeric characters or underscores. NOTE For a physical switch, the name must be unique. However, for logical switches, the name does not have to be unique. 3. Clear the Monitor check box. 4. Select the Mirror check box. 5. Select the CPU Mirroring or Local Flow Mirror option. By default, CPU Mirroring is enabled. 6.
44 Flow Mirror 2. Enter a name (flow_protocol) for the flow definition in the Name field. The name cannot be over 20 characters and can only include alphanumeric characters or underscores. NOTE For a physical switch, the name must be unique. However, for logical switches, the name does not have to be unique. 3. Clear the Monitor check box. 4. Select the Mirror check box. 5. Select the CPU Mirroring or Local Flow Mirror option. By default, CPU Mirroring is enabled. 6.
Flow Mirror 44 1. Right-click a target port (15) and select Fabric Vision > Flow > Add. The Add Flow Definition dialog box displays with the following criteria and flow identifiers pre-populated: • • • • • Feature — Monitor Direction — Bidirectional Source Device — Source identifier Destination Device — * (an asterisk allows you to use any port) Egress port — port number (1/20) 2. Enter a name (flow_slowdrain) for the flow definition in the Name field.
44 Flow Mirror • • • • Direction — Bidirectional Source Device — Source identifier Destination Device — * (an asterisk allows you to use any port) Ingress port — port number (F1) 2. Enter a name (mirror_scsismd) for the flow definition in the Name field. The name cannot be over 20 characters and can only include alphanumeric characters or underscores. NOTE For a physical switch, the name must be unique. However, for logical switches, the name does not have to be unique. 3. Clear the Monitor check box.
Flow Mirror 44 • Destination Device — * (an asterisk allows you to use any port) • Ingress port — port number (F1) 2. Enter a name (cpu_mirror_scsicmdsts) for the flow definition in the Name field. The name cannot be over 20 characters and can only include alphanumeric characters or underscores. NOTE For a physical switch, the name must be unique. However, for logical switches, the name does not have to be unique. 3. Clear the Monitor check box. 4. Select the Mirror check box. 5.
44 Predefined flow definition templates 3. Clear the Monitor check box. 4. Select the Mirror check box. 5. Select the Local Flow Mirror option. By default, CPU Mirroring is enabled. 6. Select the Persist over switch reboots check box to persist this flow definition over reboots. 7. Select the Activate all selected features check box to immediately activate the flow after creation. 8. Enter the source device (H1) in the Source field. 9. Enter an asterisk (*) in the Destination field. 10.
Predefined flow definition templates TABLE 159 44 Predefined templates (Continued) Port type Template name Platform support Required Fabric OS version 16 Gbps-capable port blade 8 Gbps-capable port blade Storage Port Learn Flows to Storage Supported Not Supported v7.2.0 or later Monitor All Flows to Storage Supported Supported v7.2.0 or later Learn Flows on Port Supported Not Supported v7.2.0 or later Monitor Flows to LUN Supported Supported v7.2.
44 Predefined flow definition templates FIGURE 807 List of preconfigured flow templates The Add Flow - predefined_flow dialog box displays, as shown in (Figure 808). FIGURE 808 Sample Add Flow - predefined_monitor dialog box 3. Enter a name for the flow definition in the Flow Name field. 4. Select one of the following format options from the Device View list: • Port Address (port ID) — Select to display the source and destination device address using the port ID.
Predefined flow definition templates 44 Enter an asterisk (*) to use any port. To select the destination port from a list, refer to “Selecting an end device port from a list of available device ports” on page 1743". 7. Click Show Details to view information about the Target Switch, Ingress, and Egress ports based on the selected port. This data is not editable. Click Hide Details to hide the Target Switch, Ingress, and Egress port information. 8. Click OK to deploy the flow definition.
44 Predefined flow definition templates The reason for sucess or failure displays in the Details area. To review the sub-flow data for the selected flow, refer to “Monitoring flows” on page 1733". Predefined flow definition templates for initiator group and storage array The predefined flow templates only display when you select a Flow Vision-capable initiator, or initiator group, or storage, or storage array. 1.
Predefined flow definition templates 44 • LUN Monitoring — Use this Add Flow Definition-LUN Monitoring dialog box to define unidirectional Monitor flow between a source and a destination device with the LUN details. Refer to “Configuring LUN Monitoring predefined template” on page 1811" for more information.
44 Predefined flow definition templates 4. Click OK to deploy the flow definition. The Deployment Status dialog box displays with a list of all defined flows in the Flow Definitions Status table, as shown is Figure 809. Refer to Table 160 for the data displayed in the Flow Definitions Status table. FIGURE 812 Deployment Status dialog box 5. Click Start to deploy the flow definitions. 6.
Predefined flow definition templates 44 FIGURE 813 Add Flow Definition - Aggregated Flow template dialog box Perfom the following steps, in the Add Flow Definition - Aggregated Flow dialog box: The default Device View is Port Address. 1. The Flow Name field is filled with the predefined flow name and the format is _. 2. Continue from step 2 through step 6 in “Configuring Static Flow template” on page 1807" to deploy the flow definition.
44 Predefined flow definition templates Configuring Frame Type Monitoring template The Frame Type Monitoring template creates flow rows like Static Flow template with frame types as shown in Figure 814. FIGURE 814 Add Flow Definition - Frame Type Monitoring template dialog box Perfom the following steps, in the Add Flow Definition - Frame Type Monitoring dialog box: The default Device View is Port Address. 1.
Flow Vision interoperability with other features 44 Configuring LUN Monitoring predefined template The LUN Monitoring template creates flow rows like Static Flow template including the LUN ID field. You can configure LUN ID for the flows as shown in Figure 815. FIGURE 815 Add Flow Definition - LUN Monitoring template dialog box Perfom the following steps, in the Add Flow Definition - LUN Monitoring dialog box: The default Device View is Port Address. 1.
44 Flow Vision interoperability with other features Creating a Frame Viewer flow definition 1. Select a frame from the Discarded Frame Log for the Selected Product list in the Discarded Frames dialog box. 2. Click Add Flow. 3.
Flow Vision interoperability with other features TABLE 161 44 Add Flow Definition dialog box fields and options populated per Bottlenecks selection Port selected Options and fields populated E_Port • • • • • • • • • • • • • • • • • • • • Initiator Target Any port other than E_Port, initiator, or target port Brocade Network Advisor SAN + IP User Manual 53-1003155-01 Target Switch = Selected switch Source Device = * if port is on a 16-Gbps switch, otherwise empty Destination Device = * if port is
44 Flow Vision interoperability with other features FC Trace Route integration with Flow Vision You can create a flow definition based on trace route data (forward routes, reverse routes, and FC ping). For more information about trace route and ping, refer to “Tracing FC routes” on page 1588". Creating a Forward Route flow definition You can create a flow definition based on forward route data. 1. Select a row on the Forward Route tab in the Trace Route Summary dialog box. 2. Click Add Flow.
Flow Vision interoperability with other features 44 Creating a Reverse Route flow definition You can create a flow definition based on reverse route data. For more information about trace route and ping, refer to “Tracing FC routes” on page 1588". 1. Select a row on the Reverse Route tab in the Trace Route Summary dialog box. 2. Click Add Flow. The Add Flow Definition dialog box displays with fields and options populated based on the selected row.
44 Flow Vision interoperability with other features Creating a FC Ping flow definition You can create a flow definition based on FC ping data. For more information about trace route and ping, refer to “Tracing FC routes” on page 1588". 1. Select a row on the FC Ping tab in the Trace Route Summary dialog box. 2. Click Add Flow.
Flow Vision interoperability with other features TABLE 164 44 Add Flow Definition dialog box options populated per port connectivity row selection Row selected Options populated Target Target Switch = Selected port's connected switch Source Device = * if port is on a 16-Gbps switch, otherwise empty Destination Device = Target port ID Ingress Port = Selected port's connected switch port number Direction = Bidirectional Row other than the first or last row Target Switch = Selected switch Source Devic
44 Flow Vision interoperability with other features Performance integration with Flow Vision You can use the performance graphs (historical or real-time) to monitor flows. For platforms running Fabric OS 7.2 or later, Flow Vision replaces Top Talker and End-to-End monitoring. Monitoring flows using a performance graph 1. Select Monitor > Fabric Vision > Flow > Monitor. The Flow Vision dialog box displays. 2. Select a row in the Flows list. 3.
Flow Vision interoperability with other features 44 5. Select the measures you want to display in the graph in the Select Network Objects and Measures list and click the right arrow button. Select multiple measures by holding down the CTRL key and clicking more than one measure. Select all measures for a flow by selecting the flow. 6. Remove measures from the graph by selecting the measure beneath the graph and clicking the left arrow button. 7.
44 Flow Vision interoperability with other features To continue using the legacy End-to-End feature, you must deactivate existing flows defined for the switch (refer to “Deactivating flows” on page 1736").
Chapter 45 Frame Monitor In this chapter • Frame Monitor . . . . . . . . . . . . . . . . . . . . . . . . . . . . . . . . . . . . . . . . . . . . . . • Creating a custom frame monitor . . . . . . . . . . . . . . . . . . . . . . . . . . . . . . • Editing a frame monitor . . . . . . . . . . . . . . . . . . . . . . . . . . . . . . . . . . . . . . • Assigning a frame monitor to a port. . . . . . . . . . . . . . . . . . . . . . . . . . . . . • Finding frame monitor assignments . . . . . . . . . . . . . . . . .
45 Frame Monitor Pre-defined frame types Pre-defined frame types include the following: • • • • • • • • • ABTS (Abort Sequence Basic Link Service command) BA_ACC (Abort Accept) IP SCSI SCSI Read SCSI Write SCSI RW SCSI-2 Reserve SCSI-3 Reserve Custom frame types In addition to the standard frame types, you can create custom frame types to gather statistics that fit your needs. To define a custom frame type, you must specify a series of offsets, bitmasks, and values.
Creating a custom frame monitor 45 • Frame Monitoring requires the Advanced Performance Monitoring license and the Fabric Watch license. NOTE The Advanced Performance Monitoring license is required to configure frame monitors. The monitoring functionality requires the Fabric Watch license. The maximum number of frame monitors and offsets per port is platform-specific. Refer to the Flow Vision Administrator’s Guide for more information.
45 Creating a custom frame monitor 4. Select one or more switches in the Products / Monitors list, and click the right arrow button to assign the frame monitor to those switches. 5. Select the Port option. 6. Expand the switch in the Products / Ports list. The Monitors list displays all of the frame monitors defined for that switch. 7. Select one or more ports. You must select only ports belonging to the same switch. 8. Select one or more frame monitors in the Monitors list. 9.
Editing a frame monitor 45 Editing a frame monitor 1. Select Monitor > Fabric Watch > Frame Monitor. The Frame Monitor dialog box displays. 2. Select the Switch option. 3. Expand the Products / Monitors list to display the frame monitors for each switch. 4. Select a frame monitor and click the left arrow button. The frame monitor is removed from the switch and the Configure Monitor area is populated with the values for that frame monitor. 5. Make changes to the monitor data in the Configure Monitor area.
45 Finding frame monitor assignments 6. Click the right arrow button to move the frame monitor to the selected ports. The Monitor Details list displays the monitors that are assigned to a selected port. If no monitors are assigned, or if more than one port is selected, the Monitor Details list does not display. 7. Click OK. The Frame Monitor Configuration Status dialog box displays. 8. Click Start. The frame monitor configuration is applied to the ports. 9.
Removing a frame monitor from a switch 45 8. Click Start. The frame monitor configuration is applied to the ports. 9. Click Close after configuration is complete (indicated by “Completed” in the Progress column). Removing a frame monitor from a switch When you remove a frame monitor from a switch, the frame monitor is automatically removed from all assigned ports in the switch. You can remove only custom frame types; you cannot remove the pre-defined frame types. 1.
45 1828 Removing a frame monitor from a switch Brocade Network Advisor SAN + IP User Manual 53-1003155-01
Chapter 46 Power Center In this chapter • Power center overview. . . . . . . . . . . . . . . . . . . . . . . . . . . . . . . . . . . . . . . . • Data monitoring . . . . . . . . . . . . . . . . . . . . . . . . . . . . . . . . . . . . . . . . . . . . . • PoE power on demand . . . . . . . . . . . . . . . . . . . . . . . . . . . . . . . . . . . . . . . • Schedule PoE power deployment . . . . . . . . . . . . . . . . . . . . . . . . . . . . . . . • PoE thresholds. . . . . . . . . . . . . . . . . . . . . . . .
46 Data monitoring Data monitoring Power Center enables you to view PoE data for ports and products in both table and chart formats. Viewing PoE data for products To view PoE data for a product, complete the following steps. 1. Select Monitor > Power Center. The Power Center dialog box displays. 2. Select PoE Products from the View list. FIGURE 820 Power Center dialog box 3.
Data monitoring 46 • Allocation % — The percentage of allocated capacity. For example, if the Capacity (W) is 480 W and Allocation (W) is 120 W, then the Allocation percentage is 25. Only displays when the product running agent version 7.2.2 or later. If the product is running a agent version 7.2.1 or earlier, “-“ displays. • Consumption (W) — The power consumed by all powered devices connected to the product in Watts. • Consumption % — The current power consumed as a percentage of allocated power.
46 Data monitoring 4. Review the details in the Port Data list: • • • • • • Product filter — The name of the Product. Port filter — The port identifier. Name filter — The port name. Status filter — The Ethernet status of the port. Values include: Up and Down. State filter — The Ethernet state of the port. Values include: Enabled and Disabled. Admin State filter — The PoE administrative state of the port. Values include: On (enabled) and Off (disabled). • Oper.
Data monitoring 46 4. Use the following filters to sort the Port Data list: • • • • • • • Product filter Port filter Name filter Status filter State filter Admin State filter Oper. State filter NOTE The administrative state must be On for operational state to be On. • • • • • • • • • Allocation (W) filter Consumption (W) filter Consumption % filter Type filter Class filter Priority filter Mfr. filter. Model filter Software filter 5. Click Close to close the Power Center dialog box.
46 Data monitoring FIGURE 822 Attached Devices tab of the Properties dialog box 4. Review the details in the Attached Devices tab: • POE Port Count — The number of PoE ports, that have power devices which support LLDP, connected to the selected device. • • • • • • System name — The system name of the connected device. System capabilities — The system capabilities enabled on the remote system. Enabled capabilties — The system capabilities enabled on the connected device.
Data monitoring 46 • Med Serial number — The serial number on the connected device. • Med Manufacturer — The manufacturer name on the connected device. • Med Model name — The model name on the connected device. 5. Click OK to close the Properties dialog box. 6. Click Close to close the Power Center dialog box. Viewing PoE charts To view a PoE chart, complete the following steps. 1. Select Monitor > Power Center. The Power Center dialog box displays. 2. Select Charts from the View list. 3.
46 Data monitoring FIGURE 824 Product Power Consumption Percentage bar graph Displays the power consumption percentages for all products in a bar graph using the following colors: • • • • • 0 – 20 % = Green 20 – 40 % = Blue 40 – 60 % = Yellow 60 – 80 % = Orange 80 – 100 % = Red Click a bar in the chart to display the products panel and highlight the corresponding products.
Data monitoring 46 FIGURE 826 Product Power Top Allocations stacked bar graph Displays the top five products with the highest power allocation values in Watts in a stacked bar graph. Click a bar in the chart to display the products panel and highlight the corresponding product. FIGURE 827 Product Power Top Consumers stacked bar graph Displays the top five products with the highest power consumption values in Watts in a stacked bar graph.
46 Data monitoring FIGURE 828 PoE Port Utilization pie chart Displays how many ports with PoE turned on and how many with connected devices in a pie chart using the following colors: • PoE Off = Red • PoE On - Unconnected = Blue • PoE On - Connected = Green Click the pie chart to display the products panel and highlight the All Products row. 4. Click Close to close the Power Center dialog box.
PoE power on demand 46 Configuring automatic data refresh To configure automatic refresh the PoE data, complete the following steps. 1. Select Monitor > Power Center. The Power Center dialog box displays. 2. Select the Auto refresh check box to refresh the data automatically at a specified interval. 3. Select the auto refresh interval from the Interval (min) list. Options include: 15, 30, or 60. 4. Click Close to close the Power Center dialog box.
46 PoE power on demand 3. Select a product in the PoE Product list. The selected Product’s PoE ports display in the Port Data list. The PoE operational state (On or Off) for each port displays in the Admin State column. 4. Select one or more ports and click PoE On. 5. Click Yes on the confirmation message. The Deployment Status dialog box displays, which allows you to view the progress and status of the deployment. Click Abort to stop the deployment.
Schedule PoE power deployment 46 6. Click Close to close the Deployment Status dialog box. NOTE Closing the Deployment Status dialog box does not stop deployment. The updated PoE operational state of the selected port displays in the Admin State column. 7. Click Close to close the Power Center dialog box. Schedule PoE power deployment You can define a deployment schedule on a port, product, port group, or product group.
46 Schedule PoE power deployment FIGURE 830 Schedule PoE On/Off dialog box 4. (Ports only) Select a port from the Port list. 5. Enter a name for the schedule in the Schedule Name field. 6. Enter a description for the schedule in the Description field. 7. Select the Enable check box to enable the schedule. 8. Select the PoE On option to enable PoE. 9.
Schedule PoE power deployment 46 Configuring a one-time deployment schedule To configure a one-time schedule, complete the following steps. 1. Select One Time from the Frequency list. 2. Select the time of day you want deployment to run from the Time (hh:mm) lists. Where the hour value is from 1 through 12, the minute value is from 00 through 59, and the day or night value is AM or PM. 3. Click the Date list to select a date from the calendar.
46 Schedule PoE power deployment Configuring a daily deployment schedule To configure a daily deployment schedule, complete the following steps. 1. Select Daily from the Frequency list. 2. Select the time of day you want deployment to run from the Time (hh:mm) lists. Where the hour value is from 1 through 12, the minute value is from 00 through 59, and the day or night value is AM or PM.
Schedule PoE power deployment 46 Configuring a monthly deployment schedule To configure a monthly schedule, complete the following steps. 1. Select Monthly from the Frequency list. 2. Select the time of day you want deployment to run from the Time (hh:mm) lists. Where the hour value is from 1 through 12, the minute value is from 00 through 59, and the day or night value is AM or PM. 3. Select the day you want deployment to run from the Day of the Month list (1 through 31).
46 Schedule PoE power deployment Scheduling a power down deployment To schedule a power down deployment on one or more PoE-capable ports, complete the following steps. 1. Select Monitor > Power Center. The Power Center dialog box displays. 2. Select PoE Products from the View list. 3. Select a port, product, port group, or product group in the PoE Product list and click Schedule PoE On/Off. The Schedule PoE On/Off dialog box displays. 4. (Ports only) Select a port from the Port list. 5.
Schedule PoE power deployment 46 Updating a power deployment schedule To update a power deployment on one or more PoE-capable ports, complete the following steps. 1. Select Monitor > Power Center. The Power Center dialog box displays. 2. Select PoE Products from the View list. 3. Select a port, product, port group, or product group in the PoE Product list and click Schedule PoE On/Off. The Schedule PoE On/Off dialog box displays. 4. Select the schedule you want to update from the All Schedules list.
46 Schedule PoE power deployment Viewing the configured ports for a power deployment schedule To view all ports to which a power deployment schedule is configured, complete the following steps. 1. Select Monitor > Power Center. The Power Center dialog box displays. 2. Select PoE Products from the View list. 3. Select a port, product, port group, or product group in the PoE Product list and click Schedule PoE On/Off. The Schedule PoE On/Off dialog box displays. 4.
Schedule PoE power deployment • • • • 46 Consumption (W) — The power consumed by the device connected to the port in Watts. Consumption % — The power consumed as a percentage of allocated power. Type — The type of the device connected to the port. Values include: 802.3af and 802.3at. Class — The class of the device connected to the port. Values include: Class 0 through Class 4. • Priority — The priority of the device connected to the port. Values include: invalid, critical, high, low, medium, and other.
46 PoE thresholds PoE thresholds Power Center enables you to define a threshold on a product or port. You cannot define a threshold on a product group or port group. You can define Product thresholds using the following measures: • PoE Capacity — The total PoE capacity of the product in Watts. NOTE PoE capacity requires the product to be running agent version 7.2.2 or later. • PoE Allocation — The amount of allocated power to the product in Watts. • Allocation % — The percentage of available capacity.
PoE thresholds 46 FIGURE 832 Thresholds dialog box 3. Choose one of the following measures: • • • • • • PoE Capacity (The product must be running agent version 7.2.2 or later.) PoE Allocation Allocation % (The product must be running agent version 7.2.2 or later.) PoE Consumption Consumption % Allocations Count (The product must be running agent version 7.2.2 or later.) 4. Select one of the following from the Conditions list: • > • < • == 5.
46 PoE thresholds 7. Select the time period to be monitored for the number of threshold events in the Interval (min) list. The time period starts with the first event and runs its full duration if the event limit is not reached. Interval values, in minutes, include: • 15 • 30 • 60 Click Refresh on the Power Center dialog box to determine if any thresholds are triggered. 8. Click Add. The new threshold displays in the All Thresholds list. 9.
PoE thresholds 46 FIGURE 833 Thresholds dialog box 3. Choose one of the following measures: • Port allocation • Port consumption • Port consumption % 4. Select one of the following from the Conditions list: • > • < • == 5. Enter the number of events that must be generated to trigger the threshold event in the Value field. The value should not exceed the capacity of the product. If you select a percentage measure, the value should be less than or equal to 100. 6.
46 PoE thresholds 7. Select the time period to be monitored for the number of threshold events in the Interval (min) list. The time period starts with the first event and runs its full duration if the event limit is not reached. Interval values, in minutes, include: • 15 • 30 • 60 8. Click Add. The new threshold displays in the All Thresholds list. 9. Select the Enabled check box of the new threshold in the All Thresholds list to enable the threshold on the product. 10.
PoE thresholds 46 Updating a PoE threshold To update a PoE threshold, complete the following steps. 1. Select Monitor > Power Center. The Power Center dialog box displays. 2. Select a product in the PoE Product list and click Thresholds. The Thresholds dialog box displays with the thresholds defined for that product. 3. Select the threshold you want to edit in the All Thresholds list. The selected threshold displays in the Thresholds Editor area. 4.
46 PoE thresholds 12. Click Refresh on the Power Center dialog box to determine if any thresholds are triggered. 13. Click Close to close the Power Center dialog box. Enabling PoE thresholds To enable PoE thresholds, complete the following steps. 1. Select Monitor > Power Center. The Power Center dialog box displays. 2. Select a product in the PoE Product list and click Thresholds. The Thresholds dialog box displays with the thresholds defined for that product. 3.
Viewing PoE performance 46 Deleting PoE thresholds 1. Select Monitor > Power Center. The Power Center dialog box displays. 2. Select a product in the PoE Product list and click Thresholds. The Thresholds dialog box displays with the thresholds defined for that product. 3. Select the threshold you want to delete and click Delete. Select more than one threshold to delete by pressing Ctrl and clicking each threshold you want to delete. 4. Click Close to close the Thresholds dialog box. 5.
46 Viewing PoE performance FIGURE 834 Real Time Power Graphs/Tables dialog box 4. Select the measures you want to include and click the right arrow button to display it on the Data Monitoring tab. Product power measures include the following: • Allocation (W) • Allocation % 5. Click the Data Monitoring tab to view a performance monitoring graph or table. • Click the Graph option to view a performance graph. The legend under the graph shows what data each color represents.
Viewing PoE performance 46 6. Click the Collection Status Summary tab to view the following information: The Collection Status Summary tab provides a high level overview of all defined collectors. The information is displayed in the following columns: • Product - Shows the product name and IP address. There maybe multiple instances of the product name for each collectible assigned to the product. • Port - The port name when a port is selected.
46 Viewing PoE performance The Real Time Power Graphs/Tables dialog box displays. FIGURE 835 Real Time Power Graphs/Tables dialog box 4. Select the measures you want to include and click the right arrow button to display it on the Data Monitoring tab.
Viewing PoE performance 46 5. Click the Data Monitoring tab to view a performance monitoring graph or table. • Click the Graph option to view a performance graph. The legend under the graph shows what data each color represents. To configure graph options, refer to “Configuring the performance graph” on page 1656. • Click the Table option to view a performance table. The first column displays the time of the collection. The remaining columns display the value of each collectible at the specified time.
46 1862 Viewing PoE performance Brocade Network Advisor SAN + IP User Manual 53-1003155-01
Chapter 47 Policy Monitor In this chapter • Policy monitor overview. . . . . . . . . . . . . . . . . . . . . . . . . . . . . . . . . . . . . . . • Preconfigured configuration policy managers. . . . . . . . . . . . . . . . . . . . . • Viewing configuration policy manager status . . . . . . . . . . . . . . . . . . . . . . • Viewing existing configuration policy managers . . . . . . . . . . . . . . . . . . . • Adding a configuration policy manager . . . . . . . . . . . . . . . . . . . . . . . . . .
47 Policy monitor overview Fabric policy monitors Fabric policy monitors enable you to set the following policy monitors on SAN and Ethernet fabrics (refer to “Adding a configuration policy manager” on page 1873): • Check zoning status — This fabric policy monitor enables you to determine if zoning is enabled or disabled on the fabric. Zoning plays a key role in the management of device communication. When you enforce zoning, devices not in the same zone cannot communicate.
Policy monitor overview 47 Some devices can function as both initiator and target. If the application finds this type of device as one of the active zone members, this device port is treated as both initiator and target: - Target (storage port) — The application counts the number of initiator ports zoned to this storage port. - Initiator — The application counts this device as an initiator port for other storage ports in the same zone.
47 Policy monitor overview The resiliency and redundancy of the fabric is an important aspect of the SAN topology. To remove any single point of failure, SAN fabrics have resiliency built into the Fabric OS. For example, when a link between two switches fails, routing is recalculated and traffic is assigned to a new route. Therefore, to provide redundancy and enable resiliency, using ISLs, the best practice is to make sure that there are at least two ISLs between each switch pair.
Policy monitor overview 47 Rule Violation Fix — If the configuration policy manager report shows an “SNMP not registered as recipient” violation, the Administrator can register the Management server as an SNMP recipient through the SNMP Trap Recipients dialog box (Monitor > SNMP Setup > Product Trap Recipients). Refer to “Fault Management” on page 1907.
47 Policy monitor overview • Check for VLAN configurations match for each connection (IP only) — This switch and router configuration policy manager enables you to determine the consistency of VLAN configurations for each connection on the selected IP devices. Rule Violation Fix — If the configuration policy manager report shows a violation, configure VLANs on each device to contain the same interface membership.
Policy monitor overview 47 Make sure to configure the host port mapping. (refer to “Host port mapping overview” on page 709) - Host adapter discovery with 2.1 or later driver for host to unmanaged fabric connections (refer to “Host discovery” on page 119) Make sure there are Brocade HBAs on the host. - Fabric plus Host adapter discovery with 2.1 or earlier driver (refer to “Host discovery” on page 119) Make sure there are Brocade HBAs on the host.
47 Preconfigured configuration policy managers Rule Violation Fix — If the configuration policy manager report shows a violation, the Administrator can add redundant connections (either a host to attached fabrics or attached fabrics to a target LUN or more inter-fabric routes) to establish a complete path from host to target LUN. Management configuration policy manager The management configuration policy manager enables you to set a configuration policy manager on the Management application.
Viewing configuration policy manager status 47 • Description — Default policy to run on all IP targets • Frequency — Daily • Next Run — Next time the policy will run using the format: . For example, Fri Jun 08 08:00:00 PST 2014.
47 Viewing existing configuration policy managers Viewing existing configuration policy managers To view existing configuration policy managers, complete the following steps. 1. Select Monitor > Configuration Policy Manager (Figure 836). The Configuration Policy Manager dialog box displays. FIGURE 836 Configuration Policy Manager dialog box 2. Review the configuration policy manager details: • Name — The user-defined name of the policy. • Description — A description of the policy.
Adding a configuration policy manager 47 5. To delete the selected configuration policy manager, click Delete (refer to “Deleting a configuration policy manager” on page 1881). 6. To run the selected policy and view the report, click Run (refer to “Running a configuration policy manager” on page 1900). 7.
47 Adding a configuration policy manager • To configure the frequency, click the ellipsis button and choose one of the following options to configure the frequency at which deployment runs for the configuration policy manager: To configure deployment to run only once, refer to “Configuring a one-time configuration policy manager schedule” on page 1878. To configure hourly deployment, refer to “Configuring an hourly configuration policy manager schedule” on page 1879.
Adding a configuration policy manager 47 NOTE You can use the All Fabrics target in the Available Fabrics list for future provisioning. Select All Fabrics and click the right arrow button to apply this policy to all discovered fabrics. The selected fabrics display in the Selected Fabrics list. 7. To set configuration policy managers for switches, select the Switch/Router Checks tab (Figure 838) and complete the following steps.
47 Adding a configuration policy manager a. Select one or more of the following checks in the Available Checks list to include them in the configuration policy manager: For more information about these checks and fixes for rule violations, refer to “Switch and router configuration policy managers” on page 1865.
Adding a configuration policy manager 47 NOTE You can use the All Fabrics and All SAN Switches targets (under the Product Groups > System Product Groups node) in the Available Switches/Routers list) for future provisioning. Select All Fabrics and click the right arrow button to apply this policy to all discovered fabrics. Select All SAN Switches and click the right arrow button to apply this policy to all discovered switches. The selected switches display in the Selected Switches/Routers list. 8.
47 Configuration policy manager scheduling d. Select the hosts to which you want to apply this policy in the Available Hosts list and click the right arrow button. NOTE You can use the All Host target in the Available Hosts list for future provisioning. Select All Hosts and click the right arrow button to apply this policy to all discovered hosts. The selected hosts display in the Selected Hosts list. 9.
Configuration policy manager scheduling 47 1. Select One Time from the Frequency list. 2. Select the time of day you want deployment to run from the Time (hh:mm) lists. Where the hour value is from 1 through 12, the minute value is from 00 through 59, and the day or night value is AM or PM. 3. Click the Date list to select a date from the calendar. 4. Click OK on the Schedule Properties dialog box.
47 Editing a configuration policy manager 4. Click OK on the Schedule Properties dialog box. To finish configuring the configuration policy manager, return to step 6 of “Adding a configuration policy manager” on page 1873. Configuring a monthly configuration policy manager schedule To configure a monthly schedule, complete the following steps. 1. Select Monthly from the Frequency list. 2. Select the time of day you want deployment to run from the Time (hh:mm) lists.
Deleting a configuration policy manager 47 Deleting a configuration policy manager To delete an existing configuration policy manager, complete the following steps. 1. Select Monitor > Configuration Policy Manager. The Configuration Policy Manager dialog box displays. 2. Select the policy you want to delete in the Monitors list. 3. Click Delete. 4. Click Yes on the confirmation message. 5. Click Close on the Configuration Policy Manager dialog box.
47 Configuration rules TABLE 167 No Interface Shutdown Rule expressions (Continued) AND/OR ( Block/Condition Name AND ) Details - Description/Condition/Configuration End: Network OS Ten Gigabit Ethernet Interfaces ! Start: Network OS LAG Interfaces Processes all LAG interfaces on a Network OS device. Network OS Interface NOT shutdown Checks whether the interface is configured as shutdown. This condition should be used within an interface block. interface Port-channel .
Configuration rules 47 4. Select Add > Configuration Rule. The Add Configuration Rule dialog box displays (Figure 841). FIGURE 841 Add Configuration Rule dialog box This Add Configuration Rule dialog box contains the following fields and components: • Name — A unique name for the rule. The name cannot be over 128 characters. The only special characters allowed are an underscore (_) or space. • Description — A description for the rule. The description cannot be over 1024 ASCII characters.
47 Configuration rules The Library list contains the following details: Condition/Block — Conditions or blocks in a folder structure. For example, the predefined conditions use the following structure: Conditions/Predefined/Condition_Name. Description — Description of condition or block. This field is blank for folders. Add button — Click and select Condition or Block to add a condition or block.
Configuration rules 47 displays with an AND connector (except the first item) in the list of conditions or blocks. If you add one or more conditions to a block, each condition displays with an OR connector (except the first condition) in the block. Fields containing a green triangle ( ) in the lower right corner are editable. ( — Enter an open parenthesis to start a group (a set of conditions and blocks). You can create up to three groups. You can nest groups.
47 Configuration rules 7. Select one or more conditions and blocks in the Library list and click the right arrow button to add the conditions and blocks to the rule. The Library list contains a list of predefined and user-defined conditions or blocks. You cannot modify or delete predefined conditions or blocks. For more information, about predefined conditions and blocks, refer to “Predefined conditions” on page 1893 and “Predefined blocks” on page 1899.
Configuration rules 47 15. To remove a condition or block from a rule, select one or more conditions and blocks in the Selected Conditions/Blocks list and click the left arrow button. 16. Click OK on the Add Configuration Rule dialog box. 17. Click OK on the Add Monitor dialog box. The updated configuration policy manager displays in the Monitors table of the Configuration Policy Manager dialog box. 18. Click Close on the Configuration Policy Manager dialog box.
47 Configuration rules The Edit Monitor dialog box displays. 3. Click the Switch/Router Checks tab. 4. Select the configuration rule you want to edit in the Available Checks list and click Edit. The Edit Configuration Rule dialog box displays. 5. Change the name for the rule in the Name field. The name cannot be over 128 characters. The only special characters allowed are an underscore (_) or space. 6. Change the description for the rule in the Description field.
Configuration rules 47 Deleting a configuration rule You can only delete user-defined configuration rules. 1. From the Add Monitor or Edit Monitor dialog box, select one or more user-defined configuration rules you want to delete. 2. Click Delete. 3. Click Yes on the confirmation message. 4. Click OK on the Add Monitor or Edit Monitor dialog box. Viewing predefined configuration conditions 1. Select Monitor > Configuration Policy Manager. The Configuration Policy Manager dialog box displays. 2.
47 Configuration rules Adding a configuration condition 1. Select Monitor > Configuration Policy Manager. The Configuration Policy Manager dialog box displays. 2. Click Add. The Add Monitor dialog box displays. 3. Click the Switch/Router Checks tab. 4. Select Add > Configuration Rule. The Add Configuration Rule dialog box displays. 5. Select Add > Condition. The Add Condition dialog box displays (Figure 842). FIGURE 842 Add Condition dialog box 6. Enter a user-defined name for the rule in the Name field.
Configuration rules 47 The contents of the backup configuration file display in the CLI Configuration File text box. Select the lines you want to use in the CLI Configuration File text box and click the right arrow to move the lines to the Configuration text box. 9. Check the Use regular expressions check box to enter a regular expression in the Configuration text box. 10.
47 Configuration rules Duplicating a configuration condition Enables you to create a new condition based on a predefined or user-defined condition. 1. Select Monitor > Configuration Policy Manager. The Configuration Policy Manager dialog box displays. 2. Click Edit. The Edit Monitor dialog box displays. 3. Click the Switch/Router Checks tab. 4. Select the configuration rule you want to edit in the Available Checks list and click Edit. The Edit Configuration Rule dialog box displays. 5.
Configuration rules 47 5. Select the user-defined condition you want to edit and click Edit. The Edit Condition dialog box displays. 6. Change the user-defined name for the rule in the Name field, if necessary. The name must be unique. The name cannot be over 128 characters. The only special character allowed is an underscore (_). 7. Change the description of the rule in the Description field, if necessary. The description cannot be over 1, 024 ASCII characters. 8.
47 Configuration rules TABLE 169 Predefined conditions (Continued) Name Description Use Matches/ regular Not Matches expression Configuration Lines in exact order Network OS Interface Switchport mode check Checks whether the Network OS interface is configured to be a switchport or not. If not configured, the test will fail. No Matches switchport No Network OS Interface Access mode check Checks whether the interface is configured to be in access mode.
Configuration rules TABLE 169 47 Predefined conditions (Continued) Name Description Use Matches/ regular Not Matches expression Configuration Lines in exact order IronWare OS SSH Client Allowed check Checks to see if the SSH client is allowed or not. Yes Matches ip ssh +client.* No RFS with Configuration Auto Install Disabled Checks whether auto-installation of the configuration is disabled in a user-specified profile. This condition should be used inside the profile block.
47 Configuration rules Viewing a predefined configuration block A configuration block is a continuous group of lines within a configuration file within which conditions will be checked. The block is defined by the line that starts the block and the line that ends the block. 1. Select Monitor > Configuration Policy Manager. The Configuration Policy Manager dialog box displays. 2. Click Add. The Add Monitor dialog box displays. 3. Click the Switch/Router Checks tab. 4. Select Add > Configuration Rule.
Configuration rules 47 FIGURE 843 Add Block dialog box 6. Enter a user-defined name for the block in the Name field. The name must be unique. The name cannot be over 128 characters. The only special character allowed is an underscore (_). 7. Enter a description of the block in the Description field. The description cannot be over 1024 ASCII characters. 8. Select the Use regular expression check box to use a regular expression in the Block Start field.
47 Configuration rules The Edit Monitor dialog box displays. 3. Select the Switch/Router Checks tab. 4. Select the configuration rule you want to edit in the Available Checks list and click Edit. The Edit Configuration Rule dialog box displays. 5. Select the predefined or user-defined block you want to duplicate and click Add > Block. The Add Block dialog box displays. 6. Change the user-defined name for the rule in the Name field, if necessary. The name must be unique.
47 Configuration rules The description cannot be over 1, 024 ASCII characters. 8. To edit a configuration block, repeat step 8 through step 10 of “Adding a configuration block” on page 1896. 9. Click OK on the Edit Block dialog box. 10. Click OK on the Edit Configuration Rule dialog box. 11. Click OK on the Edit Monitor dialog box. The updated configuration policy manager displays in the Monitors table of the Configuration Policy Manager dialog box. 12.
47 Running a configuration policy manager TABLE 170 Predefined blocks (Continued) Name Description Use Block Start regular expression Block End RFS AAA Policies Processes all the AAA policies available for the RFS device. Yes aaa-policy.* ! RFS Profile Processes all the profiles available for RFS device. Yes profile.* ! Running a configuration policy manager Before you run a configuration policy manager, make sure your configuration policy managers are valid.
Viewing a configuration policy manager report 47 4. Review the report details (refer to “Viewing a configuration policy manager report” on page 1901). To export a report, refer to “Exporting a configuration policy manager report” on page 1904. To e-mail a report, refer to “Exporting IP reports to e-mail recipients” on page 2067. 5. Click the close button (X) on the Policy_Name - Configuration Policy Manager Report browser window. 6. Click Close on the Configuration Policy Manager dialog box.
47 Viewing a configuration policy manager report • Run Time — Date and time the report was triggered. • Individual_Policy_Checks — Name of the policy check and a table displaying the results of the check. The following information is included in the report data for each policy check: Management Check — Displays the status of the management check. The management check provides the following information: Name — Name of the management check. Status — Result of the check and reason for failure if known.
Viewing a configuration policy manager report Switch — Check if the product is configured to send events to this server. Switch — Check if the product is configured to send Upload Failure Data Capture information to an FTP server. Switch - Check for SSH (secure Telnet) configuration. This check provides the following additional detail for this check: Telnet Status — Whether Telnet is enabled or disabled on the product. SNMPv3 Status — Whether SNMPv3 is enabled or disabled on the product.
47 Viewing historical reports for all configuration policy managers - Condition Details — Details about the condition. Remediation — Details how to correct the failure, if the condition fails. Host Checks — Switch checks provide the following information for each selected check: Name — Product name. Status — Result of the check and reason for failure if known. Valid results include Passed, Partially Failed, Failed, Not Applicable, and Unknown.
Viewing historical reports for a configuration policy manager 47 3. Select the report you want to view and click Display. The Policy_Name - Configuration Policy Manager Report displays in a web browser. For detailed information about reports, refer to “Viewing a configuration policy manager report” on page 1901. 4. Click the close button (X) on the Policy_Name - Configuration Policy Manager Report browser window. 5. Click Close on the Report History dialog box.
47 1906 Viewing historical reports for a configuration policy manager Brocade Network Advisor SAN + IP User Manual 53-1003155-01
Chapter 48 Fault Management In this chapter • Fault management overview. . . . . . . . . . . . . . . . . . . . . . . . . . . . . . . . . . . . • Event notification. . . . . . . . . . . . . . . . . . . . . . . . . . . . . . . . . . . . . . . . . . . . • Defining filters . . . . . . . . . . . . . . . . . . . . . . . . . . . . . . . . . . . . . . . . . . . . . . . • SNMP traps . . . . . . . . . . . . . . . . . . . . . . . . . . . . . . . . . . . . . . . . . . . . . . . . • SNMP informs . . . . . . . . . . .
48 Event notification Restrictions The following items affect Fault Management operation. Supported IP address types The Management application receives traps and syslog messages for physical IP addresses only. Event Purging The default maximum number of days that historical events are stored is 365. You can select a different default (from 1 to 365 ) in the Options dialog box under Event Storage. Event Archiving The default number of days that purged events are archived is 30.
Event notification 48 2. Select the Enable E-mail Event Notification check box to enable the application to send e-mail messages in case of event notifications. 3. Enter the IP address or the name of the SMTP mail server that the server can use to send the e-mail notifications in the E-mail Server field. The Management application accepts IP addresses in IPv4 and IPv6 formats. The IPv4 format is valid when the operating system has IPv4 mode only or dual stack mode.
48 Defining filters Defining filters The Define Filter dialog box, shown in Figure 846, allows you to define event filters by product, event category, and severity. You can define event filters on SAN products, IP products, or hosts. Setting up basic event filtering To set up basic event filtering on the selected events for a user, complete the following steps. 1. Select Server > Users. The Users dialog box displays. 2. Select a user in the Users list and click Edit. The Edit User dialog box displays. 3.
Defining filters 48 • When selected (the default), all products, even newly-added products, are added to the Selected Products to be displayed list. • If the check box is cleared, only the products listed in the Selected Products to be displayed list are shown in the Master Log and all newly-added products are added to the Available Products list. You can include or exclude individual VCS cluster and the node members while defining Master Log filter. 7.
48 Defining filters FIGURE 847 Define Filter dialog box - Advanced tab 5. Select the Start Date check box to display only the events that were logged after the specified start date. The default start date and time is the current date and time. 6. To include events in the event filter, complete the following steps. a. Select the event type you want to include from the Event Category list. All event types are listed in alphabetical order. b.
SNMP traps a. 48 Select the event type you want to remove from the Event Category list. All event types are listed in alphabetical order. b. Select the event column for the event from the Event Column list. All event columns are listed in alphabetical order. c. Enter all or part of the event type value in the Value Contains field. d. Click the right arrow button to move the event type to the Additional Filters - Exclude these Events list. e.
48 SNMP traps • “Customizing a registered trap definition” on page 1925 • “Reverting the customization of a registered trap to default” on page 1926 Adding a trap recipient to one or more switches The SNMP Trap Recipients dialog box allows you to register any recipient as a trap recipient on selected products. You can register different recipients for different products. NOTE You can register and unregister other recipient servers on the Fabric OS switches on a per-switch basis.
SNMP traps 48 6. If the selected product is a SAN or Network OS device, select a severity from the Severity list. Severity levels can be one of the following: None, Critical, Error, Warning, Info, or Debug. The Severity list is disabled for IP products. None is the default. 7. Click the View Recipients button to list the recipients that correspond to a selected fabric or product from the Available list.
48 SNMP traps FIGURE 849 SNMP Trap Forwarding dialog box Adding a trap destination The Add Trap Destination dialog box allows you to configure destinations for forwarding SNMP traps. To add a trap destination, complete the following steps. 1. Select Monitor > SNMP Setup > Trap Forwarding. The SNMP Trap Forwarding dialog box, shown in Figure 849, displays. 2. Select the Enable trap forwarding check box.
SNMP traps 48 3. Click Add in the Destinations area of the SNMP Trap Forwarding dialog box. The Add Trap Destination dialog box, shown in Figure 850, displays. FIGURE 850 Add Trap Destination dialog box 4. Enter a general description of the trap destination in the Description field. 5. Enter the IP address of the trap destination in the IP Address field. This is a mandatory field. IPv4 and IPv6 addresses are accepted, but a DNS name is not accepted. 6.
48 SNMP traps 2. Click Add in the Trap Filters area of the SNMP Trap Forwarding dialog box. The Add Trap Filter dialog box, shown in Figure 851, displays. FIGURE 851 Add Trap Filter dialog box 3. Enter a unique name for the trap filter in the Filter Name field. 4. Enter a general description of the trap filter in the Description field. 5. Select the Forward Application Messages check box to forward application events. 6. Select the Forward pseudo events check box to forward pseudo events. 7.
SNMP traps 48 • Debug Traps with the selected severity and those with higher severity levels are forwarded. For example, by default, Critical severity is selected. Therefore, traps with Critical, Alert, and Emergency severity levels are forwarded. To have all traps forwarded, select Debug, the lowest severity level. 8. Select the SAN, IP, or Hosts tab. Depending on the tab selected, the products available to which you can add a trap filter display in the Available Products list. 9.
48 SNMP traps To access the Event Reception dialog box, select Monitor > SNMP > Event Reception. The Event Reception dialog box, shown in Figure 852, displays. FIGURE 852 Event Reception dialog box - Trap Credentials tab By default, the Management application receives SNMP v1 and v2c traps from IronWare OS and Network OS IP products that have any SNMP community strings.
SNMP traps TABLE 171 48 SNMP security and authentication SNMP credential type Privacy protocol Authentication Result v1 No authentication No privacy protocol Community string Uses a community string to match for authentication. v2c No authentication No privacy protocol Community string Uses a community string to match for authentication. v3 No authentication No privacy protocol User name Uses a user name to match for authentication.
48 SNMP traps 5. Select an authentication protocol from the Auth Protocol list. You can select -None-, HMAC-MD5, or HMAC_SHA. HMAC_MD5 is the default. If you select no authentication, the Management application uses the user name to match for authentication. 6. Type a password in the Auth Password field and re-type the password in the Auth Confirm Password field. 7. Select a privacy protocol from the Priv Protocol list. You can select -None-, CBC_DES, or CFB_AES_128.
SNMP traps 48 To add the MIB file that contains the trap you want to register to mibs_to_compile.txt, complete the following steps. 1. Go to \conf\mibs\ (Windows) or /conf/mibs/ (UNIX) directory and copy the MIB file into that directory. You may want to copy the MIB into a subdirectory of that directory. 2. In the \conf\mibs\ (Windows) or /conf/mibs/ (UNIX) directory, search for the mibs_to_compile.txt file. 3.
48 SNMP traps Registering traps Traps must be registered in the Event Reception dialog box to make them available. To register traps, complete the following steps. 1. Select Monitor > SNMP Setup > Event Reception. 2. Click the Trap Configuration tab. The Trap Configuration tab of the Event Reception dialog box, shown in Figure 855, displays. The Registered and Not Registered buttons at the top of the Traps tree serves as a filter for the traps.
SNMP traps 48 Trap details supply the following information: • The name of the MIB to which the trap belongs • Information about the trap • Any variable bindings (varbinds) that the trap uses. Information about the varbind, its name, OID, and type, is displayed • Recommended action specified by the user 5. Enter the following information: a. Select the severity level you want to assign to the trap from the Severity list. If you do not select a severity, it defaults to Emergency. b.
48 SNMP informs The Trap tree displays the MIBs that contain the registered traps. 3. Expand a MIB folder to display the traps that have been registered for that MIB. 4. Select a trap to display its current definition. You can change the severity, message, or alias of the trap. 5. When you have finished, click OK or Apply to accept your entries. If you modified a default trap, its status changes from Registered - Default to Registered Customized.
Syslogs 48 The products display in the SNMP Informs Capable Products list, where you can determine if the product’s status is enabled or disabled. 3. Select a product in the SNMP Informs Capable Products list and click the appropriate Action button, depending on whether you want to enable or disable SNMP informs for that product. 4. Click OK. Syslogs Use the Options dialog box to automatically register the Management application server as the syslog recipient on all managed SAN and IP products.
48 Syslogs 2. Select Add from the Action list. 3. Enter the IP address of the syslog port (the recipient server) in the Recipient IP Address field. This is a mandatory field. IPv4 addresses are accepted, but a DNS name is not accepted. 4. Enter the syslog port of the recipient in the Recipient Port field. Valid numeric values range from 1 through 65535. The default value is 514. NOTE For IronWare products, a non-default port can be registered.
Syslogs 48 FIGURE 857 Syslog Forwarding dialog box 2. Select the Enable syslog forwarding check box. 3. Click Add. The Add Syslog Destination dialog box, shown in Figure 858, displays. The Enable and Syslog Repeater check boxes are selected by default. FIGURE 858 Add Syslog Destination dialog box 4. Enter a general description of the syslog destination in the Description field. 5. Enter the IP address of the syslog destination in the IP Address field. This is a mandatory field.
48 Syslogs 6. Enter the syslog listening port of the recipient in the Port # field. This is a mandatory field. Valid numeric values range from 1 through 65535. The default is 514. 7. Select the Enable check box to enable syslog forwarding to this recipient. 8. Select the Syslog Repeater check box if you want to forward all syslogs, whether the source is managed or unmanaged. If the Syslog Repeater check box is unselected, syslogs from the managed products are sent to the server.
Syslogs 48 6. (Optional) For additional filtering, enter a text string using from 1 through 512 characters or wild card symbols in the Regular Expression field. The regular expression is used to describe a pattern in text. You can use an asterisk (*) to indicate a wildcard, as in the following examples: • *cdef: Matches a message ending with cdef • abc*: Matches a message beginning with abc • *abc*: Matches a message that contains abc 7. Select a severity level from the Severity pulldown menu.
48 Event action definitions Event action definitions To reduce the amount of events being logged in the Management application database, the Event Actions dialog box allows you to control what events the Management application monitors, on which products they are to be monitored, how often they are to be monitored, and what to do when the monitored events are generated. This information can be defined by creating an event action definition.
Event action definitions 48 4. Click Next to advance to the Events pane. Selecting an event for an event action To select an event for an event action, complete the following steps. 1. Select Monitor > Event Processing > Event Actions. The Event Actions dialog box displays. 2. Click Add to display the Identification pane of the Add Event Action dialog box. Enter a name and description for the event action and select the Enabled check box. 3. Click Next to advance to the Events pane.
48 Event action definitions - MIB Information, if you want the default SNMP name for the traps to be displayed. MIB Alias, if you want the aliases for the traps to be displayed. • Use the Trap Filter tool to limit the trap list to the trap severities you want. To use this tool, click the Filter button to display the Trap Filters dialog box. 6. After limiting the list of available traps, expand the MIB folder to which the trap you want belongs under the Available Traps list and select that trap.
Event action definitions 48 FIGURE 862 Available Varbinds and Selected Varbinds lists 3. Select the varbind you want to include in the configuration and click the right arrow button to move it to the Selected Varbinds list. If you selected more than one trap and those traps have the same varbinds, then their varbinds are listed in the Available Varbinds list. However, if the traps you selected have different varbinds, the Available Varbinds list is empty. 4.
48 Event action definitions FIGURE 863 Sources pane of the Add Event Action dialog box To configure the identity of the event action source, complete the following steps. 1. Select Monitor > Event Processing > Event Actions. The Event Actions dialog box displays. 2. Click Next to advance to the Sources pane. 3. Click the Provide the IP Address / Node WWN / Name of the source button if you want to manually enter the IP address, the world wide name (WWN), or the name of the source in the IP Address field.
Event action definitions 48 8. Click Next. The Policy pane of the Add Event Action dialog box displays. Proceed to “Configuring event action policies”. Configuring event action policies The Policy pane of the Add Event Action dialog box, shown in Figure 864, allows you to define the frequency of the event, enter a message for an event that will be displayed in the event log, and specify the event severity.
48 Event action definitions For either option, if the number of occurrences has not been met and the time duration has elapsed, the observation window is advanced to the next occurrence after the first occurrence on the current window. 3. Enter values in the If occurs __ times within __ fields and select a value from the Minutes list if you want the action to be applied only if the event occurs at a certain frequency. 4. Indicate how often the policy is to be reset.
Event action definitions 48 Editing event actions The Action Group - Actions pane of the Edit Event Action dialog box, shown in Figure 865, defines what action the Management application takes when the criteria are met. FIGURE 865 Action Group - Actions pane of the Edit Event Action dialog box To configure the policies for the event action, complete the following steps. 1.
48 Event action definitions NOTE Auto Acknowledge is enabled only when Take actions for the selected events when they occur is selected in the Policy step of the Event Actions Wizard. If you edit an Event Action that has Auto Acknowledge selected and change this option in the Policy step to Time-bound or Frequency-bound, you will be required to confirm your choice. 3. Select the Enable Troubleshooting check box to suppress events based on user-entered criteria.
Event action definitions 48 • Has Parameters - Displays Yes if the CLI configuration has parameters that require values to be entered before it can be deployed, and displays No if no parameter needs to be defined. • The Parameters list lists the parameters that need to be defined in the configuration. • The Parameter column displays the parameter and its variables in the CLI configuration. • The Source column lists the appropriate SNMP attributes for the parameters.
48 Event action definitions • None — Event Processor only reports the occurrence of the product. • Find Device — Find the product with the IP address in the attribute and deploy the payload to that product. • Find Intruder MAC — Find the product with the IP address in the attribute that matches the intruder MAC address and deploy the CLI configuration to that product. • Find Port — Find the port on a product with the IP address in the attribute and deploy the CLI configuration to that port.
Event action definitions 48 FIGURE 867 Special Events dialog box 2. Select the Acknowledged check box that corresponds to the special event you want to acknowledge. If an event is marked as acknowledged either in the Special Events dialog box or the Master Log, the event is acknowledged in both places. 3. To view all acknowledged special events, select the Show Acknowledged check box in the upper right corner of the dialog box. This check box is unselected by default.
48 Event action definitions FIGURE 868 Action Group - E-Mail Settings pane of the Add Event Action dialog box To configure the e-mail settings for the event action, complete the following steps. 1. Select the Management application user to whom the e-mail message will be sent from the Available Recipients list, and click the right arrow button to move the recipient to the Selected Recipients list. NOTE Make sure the user you select has an e-mail address defined in a user account. 2.
Event action definitions 48 The E-mail Content dialog box displays the following list of parameters selected by default: • Event Initiator - The products or devices or an application from which an e-mail message is sent. • Action Event Type - The event type (Trap, Application Event, or Pseudo Event or Custom Event) selected when configuring an event action. • • • • Triggering Event - The event description with its severity.
48 Event action definitions 6. Click Finish to save the new definition. Modifying an event action definition CAUTION Use caution when you modify an event action. Saving changes to an event action definition resets the runtime information for the events in the definition. To modify an existing event action definition, complete the following steps. 1. Select Monitor > Event Processing > Event Actions. The Event Actions dialog box displays. 2.
Event action definitions 48 FIGURE 869 Events pane of the Add Event Action dialog box 2. Click the Import Snort® Rule button. The Import Snort® Rule File dialog box displays, shown in Figure 870. FIGURE 870 Import Snort® Rule File dialog box 3. Enter the complete path of the Snort rule file located on the Syslog server. 4. Click OK to import the Snort rules. 5. While still in the Add Event Action dialog box, continue to click Next until you advance to the Action Group - Actions pane. 6.
48 Pseudo events 8. Continue to advance through the Add Event Action dialog box. The Summary pane of the Edit Event Action dialog box displays an overview of the e-mail configuration you are creating. 9. Review your entries and take one of the following actions: - Click Finish to approve the configuration. Click Previous to return to the Action Group - E-Mail Settings pane of the dialog box. Click Cancel to cancel the operation.
Pseudo events 48 2. Click Add. 3. The Identification pane of the Add Pseudo Event dialog box displays. 4. Type a unique name for the pseudo event. Duplicate names are not allowed. 5. Select the Enabled check box to enable the pseudo event or clear the check box to disable the pseudo event. 6. Click Next. The Policy pane of the Add Pseudo Event dialog box, shown in Figure 872, displays.
48 Pseudo events 2. Click the Resolve button to create a resolve policy, and then enter the duration of time the Event Processor waits before generating the pseudo event. Specify the resolve time in minutes or seconds. When a down event occurs, a resolving policy waits for a specified duration to see if the event remains in that state by checking if an up event occurs. If an up event occurs, a resolving pseudo event is generated by the Event Processor.
Pseudo events 48 FIGURE 873 Events pane of the Add Pseudo Event dialog box 3. From the Available Traps list, select the trap for the down state of a product or interface. By default, all the traps known to the Management application are grouped under the Fabric OS, Network OS, FastIron/NetIron, and Wireless root nodes and are included in the Available Traps list, which is a list of all traps that are available based on the MIB and filter criteria. 4.
48 Pseudo events 3. Click the Duplicate button. The Pseudo Events dialog box, shown in Figure 871, displays. The name of the event action is the name of the selected action with the word “copy” appended. For example, “Event1” becomes “Event1 copy”. 4. Enter a new name for the pseudo event definition. 5. Make the changes you want to make to the definition. Refer to “Creating pseudo event definitions” on page 1948 for details. 6. Click Finish to save your definition.
Pseudo events 48 1. Select Monitor > Event Processing > Pseudo Events. The Pseudo Events dialog box displays. 2. Select one or more pseudo events and click Actions. The Source pane of the Add Event Action dialog box displays. The field values of the Identification pane and the Events pane will be automatically populated based on the selected pseudo events. For more information about adding an event action, refer to “Creating an event action definition” on page 1932.
48 Pseudo events • • • • • “Creating an event action definition” on page 1932 “Creating a new event action definition by copying an existing definition” on page 1945 “Creating an event action with a pseudo event on the escalation policy” on page 1954 “Creating an event action with a pseudo event on the resolving policy” on page 1956 “Creating an event action with a pseudo event on the flapping policy” on page 1957 Creating an event action with a pseudo event on the escalation policy To create an event a
Pseudo events 48 NOTE Make sure the user you select has an e-mail address defined in a user account. 14. Add additional e-mail recipient addresses in the Other Recipients field. Separate multiple e-mail addresses with a semicolon. 15. If you want the e-mail message for the alert to display a description on the subject line, enter the text in the Subject Line field. 16. If you want a prologue to be inserted at the beginning of the e-mail message, enter up to 255 characters in the Body Prologue field.
48 Pseudo events 7. Select a critical event, such as LinkDown, and click the right arrow button to move it to the Selected Down Trap list. 8. Select a remediation event, such as LinkUp, and click the right arrow button to move it to the Selected Up Trap list. 9. Click Finish to complete the pseudo event configuration. Now, you must create a new event action definition using the Add Event Actions dialog box.
Pseudo events 48 For more information about adding an event action, refer to “Event action definitions” on page 1932. Adding a pseudo event on the flapping policy The flapping policy checks to see if the event consistently transitions between two opposite states during a specified length of time. If it does, then the specified action in the definition is performed.
48 Pseudo events 4. Click Next to display the Events pane. By default, the Events pane of the Add Event Action dialog box displays. 5. Select the Pseudo Events event type from the Show list. The available pseudo events display. 6. Select the pseudo event you created and click Next. The Sources pane of the Add Event Action dialog box displays. 7. Select the source that you will use to monitor this event from the Selected Sources list. 8.
Event custom reports - Find Intruder MAC: Find the product with the IP address in the attribute that matches the intruder MAC address and deploy the CLI configuration to that product. - None: The Event Processor only reports occurrence of the products. 48 13. Select the Deploy Product Configuration check box if you want to deploy a payload to the products if the policy criteria have been met. 14.
48 Event custom reports • The Report Definitions tab lists all the previously created report definition objects. This tab enables you to add a new definition or modify, delete, or duplicate existing report definitions. • The Schedules tab lists all the previously created schedules on the report definition. This tab enables you to add a new schedule or modify, delete, or duplicate existing schedules. Users cannot view, edit, or share a schedule that was created by another user.
Event custom reports 48 FIGURE 875 Add/Edit Report Definition dialog box - Result Settings tab NOTE The Available Column list lists the attributes you can include in the report. Each attribute represents a column on the report. 5. Select the attribute you want, then click the right arrow to move your selection to the Selected Columns list. To remove an attribute from the Selected Columns list, select the attribute that you want to remove, then click the left arrow button.
48 Event custom reports Defining the report identity The Identification tab in the Event Custom Reports dialog box allows you to enter the identity information of the report information. To define the report identity, complete the following steps. 1. Select Reports > Event Custom Reports. The Event Custom Reports dialog box displays. 2. Click the Add button. 3. The Add/Edit Report Definition dialog box - Product tab displays. 4. Click the Identification tab.
Event custom reports 48 If you select this button, no Management application users will see this definition on the Report Definitions tab of the Event Custom Reports dialog box when they log in. 8. Click the Share this definition (Read only) button if you want other Management application users to have Read Only permission for this definition. If you selected the Share this definition (Read only) button, a list of Management application roles appears in the Available Roles list. 9.
48 Event custom reports FIGURE 877 Add/Edit Report Definition dialog box - Product tab 4. Click the Filter tab. The Add/Edit Report Definition dialog box - Filter tab, shown in Figure 878, displays.
Event custom reports 48 5. To limit the search results to traps, syslog, and pseudo event messages with a specific text string, enter the text string in the Description field. You can use an asterisk (*) to indicate a wildcard, as in the following examples: • *cdef: Matches a message ending with cdef • abc*: Matches a message beginning with abc • *abc*: Matches a message that contains abc For example, if you want to find the events that have the text “Auth” in the message, enter “*Auth*”.
48 Event custom reports 3. Click the Time Settings tab. The Add/Edit Report Definition dialog box - Time Settings tab, shown in Figure 879, displays. FIGURE 879 Add/Edit Report Definition dialog box - Time Settings tab 4. Choose between relative time (the default) and absolute time. • Click Relative Time if you want to filter traffic based on when the report is generated, and then select a relative time from the Range list. Relative time is calculated based on the date and time the report is generated.
Event custom reports 48 Creating a new report definition by copying an existing definition The simplest way to create a new report definition is by copying an existing definition. To create a new report definition is by copying an existing definition, complete the following steps. 1. Select the definition you want to copy from the Report Definitions tab of the Event Custom Reports dialog box. 2. Click Duplicate.
48 Event custom report schedules Deleting a report definition You can delete a report definition, but only if it belongs to you. To delete a report definition, complete the following steps. 1. To access the dialog box, select Reports > Event Custom Reports. The Event Custom Reports dialog box displays. 2. Click the Report Definitions tab of the Event Custom Reports dialog box and select the definition you want to delete. 3. Click the Delete button.
Event custom report schedules • • • • 48 Duplicate — Creates a copy of the selected report schedule. Delete — Deletes the selected schedule from the Schedules list. Enable — Enables the selected schedule. Disable — Disables the selected schedule.
48 Event custom report schedules 7. Select one of the following periods from the Frequency list: • One Time • Hourly — If you selected Hourly as the schedule type, Minutes past the hour appears. Select the minutes after the hour when the report will be generated. • Daily — If you selected Daily as the schedule type, Time (hh:mm) appears. • Weekly — If you selected Weekly as the schedule type, Day of the week appears. Select the day of the week when the report will be generated.
Event logs 48 Event logs You can view all events that take place through the Master Log at the bottom of the main window. You can also view a specific log by selecting an option from the Logs submenu of the Monitor menu. The logs are described in the following list: • Audit Log — Displays all Application Events raised by the application modules and all Audit Syslog messages from the switches and Brocade HBAs.
48 Event logs • To select non-contiguous rows, select the first row you want to copy, press CTRL, and click the additional row or rows you want to copy. 3. Right-click one of the selected rows and select Copy Rows. 4. Open the application to which you want to paste the data. 5. Click where you want to paste the data. 6. Press CTRL+V (or select Edit > Paste from the other application). All data and column headings are pasted. 7. Click Close to close the dialog box.
Event logs 48 E-mailing all event details from the Master Log NOTE You must configure e-mail notification before you can e-mail event details from the Master Log. To configure e-mail notification, refer to “Configuring e-mail notification” on page 1908. To e-mail all event details from the Master Log, complete the following steps. 1. Right-click an entry in the Master Log. 2. Select E-mail > All. The E-mail dialog box displays. 3.
48 Event logs TABLE 172 Event Properties Event Field Description Probable Cause The most likely reason the event occurred. Description A description of the event. Count Number of times this event occurred on the host. Origin The event’s origin, for example, SNMP trap. Message ID The message associated with the event. Port Name The port name associated with the event. First Event Server Time The time the event occurred. Fabric Name The VCS fabric name.
Event logs 48 Finding the device associated with an event You can locate a device on which an event was triggered by right-clicking the event and selecting Locate. The device displays highlighted in the Product List and Topology Map. NOTE Locate does not locate devices in automatically collapsed fabrics. You must expand the fabric (right-click and select Expand) and repeat the locate command. Copying part of the Master Log You can copy data from logs to other applications.
48 Event logs To export the Master Log, complete the following steps. 1. Right-click an entry in the Master Log. 2. Select Table > Export Table. The Save table to a tab delimited file dialog box displays. 3. Browse to the location where you want to export the data. 4. Enter a name for the file in the File Name field. 5. Click Save. All data and column headings are exported to the text file. 6. Click Close to close the dialog box.
Event logs 48 The Define Filters dialog box displays. FIGURE 883 Define Filter dialog box - Basic tab, IP tab selected 3. Use the following to include or exclude products. • To include an event type in the filter, select the event from the Available Products list and click the right arrow. • To exclude an event type from the filter, select the event from the Selected Products to be displayed list and click the left arrow. • To include all products, select the Allow All Products check box. 4.
48 Event logs • Debug • Unknown Clear the severity level check boxes to turn off the filter for the selected events. 6. (Optional) To filter events based on a string (such as telnet or login) that appears in the event description, select the Events Description check box and enter the string that the filter is to use in the associated text box. 7. Enter a name for the filter in the Name field. The Filter name length is limited to 128 alphanumeric characters.
Event logs 48 Notes on filters • Changing the filter in one client session does not alter the filter selection on other clients. However, if the currently selected filter is updated, once the filter is saved, the Master Log is reloaded to reflect the changes to that filter. This affects all your client sessions. • If the currently selected filter is deleted, the Master Log is reloaded, and changes the selected filter to none for all your client sessions.
48 1980 Event logs Brocade Network Advisor SAN + IP User Manual 53-1003155-01
Chapter Packet Capture (Pcap) 49 In this chapter • Configuring packet captures. . . . . . . . . . . . . . . . . . . . . . . . . . . . . . . . . . . 1981 Configuring packet captures Organizations can configure switches as sensors to capture packets through the embedded sFlow capability and send them back to the Management application, which acts as an sFlow collector. The Management application then converts the sFlow data to Pcap format, which is understood by a variety of open source products.
49 Configuring packet captures For example, if SNORT is installed under the C:\\SNORT\ directory, enter the following commands to launch SNORT: C:\\SNORT\bin\SNORT.exe -c C:\\SNORT\etc\SNORT.conf -Xeds -K none 6. Specify the working directory for the PCAP-aware tool in the Working Directory text box. If this field is blank, the default directory is set to the Install_Home\bin directory. 7. Type the name of the PCAP-aware tool in the Name text box.
Chapter 50 Monitoring and Alerting Policy Suite In this chapter • Monitoring and Alerting Policy Suite overview. . . . . . . . . . . . . . . . . . . . . • MAPS interoperability with other features . . . . . . . . . . . . . . . . . . . . . . . . • MAPS category, object, and measure hierarchy . . . . . . . . . . . . . . . . . . . • MAPS monitoring categories. . . . . . . . . . . . . . . . . . . . . . . . . . . . . . . . . . . • MAPS policies . . . . . . . . . . . . . . . . . . . . . . . . . . . . . . . . .
50 Monitoring and Alerting Policy Suite overview Supported hardware MAPS is only supported on Fabric OS devices running Fabric OS 7.2.0 or later. NOTE MAPS is not supported on DCB devices. MAPS license requirements MAPS is supported on all versions of the Management application with SAN management. MAPS is supported on Fabric OS devices running 7.1 or earlier with the Fabric Watch and Performance Monitor license. MAPS is supported on Fabric OS devices running 7.2 or later with the Fabric Vision license.
Monitoring and Alerting Policy Suite overview 50 Enabling MAPS on a device You can enable MAPS on one or more devices at the same time. Enabling MAPS on a device converts existing Fabric Watch thresholds to MAPS policies and the active thresholds currently monitored by Fabric Watch will continue to be monitored through MAPS. 1. Select Monitor > Fabric Vision > MAPS > Enable. The Enable MAPS dialog box displays (Figure 885).
50 MAPS interoperability with other features MAPS interoperability with other features Virtual Fabrics MAPS is a logical switch-specific feature. Different logical switches can have different MAPS configurations for the needs of the specific logical switch. When you enable MAPS on the Virtual Fabric-enabled switch, MAPS is enabled, with the same active policy, on all Fabric Identifiers (FIDs). Configuration upload and download MAPS configuration is stored in separate configuration files.
MAPS interoperability with other features 50 Launch Fabric Watch — A “None of the Fabric Watch specific operations can be performed on this switch because the MAPS (Monitoring and Alerting Policy Suite) are enabled.” error message displays. • Replicate Fabric Watch configuration — If you select a Fabric Watch configuration to replicate, the Management application filters the MAPs-enabled switches from Source Configuration and Destination Switches steps of the replicate configuration wizard.
50 MAPS interoperability with other features TABLE 173 Fabric Watch supported RAS event IDs Category Measure Unit label RAS event ID Port Health CRC — CRC errors Count 1182 ITW — Invalid transmit words Count 1178 LOSS_SYNC — Loss of synchronization Count 1166 LF — Link failure Count 1162 LOSS_SIGNAL — Signal loss Count 1170 PE — Protocol errors Count 1174 LR — Link reset Count 1198 C3TXTO — Class 3 timeout Count 1202 STATE_CHG — State changes Count 1194 CURRENT — SFP tran
50 MAPS interoperability with other features TABLE 173 Fabric Watch supported RAS event IDs (Continued) Category Measure Unit label RAS event ID Fabric State Changes DID_CHG — Domain ID change Count 1123 FLOGI — Fabric login Count 1135 FAB_CFG — Fabric reconfigurations Count 1119 EPORT_DOWN — E_Ports down Count 1115 FAB_SEG — Fabric segmentation Count 1127 ZONE_CHG — Zone changes Count 1131 L2_DEVCNT_PER — Layer 2 device count Count N/A LSAN_DEVCNT_PER — LSAN device count Coun
50 MAPS category, object, and measure hierarchy TABLE 173 Fabric Watch supported RAS event IDs (Continued) Category Measure Unit label RAS event ID Switch Resources TEMP — Temperature sensor N/A 1002 1003 1004 FLASH_USAGE — Flash usage % 1402 CPU — CPU usage % 1404 MEMORY_USAGE — Memory usage % 1404 1406 ETH_MGMT_PORT_STATE — Ethernet management port state % N/A CIR_STATE — FCIP circuit state changes N/A 3020 CIR_UTIL — FCIP circuit utilization % 3012 CIR_PKTLOSS — FCIP packet
MAPS category, object, and measure hierarchy TABLE 174 50 MAPS structural elements Element Description Action What MAPS is to do if a condition defined in a rule evaluates to true. For more information, refer to “MAPS actions” on page 2004. Category A grouping of similar elements that can be monitored (for example, “Security Violations”). For more information, refer to “MAPS monitoring categories” on page 1993.
50 MAPS category, object, and measure hierarchy TABLE 175 Monitors and actions by category (Continued) Category Objects Measures Possible actions Switch Policy Status Chassis • • • • • • • • • • • • • • • • • • • • • • • • • • • • • • • • • • • • • • • BAD_PWR — Absent or faulty power supply BAD_TEMP — Temperature sensors outside range BAD_FAN — Absent or faulty fans FLASH_USAGE2 — Flash usage WWN_DOWN — WWN faulty or down DOWN_Core — Core blade monitoring FAULTY_BLADE — Faulty blades HA_SYNC — H
MAPS monitoring categories TABLE 175 50 Monitors and actions by category (Continued) Category Objects Measures Possible actions FCIP Circuit CIR_STATE — FCIP circuit state changes CIR_UTIL — FCIP circuit utilization CIR_PKTLOSS — FCIP packet loss PKTLOSS — FCIP tunnel packet loss3 RTT — Round-trip time of the circuit Jitter — The variance in round-trip time of the circuit TUNNEL_UTIL — Tunnel utilization TUNNEL_STATE — FCIP tunnel status • • • • RAS Log Event Fence (CIR_STATE) SNMP Trap E-mail
50 MAPS monitoring categories TABLE 176 Port measures Measure Description Cyclic redundancy check (CRC) The number of times an invalid cyclic redundancy check error occurs on a port or a frame that computes to an invalid CRC. Invalid CRCs can represent noise on the network. Such frames are recoverable by retransmission. Invalid CRCs can indicate a potential hardware problem. Invalid transmission words (ITW) The number of times an invalid transmission word error occurs on a port.
MAPS monitoring categories 50 Switch Status monitoring category The Switch Status category enables you to monitor the health of the switch by defining the number of types of errors that transitions the overall switch state into a state that is not healthy. For example, you can specify a switch policy so that if a switch has two port failures, it is considered to be in a marginal state; if it has four failures, it is in a down state.
50 MAPS monitoring categories TABLE 177 Switch status measures Measure Description Missing SFPs1 (MISSING_SFP) Ports that are missing SFP transceiver. Error 1. Ports1 (ERR_PORTS) Ports with errors. Marginal ports, faulty ports, error ports, and missing SFP transceivers are calculated as a percentage of the physical ports (excluding FCoE and VE_Ports).
MAPS monitoring categories TABLE 178 50 Fabric measures (Continued) Measure Description L2_DEVCNT_PER Tracks the number of device connections in Layer 2 fabrics. The maximum supported limits in Layer 2 fabrics are the following: • 4096 for all platforms supported by Fabric OS v7.0.
50 MAPS monitoring categories TABLE 179 FRU measures Measure Description SFPs (SFP_STATE) State of the SFP has changed. WWN State of a world wide name (WWN) card has changed. Security monitoring category The Security category monitors different security violations on the switch and takes action based on the configured thresholds and their actions. Table 180 lists measures in the Security category and describes what each measure indicates.
MAPS monitoring categories TABLE 181 50 Resource measures Measure Description Temperature (TEMP) Refers to the ambient temperature inside the switch, in degrees Celsius. Temperature sensors monitor the switch in case the temperature rises to levels at which damage to the switch might occur. Flash (FLASH_USAGE) Monitors the compact flash space available by calculating the percentage of flash space consumed and comparing it with the configured high threshold value.
50 MAPS monitoring categories TABLE 183 Traffic measures Measure Description Receive bandwidth usage percentage (RX) The percentage of received word frames that exceeds the configured thresholds. Transmit bandwidth usage percentage (TX) The percentage of transmitted word frames that exceeds the configured thresholds. Trunk utilization (UTIL) The percentage of utilization for the trunk at the time of the last poll.
MAPS policies 50 MAPS policies A MAPS policy is a set of rules that define thresholds for measures and action to take when a threshold is triggered. When you enable a policy, all of the rules in the policy are in effect. A device can have multiple policies. For example, you can have a policy for everyday use and you can have another policy for when you are running backups or performing switch maintenance. However, only one policy can be active at a time.
50 MAPS policies Fabric Watch legacy policies You cannot return Fabric Watch once you activate MAPS (or migrate to MAPS). When you migrate from Fabric Watch to MAPS, three policies are automatically created: • fw_custom_policy Contains all of the monitoring rules based on the custom thresholds configured in Fabric Watch, even if the rules have the same parameters as the default rules. • fw_default_policy Contains all of the monitoring rules based on the default thresholds configured in Fabric Watch.
MAPS rules 50 MAPS rules A rule associates a condition with actions that need to be triggered when the specified condition is evaluated to be true. Each rule specifies the following items: • A group of objects to be evaluated. Refer to “MAPS groups” on page 2021 for additional information. • The measure to be monitored. Refer to “MAPS monitoring categories” on page 1993 for additional information. • The condition. Each rule specifies a single condition. A condition includes a time base and a threshold.
50 MAPS actions MAPS actions MAPS provides actions (event notifications) in several different formats to ensure that event details are accessible from all platforms and operating systems. In response to an event, MAPS can record event data as any (or all) of the following alarm options. To enable MAPS actions, refer to “Enabling or disabling policy actions for all policies” on page 2006.
MAPS actions 50 E-mail An e-mail alert sends information about a switch event to a specified e-mail address. An e-mail alert can send information about any error from any element, area, and class (only one e-mail recipient can be configured per class). The e-mail alert specifies the threshold and describes the event, much like an error message. To configure multiple e-mail recipients, refer to “Configuring e-mail notification” on page 2007.
50 MAPS actions TABLE 185 Required MIB support for Fabric OS devices MIB name Required MIB object Data collected Brocade MAPS MIB mapsTrapAM mapsConfigRuleName mapsConfigObjectGroupType mapsConfigObjectKeyType mapsConfigObjectKeyValue mapsConfigNumOfMS mapsConfigMsList mapsConfigSeverityLevel Enabling or disabling policy actions for all policies You can define what actions are allowable on the device, regardless of the actions specified in the individual rules in a policy.
MAPS actions 50 4. Click OK on the MAPS Policy Actions dialog box. 5. Click Close on the MAPS Configuration dialog box. Configuring e-mail notification In environments where it is critical that you are notified about errors quickly, you can use e-mail notifications. With e-mail notifications, you can be notified of serious errors by e-mail, text message, or pager, so you can react quickly. 1. Right-click a device in the Product List or Connectivity Map and select Fabric Vision > MAPS > Configure.
50 MAPS actions Viewing MAPS policy data You can view the MAPS-capable devices and the associated MAPS policies and actions. 1. Right-click a device in the Product List or Connectivity Map and select Fabric Vision > MAPS > Configure. The MAPS Configuration dialog box displays (Figure 886). Sort the contents by clicking the column header. Click the same column header again to reverse the sort order. FIGURE 886 MAPS Configuration dialog box 2.
MAPS actions 50 NOTE The active policy indicates an active status icon in the Policies column of the Switch row and Active Policy row. - RAS Log Event — If check mark displays, logs a RAS event when triggered. - Port Decommission — If check mark displays, decommissions the port , when triggered. - Switch Status Marginal. — If check mark displays, sets the switch status to marginal when triggered. - Switch Status Critical — If check mark displays, sets the switch status to critical when triggered.
50 MAPS actions • Distribute button — Select a policy and click to replicate the policy to all devices in a fabric or SAN. For more information, refer to “Replicating a policy to other devices” on page 2016. • Manage button in the Groups area — Select the fabric or switch for which you want to edit groups and click to open the Manage Groups - MAPS dialog box. For more information, refer to “Editing multiple groups” on page 2029. • Compare button — Click to compare two policies across the fabric.
MAPS actions 50 For a complete list of categories and the associated measures and actions, refer to “MAPS categories, measures, and actions” on page 1991. Options include: • Port tab — Rules defined on this tab measure thresholds on ports or SFPs to determine if an out of range violation is sent for the port. • Switch Status tab — Rules defined on this tab measure thresholds at the switch or chassis level to determine the switch operational status.
50 MAPS actions The rule name can be up to 40 characters and can only contain of alphanumeric and underscore characters. 6. Select a measure from the Measure list. Available measures depend on the selected category. For a complete list of categories and the associated measures and actions, refer to “MAPS categories, measures, and actions” on page 1991. 7. Select a logical operator from the Threshold list.
MAPS actions 50 Editing a MAPS policy 1. Right-click a device in the Product List or Connectivity Map and select Fabric Vision > MAPS > Configure. The MAPS Configuration dialog box displays. 2. Select any non-default policy in the list and select Edit. You can also select the switch in the list and select Edit to edit the active policy. When you edit the active policy on the switch, updated rules activate on the switch automatically. NOTE You cannot edit a default policy.
50 MAPS actions Importing Flow definitions You can import a flow definition into MAPS for threshold monitoring. 1. Right-click a device in the Product List or Connectivity Map and select Fabric Vision > MAPS > Configure. The MAPS Configuration dialog box displays. 2. Select a policy in the list and click Add. The Add Policy dialog box displays. 3. Click the Traffic / Flows tab. 4. Click Import. The Import Flow Definitions dialog box displays.
MAPS actions • • • • • • • • • • • 50 LUN — The LUN values defined in the flow. Bi-direction — Whether or not the flow is bi-directional. Zone Check — The zone checks defined in the flow Flow Definition Persistence — Whether or not to persist flow definition over device reboot. Data Type — The data type defined for the flow. Routing Control — The routing control defined in the flow. QOS — The Quality of Service (QOS) defined for the flow. Offset — The offset value defined in the flow.
50 MAPS actions Only one policy can be active on a switch at a time. You can activate policies for multiple switches at once by selecting the policy you want to activate for each switch and clicking Activate. When you edit the active policy on the switch, updated rules activate on the switch automatically. NOTE The active policy indicates an active status icon in the Policies column of the Switch row and Active Policy row. 3. Click Close on the MAPS Configuration dialog box.
MAPS actions 50 NOTE If the fabric contains a switch running an earlier version of Fabric OS, the rules supporting the earlier version are discarded. NOTE A warning message is displayed if you try to replicate a policy name that already exists in the switch. 6. Click Close on the MAPS Configuration dialog box. Exporting a MAPS policy You can export a policy to an xml file format. 1. Right-click a device in the Product List or Connectivity Map and select Fabric Vision > MAPS > Configure.
50 MAPS actions 1. Right-click a device in the Product List or Connectivity Map and select Fabric Vision > MAPS > Configure. The MAPS Configuration dialog box displays. 2. Select the policies you want to delete in the list and select the Delete. You can delete one or more policies from the same switch or multiple switches. A confirmation message displays. 3. Click Yes on the confirmation message. 4. Click Close on the MAPS Configuration dialog box.
MAPS actions 50 For a complete list of categories and the associated measures and actions, refer to “MAPS categories, measures, and actions” on page 1991. Options include: • Port tab — Rules defined on this tab measure thresholds on ports or SFPs to determine if an out of range violation is sent for the port. • Switch Status tab — Rules defined on this tab measure thresholds at the switch or chassis level to determine the switch operational status.
50 MAPS actions 5. Click Close on the MAPS Configuration dialog box. Comparing MAPS policies You can compare any two policies across a fabric at a time. To compare MAPS policies, complete the following steps. 1. Right-click a device in the Product List or Connectivity Map and select Fabric Vision > MAPS > Configure. The MAPS Configuration dialog box displays. 2. Select two policies across the fabric that you want to compare and click Compare. The Compare dialog box displays.
MAPS groups 50 MAPS groups A MAPS group is a collection of similar objects that you can monitor as a single entity. You can create a group of objects and then use that group in rules, thus simplifying rule configuration and management. For example, you can create a group of UNIX ports, and then create specific rules for monitoring this group. Preconfigured groups MAPS provides several preconfigured groups. You cannot edit or delete a preconfigured group.
50 MAPS groups TABLE 186 2022 Pre-configured group Pre-configured group name Element type Description ALL_CIRCUITS Circuit All FCIP circuits present in the logical switch. ALL_TUNNEL_HIGH_QOS Tunnel All tunnel high QoS high monitors 50% of the available bandwidth. ALL_TUNNEL_MED_QOS Tunnel All tunnel high QoS high monitors 30% of the available bandwidth. ALL_TUNNEL_LOW_QOS Tunnel All tunnel high QoS high monitors 20% of the available bandwidth.
MAPS groups TABLE 186 50 Pre-configured group Pre-configured group name Element type Description CHASSIS Chassis Default group used to define rules on global parameters for the entire chassis; for example, CPU, Flash, and so on. ALL_FLASH Flash All monitored flash. ALL_WWN WWN All monitored WWN cards. User-defined groups NOTE You can only create user-defined custom groups for ports, SFPs, and FCIP circuits. You can create a group of ports, SFPs, or circuits to which you can assign thresholds.
50 MAPS groups FIGURE 890 Add Port Group dialog box i. Enter a unique name for the group in the Name field. The name can be up to 32 characters and can only contain alphanumeric and underscore characters. ii. Add objects to the group by selecting the object (port or circuit) in the Available Ports/Circuits list and clicking the right arrow button. The selected objects move from the Available Ports/Circuits list to the Force Include list. iii.
MAPS groups 50 FIGURE 891 Add Group dialog box i. Enter a unique name for the group in the Name field. The name can be up to 32 characters and can only contain alphanumeric and underscore characters. ii. Add objects to the group by selecting the object (port or circuit) in the Available Ports/Circuits list and clicking the right arrow button. The selected objects move from the Available Ports/Circuits list to the Selected Ports/Circuits list. iii.
50 MAPS groups 1. Right-click a device in the Product List or Connectivity Map and select Fabric Vision > MAPS > Configure. The MAPS Configuration dialog box displays. 2. Select the policy associated with the group you want to edit and click Edit. The Edit Policy dialog box displays. 3. (Port , FCIP, or FPI tab only) Select the group you want to edit in the Rules area and click Edit in the Custom Groups area. The Edit Group dialog box displays (Figure 892). FIGURE 892 Edit Group dialog box 4.
MAPS groups 50 Deleting a group NOTE You cannot delete a default group or any group that contains a rule. 1. Right-click a device in the Product List or Connectivity Map and select Fabric Vision > MAPS > Configure. The MAPS Configuration dialog box displays. 2. Select the policy associated with the group you want to delete and click Edit. The Edit Policy dialog box displays. 3. Select the Port or FCIP tab (depending on the type of group you want to delete). 4.
50 MAPS groups b. The Fabric/Device _Name - Manage MAPS Groups dialog box displays (Figure 894) with a list of all configured Port groups on the selected fabric or device in the Groups area. FIGURE 894 Fabric/Device_Name - Manage MAPS Groups dialog box 3. Review the group details: Sort the contents by clicking the column header (Name or Type). Click the same column header again to reverse the sort order. • Groups list — List of groups available on the selected fabric or device.
MAPS groups 50 4. Click OK on the Fabric/Device _Name - Manage MAPS Groups dialog box. 5. Click Close on the MAPS Configuration dialog box. Creating multiple groups You can create groups that are in the same fabric or device. 1. Right-click a device in the Product List or Connectivity Map and select Fabric Vision > MAPS > Configure. The MAPS Configuration dialog box displays. 2. Select a fabric or device in the SAN/Fabric/Switch list and click Manage.
50 MAPS groups 4. Add objects to the group by selecting the object (port, SFP, or circuit) in the Available Ports/Circuits list and clicking the right arrow button. The selected objects move from the Available Ports/Circuits list to the Selected Ports/Circuits list. 5. Remove objects from the group by selecting the object (port, SFP, or circuit) in the Selected Ports/Circuits list and clicking the left arrow button.
MAPS violations 50 MAPS violations MAPS violation data is stored in the database for 30 days. The system purges old data (over 30 days) every night at 12:00 AM. The system also purges violations from deleted or unmonitored devices. Viewing MAPS violations 1. Right-click a device in the Product List or Connectivity Map and select Fabric Vision > MAPS > Violations. The Violations dialog box displays (Figure 895). FIGURE 895 Violations dialog box 2.
50 MAPS violations 3. Review the detailed data. You can sort the contents by clicking the column header. Click the same column header again to reverse the sort order. • Time (MAPS and Fabric Watch support) — The time on the server when the violation was reported. • Fabric Name (MAPS and Fabric Watch support) — The Fabric name to which the object belongs. • Product (MAPS and Fabric Watch support) — The device name.
MAPS events 50 MAPS events Once you configure MAPS rule violations to trigger RASLOG messages, the Management application starts receiving SNMP traps for the MAPS rule violations. The Management application processes the RASLOG messages by an event processor and displays them in the Master Log and the historical graphs and monitors the same as any other events.
50 MAPS events • 1 Day — Displays data for the previous day beginning when the Violations dialog box is displayed. • 3 Days — Displays data for the previous 3 days beginning when the Violations dialog box is displayed. • 1 Week — Displays data for the previous week beginning when the Violations dialog box is displayed. • 1 Month — Displays data for the previous month beginning when the Violations dialog box is displayed. 3. Select one or more rows in the Violations dialog box and click Events.
MAPS events 50 4. Review the detailed data. The MAPS Violation Master Log Events dialog box contains the same fields as the Master Log; however, the MAPS violations only displays content in the MAPS related fields. You can sort the contents by clicking the column header. Click the same column header again to reverse the sort order. Event field Description Severity The MAPS event severity is Warning. Acknowledged N/A Last Event Server Time The time range selected in the MAPS Violations dialog box.
50 MAPS integration with other features MAPS integration with other features Dashboard MAPS widgets The MAPS widgets display on the main Dashboard tab (refer to “Monitoring and Alerting Policy Suite/Fabric Watch widgets” on page 397). The Management application provides the following preconfigured MAPS widgets: • Out of Range Violations widget — Table view of all out of range threshold violations reported in your SAN (refer to “Out of Range Violations widget” on page 398).
Chapter Technical Support 51 In this chapter • Server and client support save. . . . . . . . . . . . . . . . . . . . . . . . . . . . . . . . . 2037 • Device technical support . . . . . . . . . . . . . . . . . . . . . . . . . . . . . . . . . . . . . . 2041 • Upload failure data capture . . . . . . . . . . . . . . . . . . . . . . . . . . . . . . . . . . . 2051 Server and client support save You can use Technical Support to collect SupportSave data for the Management server and clients.
51 Server and client support save 4. Select the Include Database check box to include the database in the support save and choose one of the following options. • Select the Partial (Excludes historical performance data and events) option to exclude historical performance data and events from the database capture. • Select the Full option to capture the entire database. Clear the Include Database check box to exclude the database in the support save. 5.
Server and client support save 51 4. Enter a file name for the server support save file in the File Name field. The default file name is DCM-SS-Time_Stamp. 5. Select the Include Database check box to include the database in the support save and choose one of the following options. • Select the Partial (Excludes historical performance data and events) option to exclude historical performance data and events from the database capture. • Select the Full option to capture the entire database.
51 Server and client support save Client support save using a command line interface Use the following procedures to capture client support save files through the command line interface (CLI). Capturing client support save using the CLI (Windows) To capture client support save files through the CLI, complete the following steps. 1. Go to the following location: • (Local client) User_Home/Management_Application_Name/localhost • (Remote client) User_Home/Management_Application_Name/Server IP 2.
Device technical support 51 Device technical support You can use Technical Support to collect SupportSave data (such as RASLOG, TRACE, and so on) and switch events from Fabric OS, IronWare, and Network OS devices. To gather technical support information for the Management application server, refer to “Capturing technical support information” on page 613. Scheduling technical support information collection You can capture technical support and event information for up to 50 devices.
51 Device technical support FIGURE 897 Technical SupportSave dialog box, Schedule tab 3. Select the Enable scheduled Technical Support Data check box. 4. Select how often you want the scheduled collection to occur from the Frequency list. 5. Select the start date for the scheduled collection from the Start Date list. This list is only available when you select Weekly or Monthly from the Frequency list. 6. Select the time you want the scheduled collection to begin from the Start Time Hour and Minute lists.
Device technical support 51 • • • • • Location — The customer site location. a. Right-click in the Available SAN Products table and select Expand All. b. Select the switches you want to collect data for in the Available SAN Products table and click the right arrow to move them to the Selected Products and Hosts table. Contact — The primary contact at the customer site. Description — A description of the customer site. State — The switch state, for example, online or offline.
51 Device technical support Technical SupportSave uses the following naming convention for the IronWare device support save files: IPProd-Device_Display_Name-IP_Address-Time_Stamp. Technical SupportSave uses the following naming convention for the Fabric OS DCB device support save files from the IP tab: IPProd-DCB-Time_Stamp. If you select more than one IronWare device for collection, the IronWare device support save files are saved as individual zip files.
Device technical support 51 Firmware Type — The type of firmware: FOS (Fabric OS), IOS (IronWare), or NOS (Network OS). Firmware version — The firmware version of the selected product or host. For VCS-enabled product’s, the firmware version of the selected node. Support Save Credentials — Whether the product or host has supportSave credentials or not.
51 Device technical support 2. Click the Generate Now tab, if necessary. FIGURE 898 Technical SupportSave dialog box, Generate Now tab 3. Click the SAN Products tab, if necessary, and complete the following steps. a. Right-click in the Available SAN Products table and select Expand All. b. Select the switches you want to collect data for in the Available SAN Products table and click the right arrow to move them to the Selected Products and Hosts table.
Device technical support 51 If you select more than one IronWare device for collection, the IronWare device support save files are saved as individual zip files. However, if you select more than one Fabric OS DCB device for collection, the DCB device support save files are bundled together in a zip file.
51 Device technical support 7. Field Description Progress The status of the supportsave. On products running Fabric OS 7.0 or later, this field shows the percentage complete and is updated every minute. For IronWare and Host products, as well as Fabric OS products running 6.4 or earlier, this field cannot display the percentatge (only displays whether it is ‘in Progress’ or’ Completed’). Status The status of the support save, for example, Ceases or Failure.
Device technical support 51 2. Review the techncial support repository details: Field/Component Description Available SupportSave and Upload Failure Data Capture Files table Select the support data file you want to view. Displays the following information: File Name — The name of the SupportSave file. Size (MB) — The name of the SupportSave file. Last Modified — The date the SupportSave file was generated.
51 Device technical support E-mailing technical support information NOTE You cannot e-mail technical support information collected from the remote client. To e-mail technical support information, complete the following steps. 1. Select Monitor > Technical Support > View Repository. The Technical Support Repository dialog box displays. 2. Select the file you want to e-mail in the table. 3. Click E-mail to e-mail the event and supportsave files (zip).
Upload failure data capture 51 6. Enter the destination directory where you want to copy the data on the external FTP server in the Destination Directory field. The destination directory should be the sub directory of the external FTP server’s root directory. For example, if you enter “repository” as the destination directory, then the support save file is copied to the “/repository” directory of the external FTP server. 7. Click OK.
51 Upload failure data capture 2. Select a one or more devices on which you want to enable automatic trace dump from the Available Switches with Upload Failure Data Capture Disabled table. The Available Switches with Upload Failure Data Capture Disabled table displays the following information: • • • • • • • • • • • • • • • • • All Levels — All discovered devices and ports as both text and icons. Name — The name of the available switch. Product Type — The type of product.
Upload failure data capture 51 Disabling upload failure data capture NOTE Upload Failure Data Capture is only supported on Fabric OS devices. 1. Select Monitor > Technical Support > Upload Failure Data Capture. The Upload Failure Data Capture dialog box displays. 2. Select one or more devices on which you want to disable automatic trace dump from the Available Switches with Upload Failure Data Capture Enabled table. 3. Click the left arrow button.
51 Upload failure data capture 4. Choose one of the following options: • Select the Use Management_Application option to use the Management application FTP server. • Select the Custom option and complete the following steps to configure a FTP server for the selected device. a. Enter the server’s IP address in the Host IP field. b. Enter a user name for the server in the User Name field. c. Enter a password for the server in the Password field. d.
Chapter 52 Reports In this chapter • Reports overview . . . . . . . . . . . . . . . . . . . . . . . . . . . . . . . . . . . . . . . . . . . . • SAN report types . . . . . . . . . . . . . . . . . . . . . . . . . . . . . . . . . . . . . . . . . . . . • Generating SAN reports . . . . . . . . . . . . . . . . . . . . . . . . . . . . . . . . . . . . . . • Viewing SAN reports . . . . . . . . . . . . . . . . . . . . . . . . . . . . . . . . . . . . . . . . . • Exporting SAN reports . . . . . . . . . . . . . . . .
52 SAN report types SAN report types Presenting and archiving data about a SAN is equally as important as gathering the data. Through the Management application, you can generate reports about the SAN. You can send the reports to network administrators, support consultants, and others interested in the SAN’s architecture, or archive the reports for future reference.
Viewing SAN reports 52 Viewing SAN reports You can view any report generated in the SAN. To view reports, complete the following steps. 1. Select Reports > View or click the View Report icon. The View Reports dialog box displays. 2. Select the report you want to view in the All Reports list. If you do not see the report you want to view, generate it first by following the instructions in “Generating SAN reports” on page 2056. You can select reports by Time, Report Type, or User. 3.
52 Viewing SAN reports Fabric Summary Report The Fabric Summary Report (Figure 911) provides a summary of the discovered fabrics as well as Switch and Access Gateway devices associated with the fabric. FIGURE 900 Fabric Summary Report Table 207 describes the fields and components of the Fabric Summary Report. TABLE 188 Fabric Summary Report fields and components Field/Component Description Server The name of the Management application server.
Viewing SAN reports TABLE 188 52 Fabric Summary Report fields and components (Continued) Field/Component Description Switch WWN The world wide name of the switch. Firmware Version The firmware version of the switch. Switch Type The type of the switch. For example, Encryption SAN switch. Serial # The serial number of the switch. Factory Serial # The factory serial number of the switch. # of Ports The number of ports on the switch. Total number of AGs The number of AGs in the fabric.
52 Viewing SAN reports TABLE 188 Fabric Summary Report fields and components (Continued) Field/Component Description Switch Name The name of the switch. Domain ID The Domain ID of the switch. Port # The port number. ISL/Trunk Whether it is an ISL or Trunk. Fabric Ports Report The Fabric Ports Report (Figure 911) provides a summary of the discovered ports including used and unused ports.
Exporting SAN reports TABLE 189 52 Fabric Ports Report fields and components (Continued) Field/Component Description Director Utilization Total Number of Ports The total number of director ports. Number of Ports connected The number of connected ports on a director. Number of Ports Free The number of free ports on a director. Number of Ports allocated The number of allocated ports on a director. Switch Utilization Total Number of Ports The total number of switch ports.
52 Printing SAN reports You can select reports by Time, Report Type, or User. 3. Select the format (PDF, HTML, or XML) you want to export to from the list to the left of the Export button. 4. Click Export. The Save dialog box displays. 5. Browse to the file location where you want to save the report and click Save. 6. Click Close to close the View Reports dialog box. 7. Click Yes on the “are you sure you want to close” message. Printing SAN reports You can print reports through a web browser. 1.
Generating SAN performance reports 52 ATTENTION Once you click Delete Report, the report is deleted without confirmation. 4. Click Close to close the View Reports dialog box. 5. Click Yes on the “are you sure you want to close” message. Generating SAN performance reports NOTE Performance reports require a SAN Trial or Licensed version. To generate a historical performance report for a device, complete the following steps. 1. Select the device for which you want to generate a performance report. 2.
52 Generating SAN zoning reports d. Select the granularity at which you want to gather performance data from the Granularity list: • • • • e. 5 minutes for last 8 days. 30 minutes granularity for last 14 days 2 hour granularity for last 30 days 1 day granularity for last 730 days. Select the measure by which you want to gather performance data from the Measures list. To select more than one measure, click the Additional Measures expand arrows and select the check box for each additional measure. f.
IP report types 52 To print the selected report, refer to “Printing SAN reports” on page 2062. To export the selected report, refer to “Exporting SAN reports” on page 2061. To delete the selected report, refer to “Deleting SAN reports” on page 2062. 4. Click Close to close the View Reports dialog box. 5. Click Yes on the “are you sure you want to close” message. For more information about zoning, refer to “Zoning” on page 1167.
52 Viewing IP reports Viewing IP reports Reports are available from the Reports menu. You must have the Reports privilege to access the reports. For more information about privileges, refer to “User Privileges” on page 2151. To view a report, complete the following steps. 1. Select Reports > Report_Name. 2. Review the IP report contents. Each report contains the following information: • The name of the report displays at the top of the report.
Exporting IP reports to e-mail recipients 52 Exporting IP reports to e-mail recipients You can e-mail a report in a CSV or HTML file format. To export reports to an e-mail recipient, you must configure e-mail event notification (refer to “Configuring e-mail notification” on page 1908). If you want to export the report to an e-mail recipient, complete the following steps. 1. Select one of the following from the E-mail list: • Select E-mail as HTML. • Select E-mail as CSV.
52 Exporting IP reports to e-mail recipients IP Wired Products report The Wired Products report displays general and detailed configuration information about wired products that are under the management server. The information on the report comes from the software image version that is in the management application for that product. To ensure that the latest configuration information is in the management application, run the discovery process or resynchronize the product.
Exporting IP reports to e-mail recipients TABLE 190 52 Wired Products report fields and components (Continued) Field/Component Admin Status Description The administrative status of the product. Possible status includes: Normal — The product is in normal operating mode. Troubleshooting — The product is in troubleshooting mode. • • Model The model of the product. Firmware The firmware level of the product. Contact The contact name for the product. Location The location of the product.
52 Exporting IP reports to e-mail recipients TABLE 191 Detailed Product Report fields and components Field/Component Description Product The IP address of the product. System Information 2070 System information includes the following: Alias Name — An optional name that is entered using the Properties dialog box. It provides an alternate name for the product if you want to override the Host Name and System Name values.
Exporting IP reports to e-mail recipients TABLE 191 52 Detailed Product Report fields and components (Continued) Modules Module information shows what modules are installed on the product. Unit/Slot Number — For products that support stacking, you can view the unit number and slot number. Slot Number — For products that do not support stacking, you can view the slot number. • Type — For wireless products, the type shows the model name of the product.
52 Exporting IP reports to e-mail recipients TABLE 191 Detailed Product Report fields and components (Continued) Cluster Peer (MCT switches only) 2072 Cluster peer information for a Multi-Chassis Trunk (MCT) switch. Information includes: Peer Product — The name and IP address of the MCT peer product. Peer IP Address — The VE interface IP address of the MCT peer. Peer RBridge ID — The RBridge ID of the MCT peer. ICL Name — The name of the ICL used to reach the MCT peer.
Exporting IP reports to e-mail recipients TABLE 191 52 Detailed Product Report fields and components (Continued) AP List Count Access Point information for wireless controllers. The table title includes the number of access points attached to the selected device. Information includes: • Product Status — Whether the AP is online (green icon), offline (red icon), or pending adoption (gray icon). • Name — The device name used to identify AP.
52 Exporting IP reports to e-mail recipients FIGURE 905 Detailed Cluster Report The Detailed Cluster Report report contains the fields and components detailed in Table 192. TABLE 192 Detailed Cluster Report fields and components Field/Component Description Cluster The name of the cluster. System Information 2074 System information includes the following: Alias Name — An optional name that is entered using the Properties dialog box.
Exporting IP reports to e-mail recipients TABLE 192 52 Detailed Cluster Report fields and components (Continued) Nodes Admin Status Modules IP Addresses Ethernet Ports Brocade Network Advisor SAN + IP User Manual 53-1003155-01 Node information includes the following: Name — The name of the node. Click the name to launch the Detailed Product Report. • IP Address — The IP address of the product. • Product Type — The type of product. • Serial Number — The serial number of the product.
52 Exporting IP reports to e-mail recipients TABLE 192 Detailed Cluster Report fields and components (Continued) FC Ports This table contains the following information for each FC interface on the product: Identifier — The port identifier. Port Name — The port name. Port WWN — The world wide name of the port. Area ID/Port Index — The area identifier and port index of the port. Type — The type of port. Port Speed (Gb/s) — The speed of the port. Trunked — Whether the port is trunked.
Exporting IP reports to e-mail recipients TABLE 193 52 AP Products report fields and components (Continued) Profile Name The AP profile name. RF Domain Name The RF domain name set for the AP. Serial Number The serial number of the AP. Firmware The firmware level of the AP. Client Count The number of wireless clients or stations connected or associated to the AP. Last Scanned The last time the APs were scanned.
52 Exporting IP reports to e-mail recipients Port VLAN report A list of port VLANs configured on IronWare or third-party products is available in the Port VLAN report. Lists of protocol VLANs are available in the port VLAN structure. For IronWare and Network OS products, these reports reflect the VLAN information available in VLAN Manager. To access the Port VLAN report, select Reports > VLANs. To display information about a VLAN, click its ID.
Exporting IP reports to e-mail recipients 52 IP Subnet List report The IP Subnet List report displays the list of IP subnets discovered on the network. To appear on this list, the subnet must contain at least one discovered product. To view the IP Subnet List report, select Reports > IP Subnet Reports. The IP Subnet List report has the parameters described in Table 197.
52 Exporting IP reports to e-mail recipients TABLE 199 IP Address report fields and components (Continued) Product The host name of the product on which the IP address is configured. Click the name of the product to launch the Detailed Product Report. VCS Name The name of the VCS fabric. Click to display the Detailed Cluster Report. Identifier The port number or slot number and port number on which the IP address is configured. Port Name The port name.
Exporting IP reports to e-mail recipients TABLE 201 52 Physical Ports - Realtime report fields and components Field/Component Description Identifier A unique identifier for each port on the device. The identifier includes the module, slot, and interface. Administrative Status The administrative status of the port. Operational Status The operational status of the port. PoE Control Displays the PoE status of the port. You can sort the report by clicking on a column header.
52 Exporting IP reports to e-mail recipients TABLE 203 Physical Media - Realtime report fields and components (Continued) Vendor The vendor of the SFP. Vendor OUI The vendor’s Organizationally Unique Identifier from a MAC address. Vendor PN The vendor’s part number. Vendor REV The vendor’s REV. Serial # The serial number of the SFP. Date Code The date code of the SFP. Media Form Factor The media form factor of the SFP. Connector The connector type.
Reports Template Manager overview 52 3. Click the link in the Deployment Time column to display the details of the deployment. The Detailed Configuration Deployment Report displays in the web browser with the following details: • • • • Configuration — Name of the deployment. Product — Product on which the deployment occurred. Status — Status of the deployment. Error — Any error messages. 4. To export a report to a file, refer to “Exporting and saving IP reports to a file” on page 2066. 5.
52 Reports Template Manager overview Accessing the Report Template Manager 1. Select Reports > Report Manager. The Report Template Manager dialog box displays (Figure 906). FIGURE 906 Report Template Manager dialog box The Report Template Manager dialog box includes the following fields and components: • Report Templates table — Lists all reports. Title — The title of the report, which must be unique. File — The file name of the report, which must be unique.
Reports Template Manager overview 52 Viewing a report 1. Select Reports > Report Manager. The Report Template Manager dialog box displays. 2. Select the report you want to run in the Report Templates table. 3. Click Run. If one or more parameters are required for the report, the Parameter dialog box displays (Figure 907). FIGURE 907 Parameter dialog box 4. Enter the parameters (such as IP address, source port name, or destination port name). NOTE The parameter fields cannot be empty.
52 Reports Template Manager overview Importing a report template You can use the BIRT report designer to create user-defined report templates that you can then import into Report Template Manager. 1. Select Reports > Report Manager. The Report Template Manager dialog box displays. 2. Click Import. The Open dialog box displays. 3. Browse to the location from which you want to import the report and click Open.
Reports Template Manager overview 52 Report content and functions Each report contains the following information: • The name of the report displayed at the top of the report. • The date and time the report was generated. • The report data, presented in a tabular format. Depending on the report type, you can perform the following functions: • Sort a table by clicking a column head. Click a column head again to reverse the sort order. • Launch a more detailed report by clicking a link within the report.
52 Reports Template Manager overview Products List report The Products List report displays general and detailed configuration information about all discovered products (Figure 908). The information on the report comes from the software image version that is in the Management application for that product. To ensure that the latest configuration information is in the Management application, run the discovery process or resynchronize the product.
Reports Template Manager overview TABLE 204 52 Products List report fields and components (Continued) Field/Component Description IP Address The IP address of the product. Product Type The type of product. Serial Number The serial number of the product. Admin Status The administrative status of the product. Possible status includes: Normal — The product is in normal operating mode. Troubleshooting — The product is in troubleshooting mode. • • Model The model of the product.
52 Reports Template Manager overview Table 205 describes the fields and components of the Detailed Product Report. TABLE 205 Detailed Product Report fields and components Field/Component Description Product The IP address of the product. System Information Admin Status Modules Ethernet Ports 2090 System information includes the following: Alias Name — An optional name that is entered using the Properties dialog box.
Reports Template Manager overview TABLE 205 52 Detailed Product Report fields and components (Continued) Physical Ports Physical port information for each port on the product. Identifier — The port identifier of the physical interfaces on the product. Port Name — The port name of the physical interfaces on the product. Type — The type of port of the physical interfaces on the product. Speed (Mbps) — The speed of the physical interfaces on the product.
52 Reports Template Manager overview Table 206 describes the fields and components of the Detailed Cluster Report. TABLE 206 Detailed Cluster Report fields and components Field/Component Description Cluster The name of the cluster. System Information Nodes Admin Status 2092 System information includes the following: Alias Name — An optional name that is entered using the Properties dialog box.
Reports Template Manager overview TABLE 206 52 Detailed Cluster Report fields and components (Continued) Modules Ethernet Ports Module information shows what modules are installed on the product. Slot Number — For products that do not support stacking, you can view the slot number. • Type — The type of module installed in the slot. • Serial Number — The serial number of the module. For wired products, the serial number cell may be blank. • Ports — The number of ports on the product.
52 Reports Template Manager overview Table 207 describes the fields and components of the Ports Tx/Rx Ratio report. TABLE 207 Ports Tx/Rx Ratio report fields and components Field/Component Description Summary table Location The location of the device. Device Name The name of the device. Click the device name link to launch the Detailed Product Report. IP Address The IP address of the device. Total Received (MB) The total data received (the sum of Rx in Rx Details table) in megabytes.
Reports Template Manager overview 52 Low Traffic Ports report The Low Traffic Ports report details the port utilization that is less than or equal to the percentage and number of days you specify (Figure 912). FIGURE 912 Low Traffic Ports report Table 208 describes the fields and components of the Low Traffic Ports report. TABLE 208 Low Traffic Ports report fields and components Field/Component Description Location The location of the device. Device Name The name of the device.
52 Host adapter reports Exporting data from the report You can export data from a report to CSV, PDF, or Word. 1. Run a report (refer to “Viewing a report” on page 2085). 2. From the report, click the Export Report icon on the Report toolbar. The Export Report dialog box displays. 3. Select an export format (PDF or Word) from the Export Format list. 4. Configure what content to export by selecting one of the following options: • Select All pages to export the entire report.
Host adapter reports 52 2. Select the report you want to generate: • Host Adapter Inventory • Host Adapter Faulty SFP 3. Select the fabrics for which you want to generate reports. 4. Click OK. The selected report displays in the View Reports dialog box. This report includes data for all Hosts discovered through Host Adapter discovery. From the IP tab, choose one of the following options: • Select Reports > Host Adapters >Inventory Report. • Select Reports > Host Adapters >Faulty SFP Report.
52 Host adapter reports TABLE 209 Adapters Inventory report fields and components (Continued) Field/Component Description OEM Info The OEM information for the adapter. Port ID The port number or PCI function index, depending on adapter type and driver version. Port Name The port name or Eth device name, depending on port type. Port HCM Name The name of the port configured in HCM. Symbolic Name The symbolic name of the port Node WWN/MAC The port’s WWN or MAC address.
Host adapter reports 52 Table 210 describes the SFP and POM fields of the Adapters Faulty SFP Report. TABLE 210 Adapters Faulty SFP report fields and components Field/Component Description SFP Supported Whether the SFP is supported or not. Connector Type The type of port connector; for example, LC. SC, or Cu (copper cable). Transceiver The type of transceiver; for example, SFP or SFP+. Media The type of media for the transceiver; for example, single mode. Speed The port speed.
52 2100 Host adapter reports Brocade Network Advisor SAN + IP User Manual 53-1003155-01
Appendix A Application menus In this appendix • Dashboard main menus . . . . . . . . . . . . . . . . . . . . . . . . . . . . . . . . . . . . . . . • SAN main menus . . . . . . . . . . . . . . . . . . . . . . . . . . . . . . . . . . . . . . . . . . . . . • IP main menus. . . . . . . . . . . . . . . . . . . . . . . . . . . . . . . . . . . . . . . . . . . . . . • SAN shortcut menus . . . . . . . . . . . . . . . . . . . . . . . . . . . . . . . . . . . . . . . . . • IP shortcut menus . . . . . . . . . . . . .
A SAN main menus Menu Command Command Options Contents — Select to open the Online Help. Find — Select to search the Online Help. License — Select to view or change your License information. About Management_Application_Name — Select to view the application information, such as the company information and release number. SAN main menus The menu bar is located at the top of the main window. The following table outlines the many functions available on each menu.
SAN main menus Menu Command A Command Options View Menu Show Main Tab — Select to choose which tab to display. Dashboard — Select to show the dashboard. SAN — Select to show the SAN tab. IP — Select to show the IP tab. Show Panels — Select to select which panels to display. All Panels — Select to show all panels. Topology Map — Select to only show the topology map. Product List — Select to only show the Product List. Master Log — Select to only show the Master Log.
A SAN main menus Menu Command Command Options Map Display — Select to customize a group's layout to make it easier to view the SAN and manage its devices. Domain ID/Port # — Select to set the display domain IDs and port numbers in decimal or hex format. Decimal — Select to display all domain IDs and port numbers in decimal format. Hex — Select to display all domain IDs in hex format. Product Label — Select to configure which product labels display.
SAN main menus Menu Command A Command Options Host Adapters — Select to discover hosts. VM Managers — Select to discover VM managers. VCEM Managers — Select to discover Virtual Connect Enterprise Managers. Host Port Mapping — (Trial and Licensed version Only) Select to manually map HBA ports to a host. Storage Port Mapping — (Trial and Licensed version Only) Select to manually map Storage Ports to a Storage Device or other Storage Ports.
A Menu SAN main menus Command Command Options Configuration File Manager— (Trial and Licensed version Only) Select to manage device configurations from the repository. Schedule Backup — (Trial and Licensed version Only) Select to schedule configuration backup. Replicate — (Trial and Licensed version Only) Select to replicate the switch Configuration or Security. Task Scheduler — Select to manage deployment. DCB — Select to manage a DCB switch, port, or link aggregation group (LAG).
SAN main menus Menu Command A Command Options Recommission — Select to recommission an individual port or all ports on a blade or switch. Routing — (Trial and Licensed version Only) Select to manage a selected router. Configuration — (Trial and Licensed version Only) Select to view the R_Ports on a router. Domain IDs — (Trial and Licensed version Only) Select to configure the router domain IDs. Security — Select to manage security.
A SAN main menus Menu Command Command Options Monitor Menu Fabric Vision — Select to configure MAPS or Flow Vision. Flow Vision — Select to define or monitor network traffic by choosing one of the following options: • Monitor — Select to monitor network traffic and provide statistics for the defined flows. • Performance Graph — Select to monitor performance through a graph, which displays transmit and receive data. The graphs show historical data. • Add — Select to define a traffic flow.
SAN main menus Menu Command A Command Options Top Talkers — (Trial and Licensed version Only) Select to monitor performance through a real-time list of top conversations for a switch or port along with related information. Real-Time Graph — Select to monitor performance through a graph, which displays transmit and receive data. The graphs show real-time data. Historical Graph — (Trial and Licensed version Only) Select to monitor performance through a graph, which displays transmit and receive data.
A Menu SAN main menus Command Command Options FICON — Select to display the FICON events related to the selected device or fabric. Product Event — Select to display errors related to SNMP traps and Client-Server communications. Product Status — Select to display operational status changes of managed products. Security — Select to display security information. Syslog — Select to display Syslog events related to the selected device or fabric.
SAN main menus Menu Command A Command Options FC — Select how to troubleshoot FC by choosing one of the following options: • FC Trace Route — Select to view the route information between two device ports. • Device Connectivity — Select to view the connectivity information for two devices. • Fabric Device Sharing. (Trial and Licensed version Only) Select to determine if the selected fabrics are configured to share devices. • Diagnostic Port Test — Select to run a diagnostic port test.
A IP main menus IP main menus The menu bar is located at the top of the main window. The following table outlines the many functions available on each menu. Menu Command Command Options Server Menu Users. Select to configure users and user groups. User Profile. Select to configure user profiles. Active Sessions. Select to display the active Management application sessions. Server Properties. Select to display the Server properties. Options. Select to configure the Management application options. Exit.
IP main menus Menu Command A Command Options Show Panels. Select to choose which panels to display. All Panels. Select to show all panels. Topology Map. Select to only show the topology map. Product List. Select to only show the Product List. Master Log. Select to only show the Master Log. Main Display. Select to choose which topology to display Network Objects. Select to display Network Objects. L2 Topology. Select to display the L2 topology map. Ethernet Fabrics.
A IP main menus Menu Command Command Options Static. Select to create a product group based on device. Dynamic. Select to create a product group based on device attributes. Add Port Group. Select to create a port management group. Edit Group. Select to edit a management group. Duplicate Group. Select to duplicate a management group. Delete Group. Select to delete a management group. Configure Menu Element Manager. Select to configure a selected device. Front Panel.
IP main menus Menu Command A Command Options Application Delivery. Select to choose an application delivery method. VIP Servers. Select to monitor and configure real and virtual servers. GSLB. Select to create global server load balancing (GSLB) policies. SSL Certificates. Select to manage SSL certificates. MPLS. Select to configure the multiprotocol label switches service (MPLS). VLL. Select to configure virtual leased line (VLL) services. VPLS. Select to configure virtual private LAN services (VPLS).
A IP main menus Menu Command Command Options Set Change Limits. Select to set zone limits for zone activation. List Zone Members. (Trial and Licensed version Only) Select to display all members in a zone. Monitor Menu Performance. Select to monitor IP devices. Historical Data Collectors. Select to monitor historical data. Real-Time Graph/Tables. Select to monitor performance through a graph or table, which displays real-time data for transmit and receive data. Historical Graph/Tables.
IP main menus Menu Command A Command Options Pseudo Events. Select to configure pseudo events. Event Actions. Select to configure events actions. Logs. Select to display logs. Audit. Select to display a history of user actions performed through the application (except login/logout). Product Event. Select to display errors related to SNMP traps and Client-Server communications. Product Status. Select to display operational status changes of managed products. Security.
A SAN shortcut menus Menu Command Command Options IP Addresses. Select to run a report on IP addresses on the network. MAC Addresses. Select to run a report of MAC addresses on the network. Product CLI. Select to run a product CLI report. Deployment. Select to run a deployment report. Host Adapters — Select to run a Host product report. Inventory Report — Select to run a Host inventory report. Faulty SFP Report — Select to run a faulty SFP report. Tools Menu Address Finder.
SAN shortcut menus A For each SAN component, you can optionally right-click the component and a shortcut menu displays. The table below details the command options available for each component.
A SAN shortcut menus Component Menu/Submenu Commands Comments Create Meta SAN View Only available for Backbone fabrics. Automatically creates a view with the selected fabric. View name is same as the current label. Map Display Port Display > Occupied Product Ports UnOccupied Product Ports Attached Ports Switch to Switch Connections Only available from Product List.
SAN shortcut menus Component Menu/Submenu Commands Comments Table > Copy 'Device_Name Group' Copy Row Copy Table Export Row Export Table Search Select All Size All Columns To Fit Expand All Collapse All Customize Only available from Product List.
A SAN shortcut menus Component Menu/Submenu Commands Comments Recommission > All Ports on the Switch All Ports on the Blade Swap Blades Virtual Fabric > Disable Logical Switches Locate Logical Switches > List_of_Logical_Switches (Fabric OS only) (Virtual Fabric-capable switches only) Zoning > Fabric Does not display when switch is in a Core Switch group, Chassis group or Isolated device group, or when it is in Access Gateway mode.
SAN shortcut menus Component A Menu/Submenu Commands Comments Setup Tools Trial and Licensed version Only Product Only enabled when the fabric is tracked, and the product is removed and joins another fabric. Other Ports > Does not display when an Access Gateway mode device is attached to multiple fabrics.
A SAN shortcut menus Component Menu/Submenu Commands Comments Virtual Fabric > Enable Disable Logical Switches Locate Chassis Only available from Product List. Events Technical Support > (Fabric OS only) Product/Host SupportSave Upload Failure Data Capture View Repository Port Display > Occupied Product Ports UnOccupied Product Ports Attached Ports Switch to Switch Connections Only available from Product List.
SAN shortcut menus Component Menu/Submenu Commands A Comments Enable / Disable > Enable Disable Persistent Enable Persistent Disable Firmware Management Swap Blades Only available from chassis.
A SAN shortcut menus Component Menu/Submenu Commands Comments Show Ports Accept Changes Show Connections Port Display > Occupied Product Ports UnOccupied Product Ports Attached Ports Switch to Switch Connections Only available from Product List. Properties Table > Copy 'Device_Name Group' Copy Row Copy Table Export Row Export Table Search Select All Size All Columns To Fit Expand All Collapse All Customize Only available from Product List.
SAN shortcut menus Component A Menu/Submenu Commands Comments Fabric > Fabric1 Fabric2 Only available for HBAs under the Host node. Origin Only available for HBAs under the Host node or devices routed in. Not available for enclosures. Destination Only available for devices routed out. Not available for enclosures. Port Display > Occupied Product Ports UnOccupied Product Ports Attached Ports Switch to Switch Connections Only available from Product List.
A SAN shortcut menus Component Menu/Submenu Commands Comments Router Phantom Domains Accept Change Trial and Licensed version Only Only available for tracked FC Fabrics. Only enabled when a plus or minus icon is present. Show Connections Displays as disabled because this component does not display in the Connectivity Map. Origin Port Display > Occupied Product Ports UnOccupied Product Ports Attached Ports Switch to Switch Connections Only available from Product List.
SAN shortcut menus Component Menu/Submenu Commands Comments Port Display > Occupied Product Ports UnOccupied Product Ports Attached Ports Switch to Switch Connections Only available from Product List. Table > Copy 'Device_Name Group' Copy Row Copy Table Export Row Export Table Search Select All Size All Columns To Fit Expand All Collapse All Customize Only available from Product List. Collapse All Only available from Product List.
A SAN shortcut menus Component Menu/Submenu Commands Comments Properties HBA Port Host Port Mapping Does not display for routed devices. Performance > Real Time Graphs Only available for occupied, managed ports. Disabled when all ports are offline. FC Security Protocol Only available for Managed JSON HBA Ports. Only available when you have the Security Privilege.
SAN shortcut menus Component Menu/Submenu Commands Comments Table > Copy 'Device_Name Group' Copy Row Copy Table Export Row Export Table Search Select All Size All Columns To Fit Expand All Collapse All Customize Only available from Product List. A Properties Giga-Bit Ethernet Port Performance > Real-Time Graph Enable / Disable > Enable Disable Persistent Enable Persistent Disable Modify Launches Element Manager.
A SAN shortcut menus Component Menu/Submenu Commands Comments Properties Trunk Port Display > Occupied Product Ports UnOccupied Product Ports Attached Ports Switch to Switch Connections Only available from Product List. Table > Copy 'Device_Name Group' Copy Row Copy Table Export Row Export Table Search Select All Size All Columns To Fit Expand All Collapse All Customize Only available from Product List.
SAN shortcut menus Component Menu/Submenu Commands Comments Table > Copy 'Device_Name Group' Copy Row Copy Table Export Row Export Table Search Select All Size All Columns To Fit Expand All Collapse All Customize Only available from Product List.
A IP shortcut menus Component Menu/Submenu Commands Comments Table > Copy 'Component' Copy Table Export Table Search Select All Size All Columns To Fit Expand All Collapse All Customize Some form of this shortcut menu is available for all tables in the Management interface. Product List IP shortcut menus You can use the Management application interface main menu to configure, monitor, and troubleshoot your IP components.
IP shortcut menus Component Menu/Submenu Commands A Comments Power Center Events Displays an Event Log for the device. CLI through Server Launches the device’s CLI Element Manager. User Defined Menu items Setup Tools Technical Support Network Objects Displays the Network Objects view with the selected device highlighted. L2 Topology Displays the L2 Topology view with the selected device highlighted.
A IP shortcut menus Component Menu/Submenu Commands Comments Firmware Management Swap Blades Only available from chassis.
IP shortcut menus Component Menu/Submenu Commands A Comments Configuration > Save Restore Configuration Repository Schedule Backup DCB FCoE Security > L2 ACL VLANs Zoning Performance > Real-Time Graph Historical Graph Fabric Watch > Configure Port Fencing Frame Monitor Performance Thresholds Technical Support > Product / Host SupportSave View Repository Events CLI through Server Setup Tools Network Objects Displays the Network Objects view with the selected device highlighted.
A IP shortcut menus Component Menu/Submenu Commands Comments Table > Copy 'Device_Name Group' Copy Row Copy Table Export Row Export Table Search Select All Size All Columns To Fit Expand All Collapse All Customize Only available from Product List. Network Objects Displays the Network Objects view with the selected device highlighted. L2 Topology Displays the L2 Topology view with the selected device highlighted.
Appendix B Call Home Event Tables In this appendix This appendix provides information about the specific events that display when using Call Home. This information is shown in the following Event Tables. • # CONSRV Events . . . . . . . . . . . . . . . . . . . . . . . . . . . . . . . . . . . . . . . . . . . • # Thermal Events. . . . . . . . . . . . . . . . . . . . . . . . . . . . . . . . . . . . . . . . . . . . . • Fabric OS Events . . . . . . . . . . . . . . . . . . . . . . . . . . . . . . . . . . . . .
B Call Home Event Tables TABLE 212 # Thermal Events Event reason code FRU code/Event type Description Severity 800 DVP/LIM/HW High temperature warning. 3 801 DVP/LIM/HW Critically hot temperature warning. 3 802 DVP/LIM/HW Port card shutdown due to thermal violations. 3 805 SWM/SBAR/HW High temperature warning. 3 806 SWM/SBAR/HW Critically hot temperature warning. 3 807 SWM/SBAR/HW SBAR module shutdown due to thermal violations. 3 810 CTP/HW High temperature warning.
B Call Home Event Tables TABLE 213 Fabric OS Events (Continued) Event reason code FRU code/Event type Description Severity 1426 FW-1426 Faulty or missing power supply. 3 1427 FW-1427 Faulty power supply. 3 1428 FW-1428 Missing power supply. 3 1429 FW-1429 Problem in power supply arrangement. 3 1430 FW-1430 Faulty temperature sensors. 3 1431 FW-1431 Faulty fans. 3 1432 FW-1432 Faulty WWN cards. 3 1433 FW-1433 Faulty CPs. 3 1434 FW-1434 Faulty blades.
B Call Home Event Tables TABLE 215 Network OS Call Home Event Event reason code FRU code/Event type Description Severity N/A Ethernet Switch is not reachable. 3 N/A SW-Missing Switch is missing from the fabric. 3 1426 FW-1426 Faulty or missing power supply. 3 1427 FW-1427 Faulty power supply. 3 1428 FW-1428 Missing power supply. 3 1430 FW-1430 Faulty temperature sensors. 3 1431 FW-1431 Faulty fans. 3 1432 FW-1432 Faulty WWN cards. 3 1433 FW-1433 Faulty CPs.
Appendix C Event Categories In this appendix This section provides information about the events that display in each of the following categories: • Link incident events . . . . . . . . . . . . . . . . . . . . . . . . . . . . . . . . . . . . . . . . . . • Product status events . . . . . . . . . . . . . . . . . . . . . . . . . . . . . . . . . . . . . . . . . • Product audit events . . . . . . . . . . . . . . . . . . . . . . . . . . . . . . . . . . . . . . . . . • Security events . . . . . . . . . . . . .
C Product audit events If the event is a RASLOG and if the RASLOG ID matches any of the RASLOGS listed below, then the event is categorized as a product status event. • • • • • • • • • • • • • • • • • • • • • FW-1424 FW-1425 FW-1426 FW-1427 FW-1428 FW-1429 FW-1430 FW-1431 FW-1432 FW-1433 FW-1434 FW-1435 FW-1436 FW-1437 FW-1438 FW-1439 FW-1440 FW-1441 FW-1442 FW-1443 FW-1444 Product audit events Events that are used to track audit information are categorized as product audit events.
Security events C Security events Security events are those that indicate authentication success or failure, a security violation, or user login and logout. Security events for FC devices For FOS switches, if the event is a RASLOG event and the RASLOG ID contains 'SEC', then the event is categorized as a security event. Security events for IP devices For IOS devices, if the event OID starts with any of the following OIDs, then the event is categorized as a security event.
C User action events • • • • • • • • • • • • • • • • • 1.3.6.1.4.1.1991.1.6.1.7.4.2.13 [localMacAddrAuthFail] 1.3.6.1.4.1.1991.1.6.1.7.4.2.14 [pppLogonFail] 1.3.6.1.4.1.1991.1.6.1.7.4.2.18 [dot1xSupplicantAuthenticated] 1.3.6.1.4.1.1991.1.7.2.2.2.9 [apAuthFailureTooMany] 1.3.6.1.4.1.1991.1.8.2.1.4.0.2 [userLoginNotification] 1.3.6.1.4.1.1991.1.8.2.1.4.0.3 [userLogOffNotification] 1.3.6.1.4.1.1991.1.8.2.1.4.0.4 [userLoginFailNotification] 1.3.6.1.4.1.1991.1.11.1.1.2.2.2.32 [mwlAuthFailure] 1.3.6.1.4.1.
Product events C Product events All other events originating from the product are categorized as product events. IP Performance monitoring events IP performance monitoring events, listed in Table 216, occur when users select the option to forward events to the vCenter during VM Manager discovery. TABLE 216 Performance monitoring IP threshold events Trap name OID Description bnaRisingThresholdCrossed 1.3.6.1.4.1.1991.1.13.2.0.
C RASLog Events TABLE 217 2148 Configuration change events (Continued) Event ID Type Description CONF-1031 LOG configDefault completed successfully. CONF-1032 LOG configRemove completed successfully. CONF-1042 LOG | AUDIT Indicates that the fabric configuration parameter value has been changed. CONF-1043 LOG | AUDIT Indicates that the fabric configuration parameter value has been changed.
RASLog Events TABLE 217 C Configuration change events (Continued) Event ID Type Description FCR-1102 LOG ICL EX_Port need to be present in base switch to make a recommended topology. FICU-1008 LOG FMS mode enabled. FICU-1012 LOG FMS mode disabled. FV-3000 AUDIT Flow definition created. FV-3001 AUDIT Flow definition deleted. FV-3002 AUDIT Flow definition activated. FV-3003 AUDIT Flow definition de-activated. FV-3004 AUDIT Flow definition modified.
C RASLog Events TABLE 217 2150 Configuration change events (Continued) Event ID Type Description PMGR-1001 LOG | AUDIT Attempt to create switch ID succeded. PMGR-1003 LOG Attempt to delete switch ID succeded. PMGR-1005 LOG Attempt to move port on slot succeded. PMGR-1007 LOG Attempt to change switch succeded. PMGR-1009 LOG Attempt to change the base switch to software succeded. PMGR-1011 LOG Attempt to move port to switch succeeded. SEC-1319 LOG FCS Policy changed.
Appendix User Privileges D In this appendix • About user privileges . . . . . . . . . . . . . . . . . . . . . . . . . . . . . . . . . . . . . . . . . . 2151 • About Roles and Access Levels . . . . . . . . . . . . . . . . . . . . . . . . . . . . . . . . . 2173 About user privileges The Management application provides the User Administrator with a high level of control over what functions individual users can see and use.
D About user privileges TABLE 218 Application privileges and behavior Privilege Description No Privilege Read-Only Read/Write Active Session Management Allows you view active client sessions and disconnect an unwanted user. Disables the Active Sessions command from the Server menu. Enables the Active Sessions command from the Server menu. Disables all commands and functions on the dialog box except the Close and Help. Enables the Active Sessions command from the Server menu.
About user privileges TABLE 218 D Application privileges and behavior (Continued) Privilege Description No Privilege Read-Only Read/Write Dashboard Management Allows you to access the Dashboard Management. • Allows you to perform the following operations on the dashboard: • Show or hide the default status and performance widgets to the dashboard. • Customize Network Scope and Time Scope. • Dashboard Playback operation. • Sharing the dashboard. • Dashboard creation and deletion.
D About user privileges TABLE 218 Application privileges and behavior (Continued) Privilege Description No Privilege Read-Only Read/Write E-mail Event Notification Setup Allows you to define the e-mail server used to send e-mail. Disables Event Notification E-mail command on the Monitor menu and the E-mail Event Notification Setup button in the Users dialog box. Disables the E-mail option in the Master Log shortcut menu.
About user privileges TABLE 218 D Application privileges and behavior (Continued) Privilege Description No Privilege Read-Only Read/Write Fault Management Allows you to control access to the SNMP Trap Registration and Forwarding dialog box, the Event Storage option of the Options dialog box, the Syslog Registration and Forwarding dialog box, as well as the Export and Clear functions in the Event Log dialog box and the Show and Hide functions in the Customize Columns dialog box.
D About user privileges TABLE 218 Application privileges and behavior (Continued) Privilege Description No Privilege Read-Only Read/Write Firmware Management Allows you to download firmware to selected switches and manage the firmware repository. Disables the Firmware Management command from the Configure menu and right-click menu. Enables the Firmware Management command from the Configure menu and right-click menu. Disables all commands and functions on the dialog box except the Close and Help.
About user privileges TABLE 218 D Application privileges and behavior (Continued) Privilege Description No Privilege Read-Only Read/Write Policy Monitor Allows you to configure policy monitors. Disables Policy Monitor command on the Monitor menu. Enables Policy Monitor command on the Monitor menu. Allows you to open the Policy Monitor dialog box; however, disables the Add, Delete, and Run buttons. No changes can be made. Enables you to use the Edit, Report, and History buttons to view content.
D About user privileges TABLE 218 Application privileges and behavior (Continued) Privilege Description No Privilege Read-Only Read/Write Security Allows you to enable and configure SANtegrity features. Disables the Security command from the Configure > Switch > Replicate menu. Disables the Security Log command on the Monitor > Logs menu. Disables the Security Misc command from the Server > Options menu. Disables the Security command from the Configure > Switch > Replicate menu.
About user privileges TABLE 218 D Application privileges and behavior (Continued) Privilege Description No Privilege Read-Only Read/Write Technical Support Data Collection Allows you to capture support data from Fabric OS switches. Disables the SupportSave, Upload Failure Data Capture, and View Repository commands from the Monitor > Technical Support menu and right-click menu. Enables the View Repository command from the Monitor > Technical Support menu and right-click menu.
D About user privileges TABLE 218 Application privileges and behavior (Continued) Privilege Description Web Services Allows you to use Web Services API. Zoning Activation (Fabric and offline zone database) Allows you to activate a zone configuration selected in the Zoning dialog box. NOTE You must also have the Zoning Offline and Zoning Online privileges to launch the Zoning dialog box.
About user privileges TABLE 218 D Application privileges and behavior (Continued) Privilege Description No Privilege Read-Only Read/Write Zoning Online Allows you to edit any of the fabric zone databases in the available fabrics within the Zoning dialog box from the client side and then save to the switch. In Zoning dialog box, the Zone DB list includes online and offline zones; however, if an online zone is selected, the contents are not loaded into the Zoning dialog box.
D About user privileges TABLE 218 Application privileges and behavior (Continued) Privilege Description No Privilege Read-Only Read/Write Zoning Offline Allows you to edit the zone database in offline mode and save the zone database to the repository or to the switch. In Zoning dialog box, the Zone DB list includes offline zones; however, if an offline zone is selected, the contents are not loaded into the Zoning dialog box.
About user privileges TABLE 218 D Application privileges and behavior (Continued) Privilege Description No Privilege Read-Only Read/Write Zoning - LSAN Allows you to edit and activate LSAN zones for the LSAN fabrics that are available within the Zoning dialog box. Prerequisite: Both the backbone fabrics as well as all directly connected edge fabrics must be added to a resource group and a user with LSAN Zoning privilege must be assigned to this specific resource group.
D About user privileges TABLE 219 IP privileges and behavior Privilege Description No Privilege Read-Only Read/Write IP - Address Finder Allows you to use Address Finder. Address Finder finds MAC addresses that are in the forwarding tables at the moment when the search is performed. Disables the Address Finder command. Enables the Address Finder command; however, disables functions on the dialog box. Enables the Address Finder command and all functions on the dialog box.
About user privileges D TABLE 219 IP privileges and behavior (Continued) Privilege Description No Privilege Read-Only Read/Write IP - Element Manager Port Config Allows you to access the device from Element Manager. For read-write access to a device Web Management Interface to manage specific ports, but not for global configuration of a device. Disables the Element Manager - Port Config command. Enables the Element Manager - Port Config command; however, disables functions on the dialog box.
D About user privileges TABLE 219 IP privileges and behavior (Continued) Privilege Description No Privilege Read-Only Read/Write IP - MPLS - VLL Allows you to manage VLL configurations. Disables the MPLS command. Enables the MPLS command; however, disables functions on the dialog box. Enables the MPLS command and all VLL functions on the dialog box. IP - MPLS - VPLS Allows you to manage VPLS configurations Disables the MPLS command.
About user privileges D TABLE 219 IP privileges and behavior (Continued) Privilege Description No Privilege Read-Only Read/Write IP - VIP-Server Mgr Leaf Node (Real Server Port View) Allows you to manage VIP Server using the Real Server Port View. When assigned to user as Read-Write privilege, only leaf node can be disabled/enable Disables the VIP Server command. Enables the VIP Server command; however, disables functions on the dialog box.
D About user privileges TABLE 220 SAN privileges and application behavior (Continued) Privilege Description No Privilege Read-Only Read/Write SAN - FCIP Management Allows you to configure FCIP tunnels and troubleshooting of IP interfaces (IP performance, IP ping and IP trace route). Disables the Configure > FCIP Tunnel and Monitor > Troubleshooting > FCIP commands. Disables the FCIP Tunnel command on the Fabric right-click menu.
About user privileges TABLE 220 D SAN privileges and application behavior (Continued) Privilege Description No Privilege Read-Only Read/Write SAN - Port Mapping - Host Allows you to identify all the HBAs that are in the same server. Disables the Host Port Mapping command from the Discover menu. Disables the Server right-click command on HBAs. Enables Host Port Mapping command from the Discover menu and right-click menu; however, disables the Create, Delete, and OK buttons.
D About user privileges TABLE 220 SAN privileges and application behavior (Continued) Privilege Description No Privilege Read-Only Read/Write SAN - SMIA Operations Allows you to access the CIMOM (Common Disables the Configure SMI Agent button from the Server Console. Disables the SMIA Configuration Tool Java web start application. Enables the Configure SMI Agent button from the Server Console. Enables the SMIA Configuration Tool Java web start application.
About user privileges TABLE 220 D SAN privileges and application behavior (Continued) Privilege Description No Privilege Read-Only Read/Write SAN - Storage Encryption Key Operation Allows you to configure storage encryption key operation, including selecting storage devices and LUNs, viewing switch, group, or engine properties, viewing storage device encryption properties, initiating manual LUN re-keying, enabling and disabling an engine, zeroizing an engine, restoring a Master Key, and all smart
D About user privileges TABLE 220 SAN privileges and application behavior (Continued) Privilege Description No Privilege Read-Only Read/Write SAN - Storage Encryption Security Allows you to configure storage encryption security, including creating a new encryption group, adding a switch to an existing group, zeroizing an encryption engine, backing up or restoring a master key, and enabling encryption functions after a power cycle. Disables all functions from the dialog box except view.
About Roles and Access Levels TABLE 220 D SAN privileges and application behavior (Continued) Privilege Description No Privilege Read-Only Read/Write SAN - View Management Allows you to create, edit, and delete views. Selecting from views should always be allowed unless restricted by the assignment of Views in the Group definition in the Users dialog box.
D About Roles and Access Levels TABLE 221 Application Features and Role Access Levels (Continued) Feature Roles with Read/Write Access E-mail Event Notification Setup SAN System Administrator, IP System Administrator, Operator Element Manager SAN System Administrator, IP System Administrator, Element Manager - Product Administration SAN System Administrator, IP System Administrator, Event Management SAN System Administrator, IP System Administrator, Network Administrator Fabric Watch SAN Syst
About Roles and Access Levels TABLE 221 Application Features and Role Access Levels (Continued) Feature Roles with Read/Write Access Roles with Read-Only Access User Management SAN System Administrator, IP System Administrator, Security Officer Operator Virtual Network Management SAN System Administrator, IP System Administrator Operator VLAN Manager SAN System Administrator, IP System Administrator Operator Web Services SAN System Administrator, IP System Administrator Operator Zoning - L
D About Roles and Access Levels TABLE 222 SAN Features and Role Access Levels (Continued) Feature Roles with Read/Write Access Roles with Read-Only Access SAN- Port Mapping - Host SAN System Administrator, Security Officer, Host Administrator Operator SAN- Port Mapping - Storage SAN System Administrator Operator SAN- Properties - Add/Delete Columns SAN System Administrator, Host Administrator Operator SAN- Routing Configuration SAN System Administrator Operator SAN- SCOM Management SAN S
About Roles and Access Levels TABLE 223 D IP Features and Role Access Levels (Continued) Feature Roles with Read/Write Access IP - Main Display - MRP IP System Administrator, Network Administrator IP - Main Display - VLAN IP System Administrator, Network Administrator IP - MPLS - LSP IP System Administrator IP - MPLS - VCID Pool IP System Administrator IP - MPLS - VLL IP System Administrator IP - MPLS - VPLS IP System Administrator IP - Power Management IP System Administrator IP - Reloa
D 2178 About Roles and Access Levels Brocade Network Advisor SAN + IP User Manual 53-1003155-01
Appendix E Device Properties In this appendix • Viewing SAN device properties . . . . . . . . . . . . . . . . . . . . . . . . . . . . . . . . . . • Viewing VC module properties . . . . . . . . . . . . . . . . . . . . . . . . . . . . . . . . . • IP device properties. . . . . . . . . . . . . . . . . . . . . . . . . . . . . . . . . . . . . . . . . . • Host properties . . . . . . . . . . . . . . . . . . . . . . . . . . . . . . . . . . . . . . . . . . . . . • Properties customization . . . . . . . . . . . . .
E Viewing SAN device properties TABLE 224 Fabric properties Field/Component Description Last Discovery The date and time of last discovery. Tracked Whether the fabric is tracked. Location The customer site location. Contact The primary contact at the customer site. Add button Click to add a user-defined property. For more information, refer to “Adding a property field” on page 2211. Edit button Click to edit a user-defined property.
Viewing SAN device properties E Viewing SAN device properties To view the properties for a device, complete the following steps. 1. Right-click any product icon and select Properties. The Properties dialog box displays, with information related to the selected device (such as switches, directors, HBAs, trunks, tunnels, and nodes). To add user-defined property labels, refer to “Adding a property field” on page 2211. Fields containing a green triangle ( ) in the lower-right corner are editable.
E Viewing SAN device properties TABLE 225 Device properties (Continued) Field/Component Description GigE Port The GigE port of the FCIP tunnel. Host Name The Host name. IKE Policy # IP Address IPSec Policy # 2182 The IKE policy number. Also includes the following information: Authentication Algorithm Encryption Algorithm Diffie-Hellman SA Life • • • • The device’s IP address. The IPSec policy number.
Viewing SAN device properties TABLE 225 E Device properties (Continued) Field/Component Description Sequence number The sequence number of the switch. Serial # The hardware serial number. Slot # The slot number of the trunk. Source IP Address The IP address of the of the FCIP tunnel source device. Speed (Gb/s) The speed of the port in gigabits per second. State The device’s state, for example, online or offline. Status The operational status. Switch Name The switch name.
E Viewing SAN device properties • Virtual FCoE Ports • Virtual Machine Ports 3. If you selected the FC Ports tab, select the port type: • FC • ICL • GigE For a description of the port properties, refer to “Port properties” on page 2189. 4. Click OK on the Properties dialog box to close the dialog box. Viewing storage properties The Storage Properties dialog box displays information related to a selected storage device. To view the properties for a storage device, complete the following steps. 1.
Viewing SAN device properties TABLE 226 E Storage Properties (Continued) Field Description Free LUNs (Count) All LUNs not assigned (masked) to any host ports (available) that currently exist on this storage device. Free LUNs (Size GB) The total amount of storage space carved into LUNs but not assigned (masked) to host ports on the storage device, in gigabytes. Free Space (Count) The number of contiguous free space instances not yet carved into LUNs (available to be carved) on the storage device.
E Viewing SAN device properties TABLE 226 Storage Properties (Continued) Field Description Type The level or type of RAID storage. Possible values are as follows: 0 — Striped disk array without fault tolerance. 1 — Mirroring and duplexing. 2 — Hamming code ECC. 3 — Parallel transfer with parity. 4 — Independent data disks with shared parity disk. 5 — Independent data disks with distributed parity blocks. 6 — Independent data disks with two independent distributed parity schemes.
Viewing SAN device properties TABLE 227 E iSCSI Properties Field Description Agent The Caffeine agent version number. Applications The applications. Assigned LUNs The number of unique LUNs (not LUN paths) masked to this host. Assigned LUNs Size (GB) The total size of the unique LUNs (not LUN paths) in gigabytes. Command Descriptor Block Count The number of command descriptor blocks on the product. Comments Comments regarding the product. Contact A contact for the product.
E Viewing SAN device properties TABLE 227 iSCSI Properties (Continued) Field Description Sessions button Select to display the Filer Sessions dialog box for the product. Statistics button Select to display the Filer iSCSI Statistics dialog box for the product. Storage Arrays The number of arrays containing LUNs masked to the server. Storage Logins The number of unique filers to which hosts on this server are logged in. Target Portals table Target portals of the product.
Viewing SAN device properties E FIGURE 913 Port Properties dialog box NOTE Depending on the port type, some of the following properties may not be available for all products. TABLE 228 Port properties Field Description Additional Port Info Additional error information relating to the selected port. Address The address of the port. Addressing Mode The addressing mode of the switch. Active FC4 Types The active FC4 types. Active Tunnels The number of active tunnels.
E Viewing SAN device properties TABLE 228 Port properties (Continued) Field Description Compression Whether compression is enabled or disabled. Connected Devices The number of connected devices. Click the icon in the right side of the field to open the Virtual FCoE Port Connected Devices dialog box. Connected Switch The name of the connected switch. Delete button Click to delete the ports. Description A description of the customer site.
Viewing SAN device properties TABLE 228 E Port properties (Continued) Field Description IP Address The device’s IP address. IPSec Policy # The IPSec policy number. Also includes the following information: Authentication Algorithm Encryption Algorithm SA Life • • • iSCSI button Click to launch the Element Manager. iSCSI Capable Whether the port is iSCSI capable or not. L2 Capable Whether the device is Layer 2 capable. L3 Capable Whether the device is Layer 3 capable.
E Viewing SAN device properties TABLE 228 2192 Port properties (Continued) Field Description Port Speed (Gb/s) The port speed, in gigabits per second. Port State The port state (online or offline). Port Status The port’s operational status (online or offline). Port Type The port type. Port WWN The port’s world wide name. Preshared key configured Whether the preshared key is configured for the FCIP tunnel. Prohibited Whether the port is prohibited.
Viewing VC module properties TABLE 228 E Port properties (Continued) Field Description Unit Type The unit type of the node. User Port # The number of the user port. Vendor The product vendor. # Virtual FCoE port count The number of virtual FCoE ports on the device. There is a one-to-one mapping of TE ports to virtual FCoE ports. Therefore, the number of virtual session ports is one for directly connected devices.
E Viewing VC module properties TABLE 229 Properties tab Field Description Serial # The hardware serial number. VC Firmware The downloaded firmware version of the VC Ethernet management module and all VC FC modules managed by the VC Domain. VC Domain Name The domain name. VC Domain Group The domain group. IO Bay Discovery Status The discovery status of the VCEM server of this module. Last Discovery The last time data collection was performed for this VC module on the VCEM server.
IP device properties E IP device properties You can view device and port properties from any view in the IP Topology. You can customize the device and fabric Properties dialog boxes to display only the data you need by creating user-defined property labels (refer to “Adding a property field” on page 2211). You can also edit property fields to change information. Fields containing a green triangle ( the lower right corner are editable.
E IP device properties TABLE 232 IP device and port properties (Continued) Field/Component 2196 Description Principal Switch The identifier of the principal switch. Config Mode The configuration mode. Device Type The type of device. Serial # The serial number of the product. Status The status for the product and the port. Admin Status The admin status of the product. Options include: Normal mode Troubleshooting mode Memo Additional information about the product.
IP device properties TABLE 232 E IP device and port properties (Continued) Field/Component Description Cluster (MCT switches only) The cluster details of the Multi-Chassis Trunk (MCT) switch. MCT cluster details include: • Cluster ID — The MCT cluster ID. • Cluster Name — The MCT cluster name. • Cluster RBridge ID — The RBridge ID of the MCT cluster. • Cluster State — Whether the MCT cluster is deployed or undeployed. • Isolation Mode — Whether isolation mode is loose or strict.
E IP device properties TABLE 232 IP device and port properties (Continued) Field/Component Port Actions list Select to enable or disable port actions. Performance list Select to launch the Performance dialog box. Identifier The identifier of the port. Name The name of the port. MAC Address The MAC address of the port. Port Status The status of the port. Port State The state of the port. Type The port type. Speed The speed of the port.
IP device properties TABLE 232 E IP device and port properties (Continued) Field/Component Description Connected switch \ Port The IP address of the switch connected to the AP. Also displays the port number if the AP is directly connected. Profile Name AP profile name. RF Domain Name The RF domain name set for the AP. Location Location set for the AP. Contact Contact set for the AP. Time Zone The time zone set for the AP. Country The country set for the AP.
E IP device properties TABLE 233 VCS fabric properties Field/Component Description Properties tab Select to display information about the fabric. Detailed Report button Click to launch the detailed cluster report. Name The name of the fabric. Alias The alias name. This is an editable field. Host Name The host name associated with the fabric. System Name The name of the product. IP Address The IP address (IPv4 or IPv6 format) of the product.
IP device properties TABLE 233 E VCS fabric properties (Continued) Field/Component Description System OID The system’s object identifier. Product Type The fabric’s product type, which is a Layer 2 switch. Serial # The VCS fabric member’s serial number. VCS Mode The VCS mode of the switch, which can be standalone or VCS fabric. VCS ID The VCS ID configured in the fabric. Config Mode The configuration mode of the fabric, which is Local Only or Distributed.
E IP device properties TABLE 233 VCS fabric properties (Continued) Field/Component Description VLANs The number of virtual LANs (VLANs) associated with the port profile, along with the following VLAN information: • All — Indicates that the port profile will allow all VLAN IDs. • None — Indicates that the port profile will not allow any VLAN IDs. • All Except — Indicates that the port profile will allow any packet except the VLAN IDs specified.
IP device properties TABLE 233 E VCS fabric properties (Continued) Field/Component Configuration Description Displays one of the following VLAN configuration options: • Access mode — Supports MAC address and MAC group classification. • Trunk mode • Add — Adds VLAN IDs to the port profiles. • Remove — Deletes VLAN IDs to the port profiles. • All — Indicates that the port profile allows all VLAN IDs. • None — Indicates that the port profile does not allow any VLAN IDs.
E IP device properties TABLE 233 VCS fabric properties (Continued) Field/Component Maps Description Displays details about the following DCB maps: • CoS to CoS — Displays the details of the CoS to CoS map assigned to the port. • Traffic Class — Displays the details of the Traffic Class map assigned to the port. NOTE: The CoS to CoS map is the default. QoS tab — Non-DCB mode (Ethernet Pause and Ethernet PFC) Mode The mode of Quality of Service (QoS) assigned to the port (non-DCB).
IP device properties TABLE 233 E VCS fabric properties (Continued) Field/Component Fabric and Edge Ports properties Description • • • • • • • • • • • • • • • • • Brocade Network Advisor SAN + IP User Manual 53-1003155-01 Identifier — The identifier of the port. Name — The name of the port. This is an editable field. Enter a name (up to 64 characters) for the port. MAC Address — The MAC address of the port. Port Status — The status of the port. Port State — The state of the port.
E IP device properties TABLE 233 VCS fabric properties (Continued) Field/Component FC Ports properties Description • • • • • • • • • • • • • • • • • • • • • • • 2206 Identifier — The identifier of the port. Name — The name of the port. This is an editable field. Enter a name (up to 64 characters) for the port. WWN — The world wide name of the device. FC Address — The Fibre Channel address. Each FC port has both an address identifier and a world wide name. Status — The operational status.
Host properties TABLE 233 E VCS fabric properties (Continued) Field/Component Description SFP/Port Optics Click to view the SFP/Port Optic information: • TX Power — The power transmitted to the SFP in dBm and uWatts. • RX Power — The power received from the port in dBm and uWatts. • Transceiver Temp (C) — The temperature of the SFP transceiver. • Voltage (mVolts) — The voltage across the port in mVolts. • Transceiver Current (mAmps) — The laser bias current value in mAmps.
E Host properties Viewing adapter port properties To view adapter port properties, complete the following steps. 1. Right-click an HBA icon and select Show Ports. 2. Right-click the port and select Properties, or double-click the port. Fields containing a green triangle ( ) in the lower right corner are editable. The HBA_Port Properties dialog box displays. Table 31 details the properties of the selected port.
Host properties TABLE 31 E Adapter port properties (Continued) Field Description WWN Source The source of the world wide name. Options include: Fabric — The WWN is assigned from the fabric. The fabric assigned address must be enabled. Factory — The WWN is assigned at the factory. Hyper-V Virtual FC Indicates if the port is a Hyper-V virtual FC port. For non-virtual ports, the field displays as N/A. NOTE: This property is applicable only to Windows server’s version 2012 and later.
E Host properties TABLE 31 Adapter port properties (Continued) Field Description FCSP Status Whether FC-SP authentication is being used. Algorithm The configured authentication algorithm. Group The DH group, which is DH-null (group 0), which is the only option. Error Status The health status of the Fibre Channel Security Protocol parameters. QoS Configured QoS State Indicates whether QoS is enabled or disabled. Operating QoS State Indicates whether QoS is on or off.
Properties customization E Properties customization NOTE Properties customization requires read and write permissions to the Properties - Add / Delete Columns privilege. You can customize the product and fabric Properties dialog boxes by creating user-defined fabric, product, and port properties. You can also edit or delete user-defined properties, as needed.
E Properties customization Editing a property field NOTE Properties customization requires read and write permissions to the Properties - Add / Delete Columns privilege. You can edit any property that you create on the Properties dialog box. Fields containing a green triangle ( ) in the lower right corner are editable. To edit a field with a green triangle ( ), click in the field and make your changes. To edit a user-defined property, complete the following steps. 1.
Properties customization E 1. Right-click any product icon and select Properties. The Properties dialog box displays. 2. Select the tab on which you want to edit a field. Fields containing a green triangle ( ) in the lower right corner are editable. 3. Click in an editable field and change the information. 4. Click OK.
E 2214 Properties customization Brocade Network Advisor SAN + IP User Manual 53-1003155-01
Appendix F Regular Expressions In this appendix This appendix presents a summary of Unicode regular expression constructs that you can use in the Management application. • Characters . . . . . . . . . . . . . . . . . . . . . . . . . . . . . . . . . . . . . . . . . . . . . . . . . • Character classes . . . . . . . . . . . . . . . . . . . . . . . . . . . . . . . . . . . . . . . . . . . . • Predefined character classes . . . . . . . . . . . . . . . . . . . . . . . . . . . . . . . . . . .
F Regular Expressions TABLE 1 Matches \e The escape character ('\u001B') \cx The control character corresponding to x TABLE 2 Character classes Construct Matches [abc] a, b, or c (simple class) [^abc] Any character except a, b, or c (negation) [a-zA-Z] a through z or A through Z, inclusive (range) [a-d[m-p]] a through d, or m through p: [a-dm-p] (union) [a-z&&[def]] d, e, or f (intersection) [a-z&&[^bc]] a through z, except for b and c: [ad-z] (subtraction) [a-z&&[^m-p]] a through z
Regular Expressions TABLE 4 POSIX character classes (US-ASCII only) Construct Matches \p{Blank} A space or a tab: [ \t] \p{Cntrl} A control character: [\x00-\x1F\x7F] \p{XDigit} A hexadecimal digit: [0-9a-fA-F] \p{Space} A whitespace character: [ \t\n\x0B\f\r] TABLE 5 java.lang.Character classes (simple java character type) Construct Matches \p{javaLowerCase} Equivalent to java.lang.Character.isLowerCase() \p{javaUpperCase} Equivalent to java.lang.Character.
F Regular Expressions TABLE 8 Construct Matches X? X, once or not at all X* X, zero or more times X+ X, one or more times X{n} X, exactly n times X{n,} X, at least n times X{n,m} X, at least n but not more than m times TABLE 9 Reluctant quantifiers Construct Matches X?? X, once or not at all X*? X, zero or more times X+? X, one or more times X{n}? X, exactly n times X{n,}? X, at least n times X{n,m}? X, at least n but not more than m times TABLE 10 Possessive quantifiers Co
Regular Expressions TABLE 12 F Back references Construct Matches \n Whatever the nth capturing group matched Quotation \ Nothing, but quotes the following character \Q Nothing, but quotes all characters until \E \E Nothing, but ends quoting started by \Q TABLE 13 Special constructs (non-capturing) Construct Matches (?:X) X, as a non-capturing group (?idmsux-idmsux) Nothing, but turns match flags on–off (?idmsux-idmsux:X) X, as a non-capturing group with the given flags on–off (?=X)
F 2220 Regular Expressions Brocade Network Advisor SAN + IP User Manual 53-1003155-01
Appendix G CLI Templates In this appendix The Management application provides preconfigured Configuration templates for IronWare and Network OS devices. By default, all preconfigured templates are configure to prompt for additional targets during manual deployment. The preconfigured templates include the following: • HyperEdge – Stack Enable . . . . . . . . . . . . . . . . . . . . . . . . . . . . . . . . . . . . • HyperEdge – Stack Disable . . . . . . . . . . . . . . . . . . . . . . . . . . . . . . . .
G CLI Templates • Network OS – Configure RX Symbol Errors Monitor . . . . . . . . . . . . . . . . • Network OS – Configure Standard L2 Access List . . . . . . . . . . . . . . . . . • Network OS – Create CoS Mutation Map. . . . . . . . . . . . . . . . . . . . . . . . . • Network OS – Create LLDP Profile . . . . . . . . . . . . . . . . . . . . . . . . . . . . . . • Network OS – Create Port Profile . . . . . . . . . . . . . . . . . . . . . . . . . . . . . . . • Network OS – Create Traffic Class Map . . . . .
CLI Templates G • IronWare OS VLAN – Configure virtual routing interface . . . . . . . . . . . . 2235 • IronWare OS VLAN – Enable Spanning Tree Protocol on IOS VLAN . . . . 2235 • IronWare OS VLAN – Disable Spanning Tree Protocol on IOS VLAN. . . . 2236 • Network OS VLAN – VLAN Interface Creation . . . . . . . . . . . . . . . . . . . . . 2236 • Network OS VLAN – VLAN Interface Deletion . . . . . . . . . . . . . . . . . . . . . 2236 • Network OS VLAN – Layer2 Switch Port Configuration . . . . . . . . . . .
G CLI Templates TABLE 19 Feature HyperEdge – Stack Trunk Deletion Description HyperEdge To delete stacking trunks.
CLI Templates TABLE 27 IronWare OS – Configure L2-Access-List Feature Description CLI Commands ACL access-list $ deny $ $ any access-list $ deny any $ $ access-list $ permit $ $ any access-list $ permit any any no access-list $ permit any any no access-list $ permit $ $ any
G CLI Templates TABLE 31 Feature Description CLI Commands MCT Delete cluster. no cluster $ $ no vlan $ no vlan $ TABLE 32 MCT Client Creation Feature Description CLI Commands MCT Create a cluster client.
CLI Templates TABLE 36 G MPLS – Endpoint Configuration Feature Description CLI Commands MPLS Used to configure MPLS endpoints. Disable FDP, CDP as they are not supported in MPLS endpoints.
G CLI Templates TABLE 39 Network OS – Configure Extended L2 Access List Feature Description CLI Commands ACL This template is used to configure an extended L2 ACL on Network OS products running 3.0 or later.
CLI Templates TABLE 42 G Network OS – Configure RX Missing Terminations Characters Monitor Feature Description CLI Commands Network OS This template is used to configure threshold and alert values for RX Missing Termination Characters monitoring. Possible values for timebase are day, hour, minute and none. Buffer value cannot be more than average of high plus low threshold. Supported Values for High and Low Threshold Action Parameters are email, raslog, all, and none.
G CLI Templates TABLE 46 Feature Description CLI Commands QoS This template is used to create LLDP profile and configure LLDP profile parameters protocol lldp profile $ description $ hello $ multiplier $ advertise dcbx-fcoe-logical-link-tlv advertise dcbx-fcoe-app-tlv TABLE 47 Network OS – Create Port Profile Feature Description CLI Commands AMPP Creates the port profile and its sub profile.
CLI Templates TABLE 50 G Network OS – Create VLAN Classifier Rule Feature Description CLI Commands QoS This template is used to create a protocol-based or MAC address-based VLAN classifier rule vlan classifier rule $ $ TABLE 51 Network OS – Delete Port Profiles Feature Description CLI Commands AMPP Removes the port profile.
G CLI Templates TABLE 55 Feature Description CLI Commands VLAN To configure PVLAN type (Isolated, community or primary) to a VLAN. interface vlan $
CLI Templates TABLE 62 G Private VLAN – Map primary and secondary VLAN to promiscuous port Feature Description CLI Commands VLAN To assign Primary Vlan to Promiscuous port. This command also maps a Promiscuous port to selected secondary VLANs.
G CLI Templates TABLE 68 Feature Description CLI Commands VLAN To display the private vlan status. show vlan private-vlan TABLE 69 VRF – VRF Creation Feature Description CLI Commands VRF To create VRF in specific RBridge. rbridge-id $ vrf $ TABLE 70 VRF – VRF Deletion Feature Description CLI Commands VRF To delete VRF from specific RBridge.
CLI Templates TABLE 75 VRF – Display VRF Information Feature Description CLI Commands VLAN To display the VRF details. show vrf detail show vrf rbridge-id $ show vrf $ TABLE 76 IronWare OS VLAN – Remove interfaces from VLAN as untagged Feature Description CLI Commands VLAN To remove interfaces from the VLAN as untagged.
G CLI Templates TABLE 84 Feature Description CLI Commands VLAN To disable spanning tree protocol on VLAN. vlan $ no spanning-tree TABLE 85 Network OS VLAN – VLAN Interface Creation Feature Description CLI Commands VLAN To create a VLAN Interface. interface vlan $ TABLE 86 Network OS VLAN – VLAN Interface Deletion Feature Description CLI Commands VLAN To delete a VLAN Interface.
CLI Templates TABLE 91 G Network OS VLAN – Disable Native VLAN Configuration Feature Description CLI Commands VLAN To disable native VLAN from a trunk interface. interface tengigabitethernet $ no switchport trunk native-vlan $ TABLE 92 Network OS VLAN – Access Interface Configuration Feature Description CLI Commands VLAN To configure the interface as an access interface.
G 2238 CLI Templates Brocade Network Advisor SAN + IP User Manual 53-1003155-01
Appendix H Troubleshooting In this appendix • Application Configuration Wizard troubleshooting . . . . . . . . . . . . . . . . . • Browser troubleshooting . . . . . . . . . . . . . . . . . . . . . . . . . . . . . . . . . . . . . . • Client browser troubleshooting. . . . . . . . . . . . . . . . . . . . . . . . . . . . . . . . . . • Configuration backup and restore troubleshooting . . . . . . . . . . . . . . . . . • Discovery troubleshooting. . . . . . . . . . . . . . . . . . . . . . . . . . . . . . . . .
H Application Configuration Wizard troubleshooting Application Configuration Wizard troubleshooting The following section states a possible issue and the recommended solution for Management application Configuration Wizard errors. Problem Resolution Unable to launch the Management application Configuration Wizard on a Windows Vista, Windows 7,or Windows 2008 R2 system The Windows Vista, Windows 7,or Windows 2008 R2 system enables the User Access Control (UAC) option by default.
Client browser troubleshooting H Client browser troubleshooting The following section states a possible issue and the recommended solution for client browser errors. Problem Resolution Downloading Client from a Internet Explorer Browser over HTTPS • If the JNLP file does not launch automatically, use one of the following options: Complete the following steps. 1 Save the JNLP file to the local host. 2 Launch the JNLP file manually. • In Internet Explorer 7, complete the following steps.
H Discovery troubleshooting Discovery troubleshooting The following section states a possible issue and the recommended solution for discovery errors. Problem Resolution After upgrading to Management application 12.x from 11.x, unable to discover Fabric OS devices. Error "4002" displays when trying to discover Fabric OS devices. The Management application 12.x uses Java 1.7, which disables the use of certificates with "weak authentication". You must update your Java certificates to resolve the issue.
FICON troubleshooting H FICON troubleshooting The following section states a possible issue and the possible cause for FICON errors. Problem Causes FICON not supported on switch error. FICON Unsupported Configurations: FICON is not supported on base switches. FICON is not supported on a logical switch which has an XISL configured. FICON is not supported if the PID format is 2. FICON is not supported if 10 bit address is enabled on 8-slot Backbone Chassis for non-default switch.
H Firmware download troubleshooting Problem Resolution Firmware download using SCP/SFTP does not work because of one of the following issues: • For internal SCP/SFTP server, the application was uninstalled and reinstalled without migration • For external SCP/SFTP server, the SSH handshake keypair is changed - manually - due to an external server reinstall - due to the SCP/SFTP server preference (Options dialog box) being changed from built-in to external (installed on same machine) or vice versa Clear
Launch Client troubleshooting H Launch Client troubleshooting The following section states a possible issue and the recommended solution if you are unable to launch the remote client. Problem Resolution Remote client does not upgrade from versions prior to 11.0. The remote client does not automatically upgrade when you select the remote client shortcut of client versions earlier than 11.0. To clear the old client and launch the new remote client version, complete the following steps.
H Launch Client troubleshooting Problem Resolution Unable to log into the Client (the application does not launch when you use a valid user name and password and exceptions are thrown in the client side). Use one the following procedures to configure the IP address in the host file. Windows operating systems 1 Log in using the 'Administrator' privilege. 2 Select Start > Run. 3 Type drivers in the Open field and press Enter. 4 Go to the ‘etc’ folder and open the ‘hosts’ file using a text editor.
Master Log and Switch Console troubleshooting H Master Log and Switch Console troubleshooting The following section states a possible issue and the recommended solution for switch console errors. Problem Resolution Too many login and log messages received on switch console and and Master Log due to lazy polling. NOTE: This setting cannot be disabled for DCB switches. To disable lazy polling, complete the following steps. 1 Select Discover > IP Products. The Discover Setup - IP dialog box displays.
H Patch troubleshooting Patch troubleshooting The following section states a possible issue and the recommended solution for patch errors. Problem Resolution Unable to launch the SMC on a Windows Vista,Windows 7,or Windows 2008 R2 system The Windows Vista,Windows 7,or Windows 2008 R2 system enables the User Access Control (UAC) option by default. When the UAC option is enabled, the SMC cannot launch.
Performance troubleshooting H Performance troubleshooting The following section states a possible issue and the recommended solution for Performance errors. Problem Resolution An error message with the following text displays: Real Time statistics collection has failed. Please see master log for details. Make sure that the following prerequisites for Performance Monitoring Data collection are met.
H Performance troubleshooting Problem Resolution An error message with the following text displays: Real Time statistics collection has failed. Please see master log for details. 2 2250 To collect data, the SNMP credentials in the Management application and switch must match. SNMP v1 or v3: The community strings entered in the Address Properties dialog box SNMP tab must match the one entered in the switch.
Performance troubleshooting Problem Resolution An error message with the following text displays: Real Time statistics collection has failed. Please see master log for details. 3 H To collect GigE port and FCIP statistics, you must enable the FCIP-MIB capability.
H Performance troubleshooting Problem Resolution An error message with the following text displays: Real Time statistics collection has failed. Please see master log for details. 5 To collect data on Virtual Fabric-enabled switches, the Fabric OS user must have access to all Virtual Fabrics. The SNMPv3 user name must be the same as the Fabric OS user name. If the SNMPv3 and Fabric OS user names do not match, data is not collected for the virtual switches with the non-default VF ID.
Port Fencing troubleshooting H Port Fencing troubleshooting The following section states a possible issue and the recommended solution for Port Fencing errors. Problem Resolution If you segment a switch from a fabric then rediscover the switch without accepting changes, the Port Fencing dialog box displays the switch twice and the port count is doubled. Right-click on the fabric that the segmented switch (with red minus icon) is part of and select Accept Changes.
H Server Management Console troubleshooting Server Management Console troubleshooting The following section states a possible issue and the recommended solution for server management console errors. Problem Resolution Unable to launch the SMC on a Windows Vista,Windows 7 , or Windows 2008 R2 system The Windows Vista,Windows 7,or Windows 2008 R2 system enables the User Access Control (UAC) option by default. When the UAC option is enabled, the SMC cannot launch.
Supportsave troubleshooting H Problem Resolution Unable to launch the SMC on a Windows Vista or Windows 7 system continued Disable using the Group Policy by completing the following steps. You can perform this procedure on you local machine using Local Group Policy editor or for many computers at the same time using the Active Directory-based Group Policy Object (GPO) editor. To disable using the Local Group Policy editor, complete the following steps.
H Technical support data collection troubleshooting Technical support data collection troubleshooting The following section states a possible issue and the recommended solution for technical support data collection errors.
Wireless troubleshooting H Wireless troubleshooting After discovery, the Management application inspects the trap listener and syslog recipient configuration on wireless controllers. If there is a problem with the registration, the Management application changes the “registration success” master log event to a warning event with additional message text.
H Zoning troubleshooting Problem Resolution Zoning activation message displays for a long time, but zone configuration is not activated. Telnet zoning can take a long time. To improve speed, open the Discover Setup dialog box (Discover > Setup) and add the IP address for the device to the Selected Individual Addresses list. Out of memory error caused by running a zoning report for a large zone configuration (1 MB) in a medium-sized SAN due to a third party tool.
Appendix I Database Fields In this appendix • Database tables and fields. . . . . . . . . . . . . . . . . . . . . . . . . . . . . . . . . . . . 2259 • Views . . . . . . . . . . . . . . . . . . . . . . . . . . . . . . . . . . . . . . . . . . . . . . . . . . . . . . 2497 Database tables and fields NOTE The primary keys are marked by an asterisk (*) TABLE 16 ACH_CALL_CENTER Field Definition Format ID * Unique generated database identifier. int NAME Name of the Call Center.
I Database tables and fields TABLE 18 Definition Format Size TYPE Type of the event. varchar 256 CONTRIBUTOR_PATTERN Indicates the Contributor pattern to be used for searching the event contributor in event description. In some cases, FOS uses same message id for different events (e.g MAPS events). To increase the filtering capability of Call Home events, this contributor pattern string is used along with message id.
I Database tables and fields TABLE 23 ADAPTER_DRIVER_FILE_DETAILS Field Definition Format ID Unique generated database identifier.
I Database tables and fields TABLE 27 AOR_DEVICE_MAP Field Definition Format AOR_ID ID of AOR int DEVICE_ID The DEVICE ID can be IP Product or ServerIron ID which is in the AOR int TABLE 28 AOR_FABRIC_MAP Field Definition Format AOR_ID ID of AOR int FABRIC_ID FABRIC ID which is in the AOR int TABLE 29 Definition Format AOR_ID ID of AOR int HOST_ID HOST ID which is in the AOR int Definition Format AOR_ID ID of AOR int PORT_GROUP_ID IP of port group int Definition For
I Database tables and fields TABLE 33 AVAILABLE_FLYOVER_PROPERTY Field Definition Format ID* Unique generated database identifier. int NAME Name of the available property to be included in the flyover display. varchar TYPE Indicates the flyover property type. Product property is 0, Connection property is 1, User Defined property is 2, Cee Product property is 3, Cee Connection property is 4, Host property is 5.
I Database tables and fields TABLE 35 BIRTREPORT_RUN_TEMPLATE (Continued) Field Definition Format Size REPORT_TEMPLATE_TITLE Report Template title. This name is the same as the title name in the REPORT_TEMPLATE table. There is no foreign key relation here as the user may delete and add a template but the schedule should still hold good if looked up by title. Also title is unique in the REPORT_TEMPLATE table. varchar 256 NAME Name of the generated report file.
I Database tables and fields TABLE 37 BIRTREPORT_SCHEDULE_PARAMETER Field Definition Format ID The primary key of the table. int BIRTREPORT_SCHEDULE_T EMPLATE_ID Id of birtreport_schedule_template table. int BIRTTEMPLATE_PARAMETE R_ID Id of birttemplate_parameter table. int PARAM_VALUE Value of the parameter. varchar 256 PARAM_DISPLAY_VALUE Displays value of the parameter.
I Database tables and fields TABLE 41 BOOT_IMAGE_FILE_DETAILS_ Field Format ID int DRIVER_MAPPING_ID int BOOT_IMAGE_NAME Name of Boot Image file varchar MAJOR_VERSION Major Version bit from Boot Image file smallint MINOR_VERSION Minor Version bit from Boot Image file smallint MAINTENANCE Maintenance Version bit from Boot Image file smallint PATCH Patch Version bit from Boot Image file varchar IMPORTED_DATE Imported date of Boot Image file timestamp RELEASE_DATE Release date of B
I Database tables and fields TABLE 45 CARD (Continued) Field Definition Format SLOT_NUMBER The number of the physical slot in the chassis where the blade is plugged in. For fixed blades, SlotNumber is zero. smallint TYPE ID of the blade to identify the type. smallint EQUIPMENT_TYPE The type of the blade. It is either SW BLADE or CP BLADE. varchar 32 STATE State of the blade, such as ENABLED or DISABLED. varchar 32 POWER_STATE State of power supply to the blade.
I Database tables and fields TABLE 45 CARD (Continued) Field Definition Format Size CP_HA_STATE CP’s HA state information like Active/Stand by. varchar 128 ETHERNET_IPV6_ADDRESS IPV6 address of Ethernet management port for the blade. varchar 64 ETHERNET_IPV6_GATEWAY IPV6 Gateway address of Ethernet management port for the blade. varchar 64 NUMBER_OF_PORTS HEADER_VERSION The OEM or vendor-assigned version number. int GIGE_MODE Determines the port operating mode for GE ports.
I Database tables and fields TABLE 50 CEE_PORT Field Definition Format ID Unique generated database identifier.
I Database tables and fields TABLE 51 CFG_BACKUP_ARCHIVE (Continued) Field Definition Format Size DATE_TIME The date and time at which the configuration has been backedup. The date and time will be saved in the following format "Mon May 10 17:59:13 PDT 2010". varchar 64 varchar 64 FILE_NAME IS_BASELINE Indicates if the configuration file is selected by user as baselined configuration or not. num (1,0) DESCRIPTION Brief comments and description about this configuration.
I Database tables and fields TABLE 53 CLI_TEMPLATE (Continued) Field Definition Format Size DEVICE_PASSWORD varchar 256 DATE_TIME varchar 64 DEVICE_ENABLE_USERNA ME varchar 256 DEVICE_ENABLE_PASSWOR D varchar 256 CLI_FILTER varchar HAS_PARAMETERS num (1,0) PROMPT_ADDITIONAL_TAR GET The flag to indicate whether or not to prompt for additional targets during deployment. 1 = Prompt for additional targets. 0 =Do not prompt for additional target.
I Database tables and fields TABLE 55 Field Definition Format ID * Unique generated database identifier. int NAME Name of the column. It is used as column header in product list and property name in property sheet(SAN and IP) varchar 255 ENTITY_CATEGORY Holds the type of the entity to whom the column name belongs to like Port, Fabric, IPProduct, VCSInterface, etc' varchar 128 COLUMN_INDEX Used to differentiate user defined columns and static columns.
I Database tables and fields TABLE 60 CNA_ETH_PORT Field Definition Format ID ID of the Eth port int ETH_DEV Ethernet device varchar ETH_LOG_LEVEL Log level for the Ethernet device. Possible values are 0 - Log Invalid 1 - Log Critical 2 - Log Error 3 - Log Warning 4 - Log Info int NAME Name of the port varchar 256 MAC_ADDRESS MAC Address varchar 64 IOC_ID IO controller ID. The default value is 0.
I Database tables and fields TABLE 62 Definition Format Size MAX_BANDWIDTH Maximum guaranteed bandwidth. Value will be in Gbps (1 to 10). varchar 64 MIN_BANDWIDTH Minimum guaranteed bandwidth. Value will be in Gbps (0 to 10). int PORT_NUMBER Physical port number of adapter. int PORT_TYPE Type of this port. For example, ETH. varchar CREATION_TIME Creation time of this DB record. timestamp CONFIGURATION_STATUS Indicates current configuration status of the port.
I Database tables and fields TABLE 65 COLLECTOR_MIB_OBJECT_ENTRY Field Definition Format COLLECTOR_MIB_OBJECT_ ENTRY_ID Primary key autogenerated ID. int COLLECTOR_ID ID of the PERF_COLLECTOR. int MIB_OBJECT_ID MIB_OBJECT table DB ID. int TABLE 66 COLLECTOR_SNMP_EXPRESSION_ENTRY Field Definition Format COLLECTOR_SNMP_EXPRE SSION_ENTRY_ID Primary key autogenerated ID. int COLLECTOR_ID ID of the PERF_COLLECTOR. int EXPRESSION_ID Id of the SNMP_EXPRESSION.
I Database tables and fields TABLE 69 Field Definition Format ID Condition ID. int NAME Name of the condition. varchar 255 DESCRIPTION Description of the condition. varchar 1024 REMEDIATION Remediation details for failed conditions. text USE_REGEX Indicates whether the condition lines are built with regular expression or not. 0 = Does not contain Regular expression 1 = Contains regular expression smallint MATCH The device config should Match or Not match with condition.
I Database tables and fields TABLE 70 CORE_SWITCH (Continued) Field Definition Format UNREACHABLE_TIME Time when the switch becomes unreachable. timestamp OPERATIONAL_STATUS Chassis operational status like FRU, Power Supply etc.. varchar CREATION_TIME Core switch record creation time. This tells us when the intial discovery has happened. timestamp LAST_SCAN_TIME Last scan time tells the time when the last time the switch was polled.
I Database tables and fields TABLE 70 Definition Format Size NAT_PRIVATE_IP_ADDRESS NAT private IP Address. Feature available from NMS DC Eureka release onwards. During a successful NAT translation the Private IP that gets translated will be stored in this field. The new translated IP Address will be stored in the existing IP_ADDRESS field. All the NAT look up will be done using the NAT Private IP Address. varchar 128 ALTERNATE_IP_ADDRESS Alternate IP address of the switch.
I Database tables and fields TABLE 74 CORE_SWITCH_DETAILS (Continued) Field Definition Format Size FC_MASK FC IP Address ethernet mask. char 64 FC_IP Fibre Channel IP address. char 64 FC_CERTIFICATE FC IP Address. smallint SW_LICENSE_ID License ID of the chassis. char 23 SUPPLIER_SERIAL_ NUMBER Supplier serial number for the switch. varchar 32 PART_NUMBER Partnumber of the switch varchar 32 CHECK_BEACON Denotes if Switch Beacon is enabled or not on the switch.
I Database tables and fields TABLE 74 Definition Format Size VENDOR_VERSION Required by integrated SMI agent to populate Brocade_Product.Version property. varchar 32 VENDOR_PART_NUMBER Required by integrated SMI agent to populate Brocade_Product.SKUNumber property. varchar 32 SNMP_INFORMS_ENABLED Flag to denote whether SNMP informs option in the switch is enabled or disabled. Default value is 0. smallint RNID_SEQUENCE_NUMBER RNID sequence number for the switch.
I Database tables and fields TABLE 76 CRYPTO_LUN Field Definition Format ID Unique generated database identifier. int CRYPTO_TARGET_CONTAI NER_ID Foreign key reference to the CRYPTO_TARGET_CONTAINER that contains the host for which these LUNs are configured. int SERIAL_NUMBER The LUN serial number, used to identify the physical LUN. varchar ENCRYPTION_STATE Boolean. • True (1) if LUN is being encrypted. • False (0) if cleartext. The default value is 0.
I Database tables and fields TABLE 76 2282 CRYPTO_LUN (Continued) Field Definition Format DECRYPT_EXISTING_DATA Not used. When configuring disk LUN that was previously encrypted and is to become cleartext, this property tells the switch whether or not to start a re-keying operation to decrypt the existing LUN data. This property does not need to be persisted. This feature is no longer supported in FOS.
I Database tables and fields TABLE 76 CRYPTO_LUN (Continued) Field Definition Format Size NEW_LUN_TYPE This field indicates the role of the LUN configured in the SRDF mode. The values could be R1, R2 or UNKNOWN. Feature available only from 6.4 release onwards and for RSA key vaults. CryptoLuncollector fills in this value. varchar 64 DISABLE_WRITE_EARLY_A CK This variable indicates whether write early acknowledgement is enabled (if value is 0) or disabled (if value is 1).
I Database tables and fields TABLE 77 Definition Format PRIMARY_VAULT_LINK_ STATUS The status of the link key for the primary key vault. Link keys are used only for NetApp LKM key vaults. For possible values, see the enum definition in the DTO class. Default value is 0. smallint BACKUP_VAULT_LINK_ STATUS The status of the link key for the backup key vault. Link keys are used only for NetApp LKM key vaults. For possible values, see the enum definition in the DTO class. Default value is 0.
I Database tables and fields TABLE 78 CRYPTO_TARGET_CONTAINER (Continued) Field Definition Format FAILOVER_STATUS Indicates whether this container''s target is being encrypted by the encryption engine on which the container is configured (value 0) or by another encryption engine in the HA Cluster (value 1). Default value is 0.. smallint FAILOVER_STATUS_2 Failover status from the HA Cluster peer.
I Database tables and fields TABLE 80 Definition Format LAST_OPENED_TIME Time when dashboard was last opened. timestamp SHARED Indicates whether the dashboard is shared. 0 Not Shared 1 - Shared. int TABLE 81 Size DASHBOARD_CANVAS Field Definition Format ID Dashboard Canvas ID. int NAME Name of the Dashboard canvas. varchar 128 DESCRIPTION Description of the dashboard canvas.
I Database tables and fields TABLE 83 DASHBOARD_PROVIDER Field Definition PROVIDER_GROUP The Group to which the Provider belong to. varchar Similar providers will have same group name. PROVIDER_ORDER The order of execution passed to the Job Executor framework. Provider belong to same group will have different order number. Default: 0 TABLE 84 Format Size 128 int DASHBOARD_WIDGET Field Definition Format ID ID of the dashboard widget. Auto incremented.
I Database tables and fields TABLE 84 Definition Format installation_type Indicates the widgets is SAN Only (0) / IP Only (1) / SAN_IP (2)' int shared_provider Can the provider be shared? 0 - Not Shared 1 - Shared. int TABLE 85 Size DASHBOARD_WIDGET_PREFERENCE Field Definition Format ID Auto incremented widget preference ID. int WIDGET_ID Foreign Key to DASHBOARD_WIDGET(ID). int USER_ID Foreign Key to USER_ (ID). int DASHBOARD_ID Foreign Key to DASHBOARD(ID).
I Database tables and fields TABLE 86 DEFAULT_FAVORITES (Continued) Field Definition Format Size MAIN_MEASURE The Additional measures based on the FAVORITE.MAIN_MEASURE varchar 40 ADDITIONAL_MEASURE The Additional measures based on the FAVORITE.MAIN_MEASURE int TABLE 87 DEFAULT_WIDGET_PREFERENCE Field Definition Format ID Auto incremented Dashboard Widget Preference ID. int dashboard_id Foreign Key to DASHBOARD(ID). int widget_id Foreign Key to DASHBOARD_WIDGET(ID).
I Database tables and fields TABLE 88 DEPLOYMENT_CONFIGURATION (Continued) Field Definition Format SNAPSHOT_ENABLED 1 indicates that snapshot is applied to the configuration smallint CLI_TEMPLATE_ID Identifies the CLI template details.
I Database tables and fields TABLE 90 DEPLOYMENT_PRODUCT_STATUS (Continued) Field Definition Format PRODUCT_ID This record will be per product. Hence this will have the id of the product. int PRODUCT_TYPE_ID Foreign Key references TARGET_TYPE(id). This identifies the PRODUCT_ID. (Whether it is switch, device, etc). int STATUS Indicated the product deployment status 1-Aborted 2-Succesful 3-Partial Failure 4-Failed smallint MESSAGE Message to be displayed in the report.
I Database tables and fields TABLE 93 Field Definition Format ID Unique generated database identifier. serial DEPLOYMENT_CONFIGU RATION_ID Foreign Key References DEPLOYMENT_CONFIGURATION (id) Identifies the deployment configuration this row is applied int TARGET_ID Identifies the target.
I Database tables and fields TABLE 94 DEVICE (Continued) Field Definition Format Size TAC_USER_NAME User name for TACACS access. varchar 512 TAC_PASSWORD Password for TACACS access. varchar 512 TACPLUS_USER_NAME User name for TACACS+ access. varchar 512 TACPLUS_PASSWORD Password for TACACS+ access. varchar 512 IS_ROUTER Flag to identify whether the device is router or not. num (1,0) IS_SLB Flag to identify whether the device supports server load balancing or not.
I Database tables and fields TABLE 94 2294 DEVICE (Continued) Field Definition Format Size TAC_USERNAME_PORT_CFG TACACS username for port configuration. varchar 512 TAC_PASSWORD_PORT_CFG TACACS password for port configuration. varchar 512 TAC_USERNAME_READ_ONLY TACACS username for read only access. varchar 512 TAC_PASSWORD_READ_ONLY TACACS password for read only access. varchar 512 TACPLUS_USERNAME_PORT_CFG TACACS+ username for port configuration.
I Database tables and fields TABLE 94 DEVICE (Continued) Field Definition Format Size SYSLOG_REGISTERED This flag is to indicate whether the device is registered DCM as its syslog destination server. • 0 indicates not registered. • 1 indicates registered. num 1 TRAP_REGISTERED This flag is to indicate whether the device is registered DCM as its SNMP trap destination server. • 0 indicates not registered. • 1 indicates registered.
I Database tables and fields TABLE 94 2296 DEVICE (Continued) Field Definition Format IS_DCB_SWITCH This column is used to flag whether the device is num a DCB Switch or not. Value 0 indicates that this is not a DCB switch device and hence that is the default value and value 1 indicates that this is a DCB device. The values will be populated by the DCB collector during the discovery of the DCB switch. PRODUCT_FAMILY Record the product family as "BI", "EI", "FGS/FLS/STK".
I Database tables and fields TABLE 94 DEVICE (Continued) Field Definition Format VCS_ID This column is used to store the VCS ID of the device. The value will be populated by the NosSwitchAssetCollector during the discovery of the VCS Cluster. The non zero value will be stored as VCS ID. Default value is -1. smallint VCS_LICENSED Indicates whether the cluster device has VCS license or not. Possible values are 0 for not applicable, 1 for licensed, 2 for not licensed. 0 is default.
I Database tables and fields TABLE 94 Definition Format Size USER_DEFINED_VALUE_1 User defined value used for product. varchar 256 USER_DEFINED_VALUE_2 User defined value used for product. varchar 256 USER_DEFINED_VALUE_3 User defined value used for product. varchar 256 CLUSTER_MEMBER_STATE Indicates the state of the member in Fabric Cluster and logical chassis. States can be Online, Offline, Rejoining etc.. For all other devices this column will be empty.
I Database tables and fields TABLE 95 DEVICE_CONNECTION (Continued) Field Definition Format MISSING_TIME Time from which the device connection has been missing. timestamp TRUSTED Indicates if the device connection is trusted or not. int TABLE 96 Size DEVICE_ENCLOSURE Field Definition Format ID* Unique generated database identifier. int NAME Name of the Device enclosure. varchar 256 TYPE Type of Device enclosure - Storage Array/Server. varchar 32 ICON Type of Icon.
I Database tables and fields TABLE 96 Definition Format CREATION_TIME Time when enclosure was created. Default is ’now()’. timestamp MISSING Flag to indicate missing enclosure. Default value is 0. smallint MISSING_TIME Time when the enclosure is found to be missing. timestamp HOST_NAME Host Name corresponding to the Device Enclsoure. varchar SYSLOG_REGISTERED SysLog flag that indicates if syslog has been enabled or not.
I Database tables and fields TABLE 98 DEVICE_FDMI_DETAILS Field Definition Format DEVICE_NODE_ID Device node id for the FDMI device node. This column refers to the device_node tables primary key int SERIAL_NUMBER Holds the serial number of the device available via FDMI varchar 128 FIRMWARE_VERSION Holds the firmware version of the device available via FDMI ex: 2.1.0.2 varchar 64 DRIVER_VERSION Holds the driver version of the device available via FDMI, ex: 2.1.0.
I Database tables and fields TABLE 100 DEVICE_GROUP_ENTRY Field Definition Format DEVICE_GROUP_ID Database ID of the DEVICE_GROUP instance which the device is member of. int DEVICE_GROUP_ENTRY_ID Unique database auto generated identifier. int DEVICE_ID Database ID of the member DEVICE. int TABLE 101 DEVICE_GROUP Field Definition Format DEVICE_GROUP_ID Primary key for this table. int NAME Name of this device group.
I Database tables and fields TABLE 103 DEVICE_NODE (Continued) Field Definition Format Size TYPE Initiator or target or both or unknown. The possible values are Initiator, Target, Initiator+Target, Unknown(Initiator or Target) varchar 32 DEVICE_TYPE 0 = physical 1 = virtual 2 = NPV 3 = iSCSI 4 = both physical & virtual smallint SYMBOLIC_NAME Device node symbolic name. varchar 256 FDMI_HOST_NAME Device node FDMI host name. varchar 128 VENDOR Device node vendor.
I Database tables and fields TABLE 104 DEVICE_PORT Field Definition Format Size PORT_ID Stores the FDMI host name. varchar 6 TYPE Stores the Vendor of this device. varchar 32 SYMBOLIC NAME Stores the Symbolic Name. varchar 256 varchar 64 varchar 16 varchar 63 32 FC4_TYPE COS Stores the Class of Service. IP_PORT HARDWARE_ADDRESS Stores the Hardware Address. varchar TRUSTED Denotes if the device port is trusted or not. smallint CREATION_TIME The creation time of this record.
I Database tables and fields TABLE 105 DEVICE_PORT_GIGE_PORT_LINK (Continued) Field Definition Format VIRTUAL_FCOE_PORT_ID The value of virtual_fcoe_port_id in the Device_Port_Gige_Port_Link table is applicable only for NOS devices. For FOS devices, the virtual_fcoe_port_id value, will be null, as currently in the Management application that mapping data is not collected. Hence the default value is null. int LAG_ID LAG interface ID which associates port channel with end device.
I Database tables and fields TABLE 108 2306 ENCRYPTION_ENGINE (Continued) Field Definition Format STATUS Not used. Previously used to indicate the engine''s operational status. Replaced by EE_STATE. The default value is 0. smallint HA_CLUSTER_ID Foreign key reference to an HA_CLUSTER record. Identifies the HA Cluster that this engine belongs to. Null if this engine does not belong to an HA Cluster.
I Database tables and fields TABLE 108 ENCRYPTION_ENGINE (Continued) Field Definition Format Size LINK_STATE Local EE State says whether link is down or up varchar 256 REBALANCE_REQUIRED This field indicates whether a rebalance operation is required on the Encryption Engine. It can take two values, One(1) indicating that rebalance is required on the Encryption Engine and zero(0) indicating that no rebalance is required on the Encryption Engine.
I Database tables and fields TABLE 109 2308 ENCRYPTION_GROUP (Continued) Field Definition Format ACTIVE_MASTER_KEY_ STATUS The operational status of the "master key" or "Key Encryption Key (KEK)" used to encrypt Data Encryption Keys in a key vault. Not used for Decru LKM key vaults. 0 = not used, 1 = required but not present, 2 = present but not backed up, 3 = okay. The default value is 0.
I Database tables and fields TABLE 110 ENCRYPTION_GROUP_MEMBER Field Definition Format ID Unique generated database identifier.
I Database tables and fields TABLE 112 Definition Format TAPE_POOL_OPERATION_MODE Specifies which type of encryption should be used by tape volumes in this tape pool. 0 = Native, 1 = DF-compatible smallint TAPE_POOL_POLICY Specifies whether tape volumes in this tape pool should be encrypted. 0 = encrypted, 1 = cleartext smallint KEY_EXPIRATION Number of days each data encryption key for this tape pool should be used.
I Database tables and fields TABLE 115 EVENT (Continued) Field Definition Format Size ACKNOWLEDGED Indicates whether the user has acknowledged the event or not. Possible values: Unacknowledged-0 , Acknowledged-1. smallint SOURCE_NAME This field indicates the name of the source that triggered the event. This could be the name of the source switch or name of the Management application server in the case of application events.
I Database tables and fields TABLE 116 EVENT_CALL_HOME Field Definition Format ID Unique generated database identifier. int EVENT_ID Database ID of the EVENT instance. int EVENT_NUMBER Indicates the Event Number for the event from the Events.html of the associated product . int FRU_CODE Indicates the Field Replaceable Unit code of the Call Home event. int REASON_CODE Indicates the reason code of the Call Home event. int FRU_POSITION Indicates the FRU position of the Call Home event.
I Database tables and fields TABLE 119 EVENT_DETAILS (Continued) Field Definition Format UNIT Indicates the Unit number of the Chassis from which the event was triggered. smallint SLOT Indicates the blade or the slot number in which the port is present. int PORT indicates the switch port number for which the event was generated. int PRODUCT_ADDRESS Indicates the IP Address of the Product from which the event is originated. varchar RAS_LOG_ID Indicates the RASLOG Id of the RASLOG event.
I Database tables and fields TABLE 121 EVENT_INSTANCE (Continued) Field Definition Format Size STRING_PATTERN A Regular expression pattern string which can be used to match an Event instance. varchar 1024 CATEGORY A small integer which identifies the Category of an Event instance. 0 - Unknown 1 - Product Event 2- Link Incident Event 3 - Product Audit Event 4- Product Status Event 5 Security Event 6- User Action Event 7- Management Server Event. The default value is 0.
I Database tables and fields TABLE 123 EVENT_NOTIFICATION (Continued) Field Definition Format NOTIFICATION_UNIT Time interval Unit: 0 = Seconds 1 = Minutes 2 = Hours Default value is 0. smallint TEST_OPTION Time interval Unit: 0 = Send test to configured e-mail address. 1 = Send test to all enabled users. Default value is 0. smallint SSL_ENABLED Default value is 0.
I Database tables and fields TABLE 125 Definition Format EVENT_ORIGIN 0- SNMP Trap 1- Application Event 2- Pseudo Event 3Snort 4- Pseudo Event 5- Custom Event smallint PROPERTIES The property string which is used to define various parameters that are associated with an Event Policy such as flapping time and durations etc varchar TABLE 126 Size 2048 EVENT_POLICY_SOURCE_ENTRY Field Definition Format ID Unique generated database identifier.
I Database tables and fields TABLE 128 EVENT_RULE Field Definition Format ID* Unique generated database identifier. int NAME Name of the Event Rule. varchar Event Rule Type: 0 = Port Offline 1 = PM Threshold crossed 2 = Security Violation 4 = Event int DESCRIPTION Description about the Event Rule. varchar 512 OPERATOR1 AND operator used to append the rule. varchar 12 EVENT_TYPE_ID The Selected Event type ID from the Event type combo box.
I Database tables and fields TABLE 129 Definition Format Size NAME Name of the Event Rule Action: • Launch Script = for launch script • Send E-mail = for send e-mail • Raise Event = for broadcast message varchar 255 TYPE Name of the action: • script = for Launch Script • e-mail = for E-mail • message = for Broadcast message varchar 30 FIELD1 Data for the selected action. varchar 512 FIELD2 Data for the selected action. varchar 512 FIELD3 Data for the selected action.
I Database tables and fields TABLE 130 FABRIC (Continued) Field Definition Format TRACK_CHANGES 1 = changes (member switches, ISL and devices) in the fabric are tracked. Default value is 0. smallint STATS_COLLECTION 1 = statistics collection is enabled on the fabric. Default value is 0. smallint CREATION_TIME When the fabric record is inserted, i.e., created. Default value is ’now()’. timestamp LAST_FABRIC_CHANGED Time when fabric last changed.
I Database tables and fields TABLE 130 Definition Format VCS_LICENSED Indicates whether the fabric has VCS license or not. Possible values are 0 for not applicable, 1 for licensed, 2 for not licensed. 0 is default. Fabrics representing clusters with 2 or less nodes will have value of 0 as all those are automatically licensed. Fabrics representing clusters with 3 or more nodes will have values 1 or 2 depending on whether the license was acquired or not.
I Database tables and fields TABLE 134 FABRIC_DISCOVERY_POLICY_RULE Field Definition ID Format serial FABRIC_ID The database ID of the fabric that the policy belongs to. int FILTER Filter to be applied for this fabric. This could be IP Address or WWN or SwitchType. The Type of the filter comes from the FilterType column. This can be either in included list or excluded list depending on the EXCLUDED column value. varchar FILTER_TYPE This column indicates type of the filter.
I Database tables and fields TABLE 137 Field Definition Format FABRIC_ID Foreign key to ID in fabric table. int VCS_CLUSTER_ME_ID Foreign key to ID in ManagedElement table. This is the VCS cluster entry managed_element_id reference. int TABLE 138 Size FABRIC_ZONING_EDIT_RESTRICTION Field Definition Format ID Unique generated database identifier. int FABRIC_ID PK of the owning fabric int CHANGE_COUNT Count of the maximum changes allowed in active zone config in the fabric.
I Database tables and fields TABLE 139 FAVORITES (Continued) Field Definition Format CUSTOM_SELECTION_OBJE CT_TYPE Represents the selected filter type. • 0 - Default favorite • 1 - FC Ports • 2 - Device Ports • 3 - ISL Ports • 4 - 10GE Ports • 5 - FCIP Tunnels • 6 - EE Monitors Selected member identifiers are stored in CUSTOM_FAVORITES_OBJECT_LIST table if this favorite is not default. int PLOT_EVENTS Indicates whether the PM historical chart should overlay the events on the graph.
I Database tables and fields TABLE 142 2324 FCIP_TUNNEL (Continued) Field Definition Format KEEP_ALIVE_TIMEOUT FCIP Tunnel Parameter. int MAX_RETRANSMISSION FCIP Tunnel Parameter. int WAN_TOV_ENABLED Is WAN TOV enabled. Default value is 0. smallint TUNNEL_STATUS Tunnel Status (Active/Inactive). int DESCRIPTION Description for the created tunnel. varchar FICON_TRB_ID_ENABLED Whether Ficon_Tape_Read_Block is enabled on that tunnel. Default value is 0.
I Database tables and fields TABLE 142 FCIP_TUNNEL (Continued) Field Definition Format FICON_DEBUG_FLAGS FICON_DEBUG_FLAGS for that particular tunnel. Default value is -1. double precision REMOTE_WWN Configured WWN of the Remote Node. char CDC CDC Flag. Default value is 0. smallint ADMIN_STATUS Admin Status of the Tunnel. Default value is 0. smallint CONTROL_L2_COS Class of service as defined by IEEE 802.1p for tunnel. int Default value is -1.
I Database tables and fields TABLE 142 FCIP_TUNNEL (Continued) Field Definition Format TAPE_ACCELERATION_ENA BLED Whether turbo write (fast write) is enabled or not (0,1). Default value is 0. smallint IPSEC_ENABLED Default value is 0. smallint PRESHARED_KEY The preshared key on tunnel. char QOS_HIGH QoS high value. smallint QOS_MEDIUM QoS medium value. smallint QOS_LOW QoS low value.
Database tables and fields TABLE 143 I FCIP_TUNNEL_CIRCUIT (Continued) Field Definition Format SELECTIVE_ACK Select acknowledgement flag.The default value is 0. smallint QOS_MAPPING QOS Mapping. The default value is 0. smallint PATH_MTU_DISCOVERY MTU Discovery Path. The default value is 0. smallint MIN_COMM_RATE Minimum communication int Speed. The default value is 0. MAX_COMM_RATE Maximum communication int Speed. The default value is 0. MIN_RETRANSMIT_TIME Minimum Retransmission Time.
I Database tables and fields TABLE 143 2328 FCIP_TUNNEL_CIRCUIT (Continued) Field Definition Format Size MISMATCHED_CONFIGURATIONS If a tunnel is down due to mismatched configurations on local and remote end, this property specifies the list of such mismatched configurations. varchar 1024 CIRCUIT_STATUS_STRING Circuit Status string value from switch for the tunnel varchar 256 L2COS_F_CLASS The default value is 0. smallint L2_COS_HIGH The default value is 0.
I Database tables and fields TABLE 144 FCIP_TUNNEL_PERFORMANCE Field Definition Format TUNNEL_ID Primary key of the Switch Port int SWITCH_ID The number of octets or bytes that have been transmitted by this port. One second periodic polling of the port. This value is saved and compared with the next polled value to compute net throughput. Note, for Fibre Channel, ordered sets are not included in the count int TX 'The number of octets or bytes that have been transmitted by this port.
I Database tables and fields TABLE 145 Field Definition Format DEVICE_NODE_ID The primary key of the DeviceNode. int DIRECT_ATTACH Indicates whether the fcoe device is directly attached to the switch''s TE port or to a cloud. smallint ATTACH_ID The primary key of the port (if direct attached) or cloud (if not direct attached). int MAC_ADDRESS Mac address of device. varchar 64 Size TABLE 146 Size FCR_ROUTE Field Definition Format ID* Unique generated database identifier.
I Database tables and fields TABLE 149 FEATURES_USAGE (Continued) Field Definition Format USAGE_COUNT Count shows how many times the feature is accessed. int FIRST_UPDATED_TIME Identifies the first updated time stamp. timestamp TABLE 150 Size FICON_DEVICE_PORT Field Definition Format DEVICE_PORT_ID* Value for the device port to which these FICON properties are applied. int TYPE_NUMBER Size varchar 16 MODEL_NUMBER Ficon device model number, such as S18.
I Database tables and fields TABLE 152 Field Definition Format FIRMWARE_ID* ID for the firmware file. int SWITCH_TYPE* Switch type that supports this firmware file. smallint REBOOT_REQUIRED Reboot required flag for the switch type. smallint NUMFILES Number of files in the firmware. int TABLE 153 Size FOUNDRY_DEVICE Field Definition Format DEVICE_ID Database ID of the DEVICE instance. int IMAGE_VERSION Firmware image version currently running in the device.
I Database tables and fields TABLE 154 FOUNDRY_MODULE (Continued) Field Definition Format Size EXPANSION_MODULE_TYPE Expansion board type. Refer snAgentBrdExpBrdId in foundry.mib for more details and possible values. num (4,0) EXPANSION_MODULE_DESCRIPTION The expansion board description string. Expansion board are those boards attaching on the main board. varchar 128 TABLE 155 FOUNDRY_PHYSICAL_DEVICE Field Definition Format PHYSICAL_DEVICE_ID Unique generated identifier.
I Database tables and fields TABLE 159 FRU Field Definition Format ID Unique generated database identifier. int CORE_SWITCH_ID int TAG provides the TAG number of FRU element, requested by SMIA and values filled in by Switch Asset Collector. Field probably contains information such as asset tag or serial number data.
I Database tables and fields TABLE 159 FRU (Continued) Field Definition Format TOTAL_OUTPUT_POWER provides the total power output of the power supply FRU element, requested by SMIA and values filled in by Switch Asset Collector will be available only from FOS 6.4 switches and above. this field is applicable only for the power supply FRU element. The default value is -1.
I Database tables and fields TABLE 161 Definition Format Size EFCM_USER Management application user who has generated this report. varchar 128 REPORT_OBJECT Report object BLOB. bytea TIMESTAMP_ Timestamp when the report is generated. timestamp FABRIC_NAME Fabric Name. varchar 256 Field Definition Format Size ID* Unique generated database identifier. int SWITCH_PORT_ID ID for the GigE Port in SWITCH_PORT. int PORT_NUMBER GigE Port Number(0 for ge0 and 1 for ge1).
I Database tables and fields TABLE 163 GIGE_PORT_ETHERNET_CLOUD_LINK Field Definition Format ID Unique generated database identifier. int CLOUD_ID int SWITCH_PORT_ID The unique id of the switch TE port that this member connects to. int TRUSTED smallint CREATION_TIME timestamp MISSING smallint MISSING_TIME timestamp TABLE 164 GIGE_PORT_STATS Field Definition Format ID* Unique generated database identifier. int SWITCH_ID References the ID in CORE_SWITCH table.
I Database tables and fields TABLE 167 Field Definition Format ID Unique generated database identifier. serial NAME User-supplied name for the HA Cluster. varchar ENCRYPTION_GROUP_ID Foreign key reference to the ENCRYPTION_GROUP that contains this HA Cluster. int MEMBER_LIST A comma-separated list of Encryption Engines in the HA Cluster. Each engine is identified by a switch node WWN, followed by "/", followed by the slot number.
Database tables and fields TABLE 168 I HBA (Continued) Field Definition Format Size BIOS_VERSION The version level of the BIOS varchar 256 PCI_REG_VENDOR_ID The identifier of the PCI Register''s vendor varchar 32 PCI_REG_DEVICE_ID The device ID of the PCI Register varchar 32 PCI_REG_SUBSYSTEM_ID The ID of the PCI subsystem varchar 32 PCI_REG_SUBSYS_VENDOR_ID The ID of the PCI subsystem vendor.
I Database tables and fields TABLE 168 Definition Format Size VPD_PW PW details of the device varchar 32 VPD_EDC EDC details of the device varchar 32 VPD_MDC MDC details of the device varchar 32 VPD_FABRIC_GEOGRAPHY FABRIC_GEOGRAPHY of the device varchar 256 VPD_LOCATION LOCATION of the device varchar 256 VPD_MANUFACTURER_ID MANUFACTURER_ID of the device varchar 256 VPD_PCI_GEOGRAPHY PCI_GEOGRAPHY of the device varchar 256 VPD_VENDOR_DATA VENDOR_DATA of the device varchar
I Database tables and fields TABLE 170 HBA_PORT (Continued) Field Definition Format CONFIGURED_TOPOLOGY The topology setting. The default value is 1. int MAX_SPEED_SUPPORTED The maximum port speed that is supported on the port, in Gb/s. The default value is 0. int OPERATING_STATE Indicates whether the link is online or offline. The default value is 0. smallint OPERATING_TOPOLOGY The topology setting at which the port is operating. The default value is 1.
I Database tables and fields TABLE 171 HBA_PORT_DETAIL Field Definition Format DEVICE_PORT_ID Device port id acts as the primary key int PERSISTENT_BINDING Persistent binding value of the port. With persistent binding (on the host), one can bind a LUN to a specific device file, thus making sure devices reappear on the same device files after reboots. 0 – disable 1 – enabled smallint FABRIC_NAME Principal switch WWN of the Fabric to which the port is associated with.
I Database tables and fields TABLE 171 HBA_PORT_DETAIL (Continued) Field Definition Format MPIO_MODE_STATE Indicates whether multipathing mode is on or off.. The default value is 0. smallint PATH_TIME_OUT The value between 0 to 60 that specifies the time out session. Note you can only enable or edit the path time out when MPIO is disabled. int Size The default value is 0. LOGGING_LEVEL The port logging level. Values include Log Critical, Log Error, Log Warning, and Log Info.
I Database tables and fields TABLE 171 HBA_PORT_DETAIL (Continued) Field Definition Format Size MEDIA media of port varchar 64 IOC_ID IO controller ID int PREBOOT_DISABLED Boolean value indicating if port was disabled during preboot.. The default value is 0. smallint ALARM_WARNING A bit mask indicating degrading SFP if the bit mask has any 1s in it. It bit mask is all 0s then SFP is in good state. varchar IO_EXEC_THROTTLE_MAX Maximum value is 2000.
I Database tables and fields TABLE 173 HBA_PORT_FCOE_DETAILS (Continued) Field Definition Format Size FCF_FCMAP FC Map value of port. Currently not used. varchar 256 FCF_FPMA_MAC FPMA (fabric-provided MAC address) MAC address of port. Currently not used. varchar 64 FCF_MAC FCF (FCoE Forwarder) MAC value of port. varchar 64 FCF_MODE FCF (FCoE Forwarder) Mode of the port. Currently not used. varchar 256 FCF_NAMEID FCF (FCoE Forwarder) Name of the port currently Not used.
I Database tables and fields TABLE 174 2346 HBA_REMOTE_PORT Field Definition Format Size ID Autogenerate primary column. int SYMBOLIC_NAME The symbolic name associated with the remote port. varchar 256 PORT_WWN The world wide name of the remote device''s port.
I Database tables and fields TABLE 174 HBA_REMOTE_PORT (Continued) Field Definition Format Field to indicate whether the remote port supports data retransmission.0 would mean unsupported and nonzero value implies supported. The default value is 0. smallint DATA_RETRANSMISSION_S UPPORT Field to indicate whether the remote port supports the REC ELS command Channel number in the PCI Bus.Zero would mean unsupported and nonzero value implies supported. The default value is 0.
I Database tables and fields TABLE 176 HBA_TARGET Field Definition Format DEVICE_PORT_ID Primary key from the Device port table int HBA_REMOTE_PORT_LUN_ ID Primary key from the HBA Remote port lun table int BOOT_LUN Flag to indicate of the LUN is bootable. The default value is -1. smallint TRUSTED Denotes whether target is trusted or not. 0 denotes untrusted and 1 is for trusted.
I Database tables and fields TABLE 179 HOST_DISCOVERY_OPTION (Continued) Field Definition Format Size JSON_USERNAME Username for the JSON agent varchar 128 JSON_PASSWD Password for the JSON agent varchar 512 DISCOVER_CIM Flag to indicate CIM based discovery. on/off. The default value is 0. smallint CIM_IMPL CIM implemenation used. 1: SMI, 2: WMI. The default value is 0.
I Database tables and fields TABLE 181 HOST_DISCOVERY_REQ_GROUP Field Definition Format ID Auto generated primary key int NAME Unique name for the host request. The default value is ‘ New Host Group'. varchar( Primary key from the host discovery options table. Points to the associated discovery options int Reflects the status of the request E.g. 0-> Completed, 1->Delete Pending. The default value is 0.
I Database tables and fields TABLE 183 HOST_DISCOVERY_REQUESTS Field Definition Format Size ID Auto generated primary key. HOST_NAME Hostname: IP address or host name. varchar 256 DEVICE_ENCLOSURE_ID Identifier of the Host which this request is associated. int HOST_DISCOVERY_REQ_ GROUP_ID Identifier of the Host discovery request group which this request is associated. int HOST_DISCOVERY_OPTI ONS_ID Reference to the Host discovery options associated with this request.
I Database tables and fields TABLE 184 Definition Format PROCESSOR_COUNT Number of virtual CPUs of the VM. int STATUS Status of the VM. varchar 64 STATE Operational State of the VM. varchar 64 NOTES Notes describing the VM. varchar 2048 UPTIME The time since the VM was last powered up. varchar 512 Size TABLE 185 Definition Format ID Primary Key int HYPER_V_VM_ID ID of the HYPER_VIRTUAL_MACHINE instance.
I Database tables and fields TABLE 187 IFL_CONNECTION Field Definition Format BB_PORT_ID Backbone switch port ID. int BB_PORT_WWN Backbone switch port WWN. varchar 23 Definition Format Size TABLE 188 Size INTERFACE Field INTERFACE_ID int SWITCH_SERVICE_ID int DEVICE_ID int NAME varchar 255 IDENTIFIER varchar 255 TABLE_SUBTYPE varchar 255 TAG_MODE smallint VLAN_TAG_TYPE int UNTAGGED_VLAN_ID The existing Data type short has been modified to integer.
I Database tables and fields TABLE 188 Definition Format Size USER_DEFINED_VALUE_3 User defined value used for IP Port. varchar 256 FEATURES_SUPPORTED Contains the features supported as a bit mask at port level. Possible values are: 1 - Flex port (can be converted to fiber channel or Ethernet port) int TABLE 189 INTERFACE_DEPLOYMENT_CONFIG Field Definition Format ID Unique generated database identifier. serial DEPLOYMENT_ID Deployment configuration ID. Foreign Key for DEPLOYMENT table.
I Database tables and fields TABLE 190 IP_DEVICE_LICENSE (Continued) Field Definition Format PRECEDENCE Defines the priority of a particular trial license among those having the same package and License ID. This is primarily used for determining which license to use, when there are many trial and normal licenses with same package name and LID. The value range is (0..65535) int LICENSE_STATE This indicates the state of the license.
I Database tables and fields TABLE 193 IP_ROUTE (Continued) Field Definition Format SLOT_NUMBER Slot Number related to the GigE Port. int NET_MASK Subnet Mask for the Route. varchar 64 GATEWAY Gateway for the Route. varchar 64 IP_ADDRESS IP Address created after ''”&”'' operation of gateway. varchar 64 METRIC Metric. int FLAG Flag. int CHECKSUM Check Sum. varchar GIGE_PORT_TYPE Whether the IP interface is created on a 10G cross port or not.
I Database tables and fields TABLE 196 ISL (Continued) Field Definition Format TRUSTED Denotes whether ISL link is trusted or not. • 0 denotes untrusted • 1 denotes trusted. smallint CREATION_TIME Creation time of the ISL record in the Management application database. timestamp MISSING Denotes whether ISL link is missing or not. • 0 denotes present • 1 states that ISL is missing smallint MISSING_TIME States the missing time of the this ISL.
I Database tables and fields TABLE 197 Definition Format TRUNKED This column is used to determine whether the isl is part of a trunk or not. The value of 0 means not trunked, 1 means this isl is part of a trunk and -1 means not applicable status. Default value is -1. int MASTER_CONNECTION_ID This will hold the id of the master ISL connection for a ISL between trunk members. The ISL Connection between masters will have its own ID in this column. Non trunk ISLs will have the default value of -1.
I Database tables and fields TABLE 198 ISL_TRUNK_GROUP (Continued) Field Definition Format MISSING_TIME States the missing time of the this ISL trunk group. If the trunk is not missing then it will be null timestamp MEMBER_TRACKING_STAT US Member added/removed status of this trunk. This is represented as bitmap value. Each bit is set based on membership state change. Currently only 2 bits from LSB are used.
I Database tables and fields TABLE 201 L2_ACCESS_CONTROL_ENTRY Field Definition Format ID serial ACCESS_CONTROL_LIST_ID L2 access control list ID, to which the ACL entry is associated. SEQUENCE_NUMBER int int ACTION Specifies the action: 0 = Permit 1 = Deny smallint SOURCE_MAC Source MAC address. varchar 24 SOURCE__MASK Source MAC address mask. varchar 24 DEST_MAC Destination MAC address. varchar 24 DEST_MASK Destination MAC address mask.
I Database tables and fields TABLE 203 L2_ACL_DEVICE_DEPLOY_MAP Field Definition Format DEPLOYMENT_ID Deployment configuration ID. Foreign Key for DEPLOYMENT table. int L2_ACCESS_CONTROL_LIST_ID L2 Access control List ID for reference to the L2_ACCESS_CONTROL_LIST. Foreign Key for L2_ACCESS_CONTROL_LIST table. int TABLE 204 L2_ACL_INTERFACE_DEPLOY_MAP Field Definition Format ID Unique generated database identifier. serial DEPLOYMENT_ID Deployment configuration ID.
I Database tables and fields TABLE 206 L3_ACL_DEVICE_DEPLOYMENT_MAP Field Definition Format DEPLOYMENT_ID Deployment configuration ID. int L3_ACCESS_CONTROL_LIST_ID TABLE 207 int L3_ACL_INT_DEPLOYMENT_MAP Field Definition Format ID 2362 Size serial DEPLOYMENT_ID Deployment configuration ID. int INBOUND_L3_ACL_ID L3 Access control List ID of the L3 ACL selected for inbound. int INBOUND_WRITE_TO_DEVICE 1/0 corresponding to Write to device/not write to device for inbound traffic.
I Database tables and fields TABLE 208 LAG (Continued) Field Definition Format MTU Maximum transmission unit in bytes. range 1522..9208. int LOAD_BALANCE Load balancing details. varchar VLAG Specifies whether the lag is a vlag or not. smallint Field Definition Format ID DB ID of LAG member(port). int LAG_ID FK to owning LAG int NAME Member name varcha TYPE currently not used. The default value is 0. smallint MEMBER_MODE Dynamic Mode Active/passive. The default value is 0.
I Database tables and fields TABLE 211 Definition Format EMPTY_DIALOG_ALLOWED This field indicates whether the dialog can be launched even when there are no fabrics discovered. • 0 = Yes • 1= No int INTERNAL_MODE_DIALOG The DCFM main client is not visible when the dialog is launched in internal mode. This mode is used when launching from SMIA config tool.
I Database tables and fields TABLE 213 LICENSE_DOWNGRADE_DETAILS Field Definition Format Size ID Primary key ID. PREVIOUS_LICENSE_INFO Previous License information during downgrade. The details will have license type, license count like fabric, device, port etc. varchar 512 NEW_LICENSE_INFO New License information during downgrade. The details will have license type, license count like fabric, device, port etc. varchar 512 DOWNGRADE_TIME Time when License is downgraded.
I Database tables and fields TABLE 217 Field Definition Format LINK_ID Unique database generated identifier. int TYPE Type of the link. Currently it is always U. varchar 1 NAME Name of the link which is combination of device display name and ifName of the interface which this link associated. varchar 255 TABLE 218 Size LOCK Field Definition Format Size NAME The name of this transaction synchronization lock.
I Database tables and fields TABLE 221 LSAN_PROXY_DEVICE Field Definition Format FCR_FABRIC_ID* FID assigned to edge fabric int PROXY_PID* Proxy device PID char 6 STATE State of the device varchar 128 LSAN_DEVICE_ID* LSAN_DEVICE record reference int Field Definition Format ID* Unique generated database identifier. int BB_FABRIC_ID Backbone fabric DB ID. int EDGE_FABRIC_ID FID assigned to edge fabric. int NAME LSAN zone name.
I Database tables and fields TABLE 225 MCT_CLIENT Field Definition Format DEPLOY_STATE MCT Client deployment state: • Deployed(0) • Undeployed(1) smallint VCN_MEMBER_ID Virtual Cluster Node member Cluster id foreign key. int TABLE 226 MAC_FILTER Field Definition Format ID Size serial MAC_FILTER_NUMBER MAC Filter number. int FILTER_ACTION Defined Permit - 0 or Deny -1 smallint DESCRIPTION Description associated with each MAC Filter entry.
I Database tables and fields TABLE 228 MAC_FILTER_INT_DEPLOYMENT_MAP (Continued) Field Definition Format INBOUND_MAC_FILTER_ID MAC FILTER Id of the MAC Filter selected for inbound. Foreign Key for MAC_FILTER table. int INBOUND_WRITE_TO_DEVICE 1/0 corresponding to Write to device/not write to device for inbound traffic. smallint Field Definition Format ID Sequence number of the records int NAME Name of the mac group, for internal representation of the group.
I Database tables and fields TABLE 232 Field Definition Format ID The primary key of the table. int HOST_TIME The time at which the server processed the event. timestamp CATEGORY The violations category. i.e. Port Health, Fabric Health, etc. int VIOLATION_TYPE The type of the violation. i.e. CRC, ITW. int MANAGED_ELEMENT_ID The managed element corresponding to this event. int ORIGIN_FABRIC_ID The fabric from which the event originated. Retaining this id as historical data.
I Database tables and fields TABLE 233 MAPS_EVENT_DETAILS (Continued) Field Definition Format Size CURRENT_VALUE The current value of the measure that triggered the violation. varchar 32 SWITCH_ENABLED_ACTI ONS MAPS actions enabled on the switch at the time the violation occurred. int TABLE 234 MAPS_EVENT_CAUSE_ACTION Field Definition Format VIOLATION_TYPE The type of the violation. i.e. CRC, ITW, as defined in MapsConstants.
I Database tables and fields TABLE 237 Definition Format INDEX_TYPE Identifies the index type for a given SNMP MIB or Expression measure. Various index type supported are 0 - UNKNOWN, 1 - SCALAR, 2 - IF_INDEX, 3 - ETHER_STATS_INDEX, 4 - CONN_UNIT_INDEX, 5 FCIP_LINK_TABLE_INDEX, 6 - CUSTOM, 7 SW_TEMP_SENSOR_INDEX, 8 SW_FAN_SENSOR_INDEX, 9 SW_POWER_SENSOR_INDEX. For non-SNMP measures like EE Monitors, Ping statistics etc. index type is not applicable.
I Database tables and fields TABLE 239 MIGRATION_HISTORY Field Definition Format Size TARGET_RELEASE Target release name and version. Example Network Advisor 12.1.0. varchar 128 TARGET_RELEASE_BUILD_NUMB ER Target release build number. int MIGRATION_TIME Date and Time at which this migration completed. timestamp Field Definition Format MODULE_TYPE_ID Primary key for this table. int MODULE_TYPE Type of the module. NAME Name of the module configured in this device.
I Database tables and fields TABLE 240 Definition Format REDUNDANT_STATUS Specifies the redundant status of the module. Possible values are 1, 2, 3, 4, 5. 1 - other, 2 - active, 3 - standby, 4 - crashed, 5 - comingUp. Non management modules always return value as other. Management module returns the rest of the states. int OPERATIONAL_STATUS Specifies the operational status of the module.
I Database tables and fields TABLE 243 MPLS_ADMIN_GROUP_INTERFACE_RELATION Field Definition Format MPLS_ADMIN_GROUP_INTERFAC E_RELATION_DB_ID Unique database generated identifier. int MPLS_ADMIN_GROUP_DB_ID Database ID of the MPLS_ADMIN_GROUP instance. int INTERFACE_ID Database ID of the INTERFACE instance. int TABLE 244 Size MPLS_LSP Field Definition Format MPLS_LSP_DB_ID Unique database generated identifier.
I Database tables and fields TABLE 247 Field Definition Format MPLS_LSP_DB_ID Unique database generated identifier. int IS_ENABLED Represents whether the LSP is enabled. Enabled-1, Disabled-0. num (1,0) IS_BYPASS Represents if the LSP is a Bypass LSP or not. Not a Bypass-0, Bypass LSP-1. Currently ByPass LSPs are not supported. So the value will be always 0. num (1,0) FROM_IP_ADDRESS Represents the Source IP Address of the LSP.
Database tables and fields TABLE 248 MPLS_RSVP_LSP_ACTUALLY_ROUTED_HOP (Continued) Field Definition Format HOP_IP_ADDRESS The Tunnel Hop Address for this tunnel hop. int MPLS_LSP_DB_ID Database ID of the MPLS_RSVP_LSP instance which this hop is part of. int TABLE 249 Definition Format MPLS_RSVP_LSP_ADMIN_GROUP Unique database generated identifier. _DB_ID int AFFINITY_TYPE Represents the affinity type of the MPLS Admin Group.
I Database tables and fields TABLE 252 Field Definition Format MPLS_RSVP_LSP_PARAMETERS_D B_ID Unique database generated identifier. int IS_ADAPTIVE Indicates if the LSP supports adaptive mechanism or not. Non Adaptive-0, Adaptive-1. num BFD_TRANSMIT This object specifies the minimum interval, in milliseconds, that the local system would like to use when transmitting The Bidirectional Forwarding Detection(BFD) Control packets. Accepts a range of 50-30000.
I Database tables and fields TABLE 253 MPLS_RSVP_LSP_PATH (Continued) Field Definition Format Size IS_STANDBY Specifies whether the path is standby or not. Currently it is unused and value is always 0 (Not standby) num (1,0) MPLS_LSP_DB_ID Database ID of the MPLS_RSVP_LSP instance. int MPLS_PATH_DB_ID Database ID of the MPLS_PATH instance. int TABLE 254 MPLS_RSVP_LSP_TUNNEL_RESOURCE Field Definition Format MPLS_RSVP_LSP_TUNNEL_ Unique database generated identifier.
I Database tables and fields TABLE 256 Definition Format DEVICE_ID Database ID of the DEVICE instance. int TABLE_SUBTYPE Specifies the type of MPLS Service Relation with Device. Possible values are VLL_DEVICE_RELATION and VPLS_DEVICE_RELATION. varchar 32 NAME Name of the MPLS Service. varchar 255 COS This value indicates the Class Of Service for this endpoint (VLL/VPLS). Allowed range is 0-7 and 255. 255 means COS is not explicitly configured.
I Database tables and fields TABLE 258 MPLS_SERVICE_PEER_RELATION (Continued) Field Definition Format Size PEER_IP The IP of the Peer Device of the PW/PE maintenance protocol entity. varchar 255 OPER_STATUS Operational Status of the peer with the MPLS Service. Refer PwOperStatus MIB of foundry.mib for more details and possible values. smallint Field Definition Format MRP_RING_ID Auto generated database ID for MRP ring.
I Database tables and fields TABLE 260 Definition Format PRI_PORT_STATE State of device’s primary port. Other-1, Pre-Forwarding- 2, Forwarding-3, Blocking-4, Disabled-5. smallint PRI_PORT_TYPE Type of device’s primary port. Other-1, Regular port-2, Tunnel port-3. smallint PRI_PORT_ACTIVE_INTERFA CE_ID Interface database ID of an primary active port, which is sending RHPs. int SEC_PORT_INTERFACE_ID Interface database ID for the Secondary port of the device.
I Database tables and fields TABLE 263 NETWORK_SCOPE_TYPE Field Definition Format ID The primary key of the table. int NAME Name of the Scope. varchar 128 DESCRIPTION Description of the Scope. varchar 512 HANDLER_CLASS_NAME Fully defined Handler Class for the predefined SCOPE. varchar 128 Definition Format Size TABLE 264 Size NIC_PROFILE Field ID* int NAME The name of the network interface in the format network interface name / host address.
I Database tables and fields TABLE 266 Definition Format SRCDOMAIN Source domain ID int DSTDOMAIN Destination domain ID int LUNID Comma separate list of LUN IDs varchar 1024 OXID FC Originator Exchange ID for the frame. varchar 1024 QOS Quality of Service, can be comma separated values of: 1 - low, 2 - medium, 3 - high.
I Database tables and fields TABLE 267 NP_SUB_FLOW Field Definition Format DSTPORT Switch Destination port. smallint BIDIR This specifies if traffic in both direction has to be monitored, where, 0 - false, 1 - true SFID Source fabric ID. In case of FCR flow creation it will have FCR fabric Id in this field. In XISL it will have virtual fabric Id. For learning flow it will have *. varchar 12 DFID Destination fabric ID. In case of FCR flow creation it will have FCR fabric Id in this field.
I Database tables and fields TABLE 269 OUI_VENDOR (Continued) Field Definition Format Size VENDOR_CATEGORY Default is ‘none’. varchar 32 USER_MODIFIED TABLE 270 int PASSWORD_HISTORY Field Definition USER_NAME Size varchar 128 PASSWORD_UPDATED_ DATETIME The date and time the user updated password recently. timestamp PREVIOUS_PASSWORD User''s Previous password varchar 512 Size TABLE 271 PBR_INTERFACE_CONFIG Field Definition Format ID Primary key.
I Database tables and fields TABLE 273 PBR_NEXT_HOP Field Definition Format ID Primary key. int RULE_ID PBR rule id. int NEXT_HOP_SEQUENCE The sequence of the next hop entry that corresponds to a rule within a route map. The sequence of 1 indicates it is the first next hop to be tried for that rule. This is a running integer. int HOP_TYPE The Next hop type. 1 indicates INTERFACE, 2 indicates IP_ADDRESS, 3 indicates FLOOD VLAN.
I Database tables and fields TABLE 276 Definition Format ACL_MATCH_SEQUENCE The sequence of the matching acl entry that corresponds to a rule within a route map. The sequence of 1 indicates it is the first matching acl for that rule. This is a running integer. int ACL_NAME Name of the ACL for the rule. varchar ACL_TYPE Indicates the ACL type. Value of 4 denotes IPV4, Value of 6 denotes IPV6.
I Database tables and fields TABLE 278 PHYSICAL_DEVICE (Continued) Field Definition Format Size UNIT_NEIGHBOR1 Stacking neighbor's unit(left) number for the stackable devices. If there is no neighbor unit/non stackable devices, then set to 0. num (2,0) UNIT_NEIGHBOR2 Stacking neighbor's unit(left) number for the stackable devices . If there is no neighbor unit/non stackable devices, then set to 0. num (2,0) UNIT_PRESENT Used to identify the stack unit is present in the chassis or not.
I Database tables and fields TABLE 279 Definition Format IMAGE_VERSION Image version of the unit in the stack. For non-stacking device it will be always empty. varchar UNIT_ROLE Indicates unit role in the stack. Possible values: 1 other, 2 - active, 3 - standby, 4 - member, 5 standalone. For non-stacking device it will be always -1' int UNIT_PRIORITY Indicates unit priority. Possible values 0 to 255.
I Database tables and fields TABLE 282 PM_COLLECTOR_TARGET_SETTING (Continued) Field Definition Format ME_ID ME_ID of the target. int INDEX_MAP Stores the index_map value in case of an expression. varchar TABLE 283 Size 8192 PM_COLLECTOR_TIME_SERIES_MAPPING Field Definition Format COLLECTOR_ID DB ID of the pm_data_collector. int TARGET_NAME Time series data master table name. It could be either TIME_SERIES_DATA_1 or TIME_SERIES_DATA_2.
I Database tables and fields TABLE 284 Definition Format LEVEL3_ENABLED Enable / disable the third threshold check. This value is applicable only for Top N, Top Flow widgets. Default is 0. smallint LEVEL3_VALUE Limit value for the third percentage band. Default is 0. double precision LEVEL3_COLOR Limit value for the third percentage band. int LEVEL4_ENABLED Enable / disable the fourth threshold check. This value is applicable only for Top N, Top Flow widgets. Default is 0.
I Database tables and fields TABLE 285 PM_DATA_COLLECTOR (Continued) Field Definition Format STATUS Status of the collector. 0 - disabled and 1 - enabled. Default - 0. smallint TYPE Target type of the snmp collector data. for device smallint level collector the target type is 0, for port level it is 1. POLLING_INTERVAL Time interval in seconds; indicates the frequency with which the collector will poll the device to get the data. int CREATED_TIME Collector created time.
I Database tables and fields TABLE 287 Definition Format TWO_HOUR_SAMPLE_AGE The maximum time in seconds for retaining records in the PM stats 2hour sample tables (TIME_SERIES_DATA_1_2HOUR and TIME_SERIES_DATA_2_2HOUR) in database. int ONE_DAY_SAMPLE_AGE The maximum time in seconds for retaining records in the PM stats 1day sample tables (TIME_SERIES_DATA_1_1DAY, TIME_SERIES_DATA_2_1DAY) in database. int POLICY_TYPE Type of the aging policy. 100 is Default aging; 101 is Raw samples to 1 day.
I Database tables and fields TABLE 292 PM_WIDGET_TIME_SERIES_ENTRY (Continued) Field Definition Format TARGET_TYPE 0 - Device 1 - Port smallint TARGET_ID Stores device ID if taret_TYPE is Device, or interface DB ID if target TYPE is port. int MEASURE_ID Measure table DB ID. int MEASURE_INDEX Index value for a MIB variable. For scalar value it will be empty. varchar 256 Size TABLE 293 PM_WIDGET_TOP_N_COLLECTOR_ENTRY Field Definition Format WIDGET_ID The ID of the widget definition.
I Database tables and fields TABLE 295 Definition Format CONDITION Condition like ><= to the defined threshold value at which threshold is triggered • 0 > (Greater Than) • 1 >= (Greater Than or Equal) • 2 < (Less Than) • 3 < = (Less Than or Equal) • 4 = (Equal to) • 5 != (Not Equal To) smallint SEVERITY Severity level of defined threshold on port and product Poe measures. int TABLE 296 Size POE_THRESHOLD_EVENT Field Definition Format ID Unique generated database identifier.
I Database tables and fields TABLE 299 PORT_BOTTLENECK_CONFIG Field Definition Format SWITCH_PORT_ID The database ID of the switch port that the configuration belongs to. int BOTTLENECK_DETECT _ENABLED Flag indicates if bottleneck detection is enabled or not. The default value is 0. smallint ALERTS_ENABLED Flag indicates if bottleneck detection alerts is enabled or not.The default value is -1. smallint CONGESTION_ THRESHOLD Value of bottleneck detection congestion threshold in percent.
I Database tables and fields TABLE 301 Definition Format Size PASSWORD Password to be used for authenticating. Stored in encrypted format. varchar 512 STATUS Status before and after contacting the CIMOM Server. Possible values are 0 - OK, 1- Not Contacted Yet , 2 - Credentials Updated, 3 - Credentials Failed, 4 - Not Reachable. int LAST_CONTACTED_TIME Last time CIMOM server contacted.
I Database tables and fields TABLE 303 PORT_FENCING_POLICY_MAP (Continued) Field Definition Format Size SUB_LEVEL • • • char 23 NODE WWN of Node which policy assigned. char 23 Directly assigned or inherited from root level.
I Database tables and fields TABLE 305 Definition Format Size NAME Name of the port profile domain. varchar 255 DEFAULT_DOMAIN This flag determines if this domain is a default domain. 0 - NO 1 - YES smallint TABLE 306 PORT_PROFILE_DOMAIN_MAP Field Definition Format PROFILE_DOMAIN_ID Foreign Key Reference to ID field of PORT_PROFILE_DOMAIN table. int PROFILE_ID Foreign Key Reference to ID field of PORT_PROFILE table.
I Database tables and fields TABLE 309 PORT_PROFILE_QOS_MAP Field Definition Format Size TRAFFIC_CLASS Name of the traffic class map set in the NON DCB mode varchar 256 CEE_MAP Name of the cee map set in the DCB mode varchar 256 COS Default COS value for QoS Profile can range from 0-7 if set int TRUST_COS Is trust cos enabled 0=NO 1=YES smallint TABLE 310 PORT_PROFILE_QOS_PFC_MAP Field Definition Format ID Auto generated id for the created profile int PROFILE_ID DB id of the p
I Database tables and fields TABLE 311 Definition Format MAC_GROUP_DB_ID Nullable Foreign Key Reference to ID field of MAC_GROUP table. In case of VLAN_TYPE 3, MAC_GROUP table entry created with empty GROUP_ID with TYPE 3 and MAC_GROUP_MEMBER have the mac address details. In case of VLAN_TYPE 4, MAC_GROUP table entry created with valid GROUP_ID and TYPE(3). int CTAG_ID This will be populated only if VLAN_TYPE is 6 and 7.
I Database tables and fields TABLE 312 PORT_VLAN (Continued) Field Definition Format PRIMARY_VLAN_ID Private VLAN domain is built with one primary VLAN and one or more secondary VLANs. This column represents primary VLAN ID associated with this secondary Isolated/Community VLAN (if PVLAN_TYPE column value is 2 or 3) in private VLAN domain. For primary VLAN (if PVLAN_TYPE column value is 1) in private VLAN domain and normal VLAN (if PVLAN_TYPE column value is 0) , then default value (i.
I Database tables and fields TABLE 315 Field Definition Format VLAN_DB_ID Database ID of the VLAN instance which is associated with the protocol. int PROTOCOL Protocol for VLAN. Possible values are 1-IP, 2-IPX, 3-AppleTalk, 4-DECnet, 5-NetBIOS, 6-Other and 7-IPv6. num (4,0) TABLE 316 Size QRTZ_BLOB_TRIGGERS Field Definition Format Size TRIGGER_NAME* Name of the trigger. varchar 200 TRIGGER_GROUP* Name of the trigger group. varchar 200 BLOB_DATA The Scheduler info.
I Database tables and fields TABLE 319 QRTZ_FIRED_TRIGGERS (Continued) Field Definition Format size JOB_NAME Name of the job. varchar 200 JOB_GROUP Name of the job group. varchar 200 IS_STATEFUL Whether the job implements the interface StatefulJob. boolean REQUESTS_RECOVERY True or false. boolean SCHED_NAME DCMScheduler. bigint TABLE 320 QRTZ_JOB_DETAILS Field Definition Format Size JOB_NAME* Name of the job. varchar 200 JOB_GROUP* Name of the job group.
I Database tables and fields TABLE 323 QRTZ_PAUSED_TRIGGER_GRPS Field Definition Format Size TRIGGER_GROUP* Name of the trigger group. varchar 200 SCHED_NAME DCMScheduler. varchar 120 TABLE 324 QRTZ_SCHEDULER_STATE Field Definition Format Size INSTANCE_NAME* Instance of the scheduler. varchar 200 LAST_CHECKIN_TIME Last fired time in milliseconds. bigint CHECKIN_INTERVAL Repeat interval. bigint RECOVERER Misfire instruction. varchar 80 SCHED_NAME DCMScheduler.
I Database tables and fields TABLE 327 QRTZ_JTRIGGER_LISTENERS Field Definition Format Size TRIGGER_NAME* Name of the trigger. varchar 80 TRIGGER_GROUP* Name of the trigger group. varchar 80 TRIGGER_LISTENER* The listener action. varchar 80 TABLE 328 QRTZ_TRIGGERS Field Definition Format Size TRIGGER_NAME* Name of the trigger. varchar 200 TRIGGER_GROUP* Name of the trigger group. varchar 200 JOB_NAME Name of the job. varchar 200 JOB_GROUP Name of the job group.
I Database tables and fields TABLE 330 Definition Format ENCRYPTION_GROUP_ID Foreign key reference to the ENCRYPTION_GROUP for which an authorization card is registered. int SMART_CARD_ID Foreign key reference to the SMART_CARD that is registered as an authorization card for the encryption group. int TABLE 331 Size RAS_LOG Field Definition Format Size MSG_ID* Message ID of the event. varchar 15 MODULE_ID Module ID of the event. varchar 10 SEVERITY Severity of the event.
I Database tables and fields TABLE 335 REPORT_TEMPLATE Field Definition Format ID The primary key of the table. int NAME Name of the report and the report names must be descriptive. For example, Wired Device Report. varchar 256 TITLE The title of the report that briefly describes the report contents. This title will also be used for the report header and menu item. Title should be unique. For example, Wired Products List. varchar 256 CREATED_TIME Timestamp of when the report was created.
I Database tables and fields TABLE 338 Field Definition Format RESOURCE_GROUP_ID* Resource group ID. int FABRIC_ID* Fabric ID, which is in the resource group. int TABLE 339 Size RESOURCE_GROUP Field Definition Format ID* Unique generated database identifier. int NAME Resource group name. varchar 128 DESCRIPTION Resource group description.
I Database tables and fields TABLE 344 RULE_CONDITION_MAP Field Definition Format POLICY_RULE_ID Foreign key reference to POLICY_RULE.ID. int CONFIG_CONDITION_ID Foreign key reference to CONFIG_CONDITION.ID. int TABLE 345 RULE_LOGICAL_EXPRESSION_MAP Field Definition Format POLICY_RULE_ID Policy rule ID. int LOGICAL_EXPRESSION_XM L Configuration Rule Logical Expression XML. text TABLE 346 Size Size SAN Field Definition Format ID* Unique generated database identifier.
I Database tables and fields TABLE 347 SAN_CONNECTION (Continued) Field Format Size DESTINATION_USER_PORT_ User port number of F-port NUMBER smallint FABRIC_ID Foreign key to FABRIC table int TRUSTED Indicates if the connection is trusted smallint MISSING Indicates if the connection is missing smallint MISSING_TIME Timestamp when the connection went missing timestamp LAST_UPDATE_TIME Last update time for this record timestamp CREATION_TIME Creation timestamp timestamp Field Defin
I Database tables and fields TABLE 349 SECURITY_POLICY (Continued) Field Definition Format DIFFIE_HELLMAN_GROUP Diffie-Hellman Group used in PFS negotiation. smallint SECURITY_ASSOC_LIFE Association lifetime in seconds. double precision SECURITY_ASSOC_LIFE_ IN_MB Security association lifetime in megabytes. double precision TABLE 350 SELECTED_FLYOVER_PROPERTY Field Definition Format PROPERTY_ID* Refers to Flyover_Property ID from AVAILABLE_FLYOVER_PROPERTY table.
I Database tables and fields TABLE 351 Definition Format Size SERIAL_NUMBER provides the serial number of the sensor, requested by SMIA and values filled in by Switch Asset Collector will be available only from FOS 6.4 switches and above varchar 64 VERSION provides the version of the sensor, requested by SMIA and values filled in by Switch Asset Collector will be available only from FOS 6.
I Database tables and fields TABLE 353 SFLOW_HOUR_SUMMARY Field Definition Format OUT_UNIT Unit number of the outgoing traffic interface. Default value is 0. smallint OUT_SLOT Slot number of the outgoing traffic interface. smallint OUT_PORT Port number of the outgoing traffic interface. smallint IN_VLAN Vlan ID of the incoming traffic interface. smallint OUT_VLAN Vlan ID of the outgoing traffic interface. smallint IN_PRIORITY Priority ID of the incoming traffic interface.
I Database tables and fields TABLE 353 Definition Format BYTES Number of bytes transmitted through the sFlow sample collected. bigint TCP_FLAGS TCP flag value of the received sFlow packet. smallint IN_PORT_TYPE smallint This column is used to store the port type of the incoming traffic interface. For VCS switch the value of • 0 means its edge port. • 1 means its trill port. For other devices Default value is 0.
I Database tables and fields TABLE 355 SFLOW_MINUTE_BGP (Continued) Field Definition Format IN_PORT_TYPE Port type of the incoming traffic interface. For VCS member the value of, • 0 means its edge port. • 1 means its fabric port. For other devices Default value is 0. smallint OUT_PORT_TYPE Port type of the outgoing traffic interface. For VCS member the value of, • 0 means its edge port • 1 means its fabric port. For other devices Default value is 0.
I Database tables and fields TABLE 358 Definition Format OUT_PORT_TYPE Port type of the outgoing traffic interface. For VCS member the value of, • 0 means its edge port • 1 means its fabric port. For other devices Default value is 0 smallint L3_SRC_ADDR This column is used to store the L3 address of the source in the received sFlow packet. bytea L3_DEST_ADDR This column is used to store the L3 address of the destination in the received sFlow packet.
I Database tables and fields TABLE 361 SFLOW_MINUTE_VLAN (Continued) Field Definition Format BYTES Number of bytes transmitted through the sFlow sample collected. bigint IN_VLAN Vlan ID of the incoming traffic interface. smallint OUT_VLAN Vlan ID of the outgoing traffic interface. smallint IN_PORT_TYPE Port type of the incoming traffic interface. For VCS member the value of, • 0 means its edge port. • 1 means its fabric port. For other devices Default value is 0.
I Database tables and fields TABLE 365 2420 SFLOW_STAGING (Continued) Field Definition Format IN_UNIT Unit number of the incoming traffic interface. Default value is 0. smallint IN_SLOT Slot number of the incoming traffic interface. smallint IN_PORT Port number of the incoming traffic interface. smallint OUT_UNIT Unit number of the outgoing traffic interface. Default value is 0. smallint OUT_SLOT Slot number of the outgoing traffic interface.
I Database tables and fields TABLE 365 SFLOW_STAGING (Continued) Field Definition Format DEST_USER Name of the destination user in the received sFlow packet. int FRAMES Number of frames transmitted through the sflow sample collected. bigint BYTES Number of bytes transmitted through the sflow sample collected. bigint TCP_FLAGS Tcp flag value of the received sFlow packet. smallint IN_PORT_TYPE This column is used to store the port type of the incoming traffic interface.
I Database tables and fields TABLE 367 SMART_CARD (Continued) Field Definition Format Size GROUP_NAME The name of the Encryption Group used to initialize the card. For recovery set cards, this identifies which group''s master key is backed up on the card. varchar 64 CREATION_TIME The date and time that the card was initialized. For recovery set cards, this is the date and time the master key was written to the card. The default value is 'now()'.
I Database tables and fields TABLE 370 SNMP_CREDENTIALS (Continued) Field Definition Format TIMEOUT Timeout value in seconds for a get/set request to the SNMP agent. Default value is 5. smallint VERSION SNMP agent version running on the switch, as in SNMPv1 or SNMPv3. varchar 6 READ_COMMUNITY_ STRING The SNMP Read-Only Community String is like a password. It is sent along with each SNMP Get-Request and allows (or denies) access to a device. The default value is "public".
I Database tables and fields TABLE 371 SNMP_DATA (Continued) Field Definition Format Size TARGET_TYPE Target type of the SNMP collector data. The target type for, • device level collector is 0 • port level collector it is 1. num (2,0) TARGET_ID Target id of the SNMP collector data. for device level collector it will use deviceId, and for port level it will use interfaceId. int VALUE Value of the OID retrieved from the corresponding target.
I Database tables and fields TABLE 374 SNMP_DATA_30MIN Field Definition Format ID Primary key autogenerated ID int MIB_OBJECT_ID MIB OID used for collection int Target or source type can be, device - 0 or interface or ports - 1 num TARGET_ID DB Id of the target which can be device or interface int VALUE Value collected by the engine double precision TIME_IN_SECONDS Time at which collection occured in seconds int COLLECTOR_ID DB Id of the collector object used for collection int MI
I Database tables and fields TABLE 376 Definition Format TIME_IN_SECONDS Time, in seconds, at which the record was inserted in seconds. int COLLECTOR_ID DB ID of the collector object used for collection.
I Database tables and fields TABLE 379 SNMP_PROFILE (Continued) Field Definition Format Size VERSION SNMP agent version running on the switch as in SNMPv1 and SNMPv3 varchar 6 READ_COMMUNITY_STRING The SNMP Read-Only Community String is like a password. It is sent along with each SNMP Get-Request and allows (or denies) access to device. The default value is "public". This is applicable if the agent is configured to operate in SNMPv1.
I Database tables and fields TABLE 380 SNMP_TRAP_CREDENTIAL Field Definition Format ID PK for the table to uniquely identify the record int VERSION to identify the version of Credentials: v1v2c and v3 are the values varchar 6 COMMUNITY_STRING to decode the v1/v2c traps varchar 64 USER_NAME user access name for v3 trap varchar 64 AUTH_PROTOCOL authentication protocol used for v3 traps varchar 16 AUTH_PASSWORD authentication password for v3 traps varchar 64 PRIV_PROTOCOL privacy
I Database tables and fields TABLE 383 SSL_CERTIFICATE (Continued) Field Definition Format Size EXPIRATION_TIME num (20,0) FORMAT num (2,0) DESCRIPTION varchar 1024 NOTIFICATION_TIME The time stamp (long format) of the last expiration notification sent num (20,0) NOTIFICATION_SENT The status of last notification sent.
I Database tables and fields TABLE 385 Definition Format private_key Content of the private key. txt USER_ID This field will be populated when the Management application user creates certificate or import certificates from file. User can view this certificate not bound to any vip in SSL certificate dialog. int TABLE 386 Size SSL_KEY_PASSWORD Field Definition Format ID Unique generated database identifier.
I Database tables and fields TABLE 388 STP_PORT Field Definition Format INTERFACE_ID Foreign Key Reference to INTERFACE table int PATH_COST Port Path Cost. bigint PRIORITY Port Priority. bigint LINK_TYPE Link Type. 1- Shared 2 - P2P. numeric (1,0) PORT_FAST Port Fast. 0 - Disabled 1 - Enabled numeric (1,0) BPDU_FILTER BPDU Filter. 0 - Disabled 1 - Enabled numeric (1,0) BPDU_GUARD BPDU guard. 0 - Disabled 1 - Enabled numeric (1,0) EDGE_PORT Edge port.
I Database tables and fields TABLE 389 STP_INSTANCE (Continued) Field Definition Format RE_ENABLE_PORT_INTERV AL FOS/NOS Field. Re enable port interval. int RE_ENABLE_PORT_STATE FOS/NOS Field. Re enable port state. smallint PATH_COST 2432 bigint STP Possible values: • 0 - Disabled • 1 - Enabled smallint CISCO_INTER_OP Cisco Interoperability Enabled/Disabled. num TX_HOLD_COUNT Transmit HoldCount of the Bridge smallint MAX_HOPS MST max hop count (1-40) smallint REGION MST Region.
I Database tables and fields TABLE 391 SWITCH_CONFIG Field Definition ID* Format Size int NAME Name of the switch configurations uploaded from the switch either on demand or through scheduler varchar SWITCH_ID ID of the switch from which the configuration has been uploaded. int CORE_SWITCH_ID 64 int BACKUP_DATE_TIME The date/time stamp at which the configuration has been uploaded. timestamp CONFIG_DATA The actual switch configuration data.
I Database tables and fields TABLE 392 Definition Format BACKUP_TYPE The operation based on which this configuration was retrieved -1 - NOT AVAILABLE 0 - IMPORTED 1 - DISCOVERY 2 - RESYNC 3 - MANUAL 4 - SCHEDULE int DRIFT_STATUS Indicates if the current switch configuration has deviated from the baseline configuration. -1 - NO_BASELINE 0 - NO_DEVIATION 1 - DEVIATED int TABLE 393 Size SWITCH_LICENSE Field Definition Format ID* Unique generated database identifier.
I Database tables and fields TABLE 395 SWITCH_PORT Field Definition Format ID* Unique generated database identifier. int VIRTUAL_SWITCH_ID DB ID of virtual_switch to which this port belongs. int WWN WWN of the port. char 23 NAME User friendly name of the port. char 32 SLOT_NUMBER Slot number. Default value is 0. int PORT_NUMBER The logical port number of the user port. There is no assumption of any relation to the physical location of a port within a chassis.
I Database tables and fields TABLE 395 2436 SWITCH_PORT (Continued) Field Definition Format Size ESTIMATED_DISTANCE The estimated physical distance of the connection between ports. int ACTUAL_DISTANCE The physical distance of the connection on the port in relation to the other port. int LONG_DISTANCE_SETTING Whether long distance enabled. int DEGRADED_PORT Denotes if the port is in a degraded state. Has value as N/A for ports that are not online.
I Database tables and fields TABLE 395 SWITCH_PORT (Continued) Field Definition Format Size USER_DEFINED_VALUE2 User defined value used for annotation. varchar 256 USER_DEFINED_VALUE3 User defined value used for annotation. varchar 256 KIND Stores the port kind from the NVP portKind. varchar 32 STATE The state of the port whether it is online or offline varchar 64 PREVIOUS_STATUS This table can hold the same values as STATUS column.
I Database tables and fields TABLE 395 2438 SWITCH_PORT (Continued) Field Definition Format MAX_FRAME_MONITOR Maximum frame monitor supported for switch port. int MAX_FRAME_MONITOR_OF FSET Maximum offset supported in fame monitor for switch port. int Contains the features supported as a bit mask at port level. int IDENTIFIER Switch port identifier extracted from interface name char PORT_CAPABILITIES 'List of capabilities of this port specified as bit mask.
I Database tables and fields TABLE 395 SWITCH_PORT (Continued) Field Definition Format SPEED_TYPE Stores the speed type of the port. It contains one of the following values: • 1 - Indicates speed is in Mbps. • 2 - Indicates speed is in Gbps. int EXT_TYPE Refers to the extended type of the port . Eg Mirror-Port. varchar 128 Size TABLE 396 Size SWITCH_PORT_PERFORMANCE Field Definition Format PORT_ID Primary key of the Switch Port.
I Database tables and fields TABLE 396 Definition Format INVALID_TRANSMISSIONS Count of invalid transmission words received at this port. This count is part of the Link Error Status Block (LESB). FC-PH 29.8). Note, this is a Fibre Channel only stat double precision CRC_ERRORS Count of frames received with invalid CRC. This count is part of the Link Error Status Block (LESB). (FC-PH 29.8). Loop ports should not count CRC errors passing through when monitoring.
I Database tables and fields TABLE 400 TARGET_TYPE Field Definition Format ID Unique generated database identifier. serial TYPE Type of the target device. Some possible values are • Switch • Device • Port • Host • Port Group • Product Group • VLAN • Fabric varchar 64 Size TABLE 401 Size THIRD_PARTY_DEVICE Field Definition Format DEVICE_ID Primary key for this table. int DEVICE_TYPE Type of the third party device.
I Database tables and fields TABLE 404 Definition Format MEASURE_ID ID of the measure. int TARGET_ID Target ID of the PM collector data. For device level collector it will use deviceId, for port level it will use interfaceId. int COLLECTOR_ID ID of the data_collector. int MEASURE_INDEX 'Stores the index_map value in case of anexpression. varchar ME_ID ME_ID of the target. int VALUE 30 mins aggregated data.
I Database tables and fields TABLE 407 \ TIME_SERIES_DATA_30MIN Field Definition Format TIME_IN_SECONDS Time when the record is inserted. int TARGET_TYPE Target type of the PM collector data. For device level collector the target type is 0, for port level it is 1. smallint MEASURE_ID ID of the measure. int TARGET_ID Target ID of the PM collector data. For device level collector it will use deviceId, for port level it will use interfaceId. int COLLECTOR_ID ID of the data_collector.
I Database tables and fields TABLE 409 Field Definition Format TIME_IN_SECONDS Time when value of the measure retrieved from the corresponding target. int TARGET_TYPE Target type of the PM collector data. For IP_DEVICE(0), IP_PORT(1), IP_TRUNK(2), FOS_DEVICE(3), FC_PORT(4), GE_PORT(5), TE_PORT(6), HBA_PORT(7), CNA_PORT(8), VIRTUAL_FCOE_PORT(9), FCIP_TUNNEL(10), EE_MONITOR(11), IP_DEVICE_GROUP(12), IP_PORT_GROUP(13), VIRTUAL_GROUP(14), TRILL_TRUNK(15), ALL_SAN_PRODUCTS(16).
I Database tables and fields TABLE 410 TIME_SERIES_DATA_1_2HOUR (Continued) Field Definition Format VALUE Stores the 2 hours aggregated data. double precision MIN_VALUE Minimum value in 30 min table while aggregating 2 hours of data. double precision MAX_VALUE Maximum value in 30 min table while aggregating 2 hours of data. double precision TABLE 411 TIME_SERIES_DATA_1_30MIN Field Definition Format TIME_IN_SECONDS Time when value of the measure retrieved from the corresponding target.
I Database tables and fields TABLE 412 Definition Format MEASURE_ID ID of the measure (MIB/Expression). int TARGET_ID Target ID of the PM collector data. For device level collector it will use deviceId/virtualSwitchId, for port level it will use interfaceId/switchPortId/ fcipTunnelId/devicePortId. int COLLECTOR_ID DB ID of the pm_data_collector. int MEASURE_INDEX Stores the index_map value in case of an expression. varchar ME_ID ME_ID of the target.
I Database tables and fields TABLE 414 TIME_SERIES_DATA_2_2HOUR Field Definition Format TIME_IN_SECONDS Time when value of the measure retrieved from the corresponding target. int TARGET_TYPE Target type of the PM collector data.
I Database tables and fields TABLE 415 Definition Format VALUE Stores the 30 minutes aggregated data. double precision MIN_VALUE Minimum value in raw performance statistics table while aggregating 30 minutes of data. double precision MAX_VALUE Maximum value in raw performance statistics table while aggregating 30 minutes of data.
I Database tables and fields TABLE 417 TIME_SERIES_DATA_3_1DAY (Continued) Field Definition Format MIN_VALUE Minimum value in 2 hour table while aggregating 1 day data. double precision MAX_VALUE Maximum value in 2 hour table while aggregating 1 day data. double precision SUM_VALUE Named after SUM_VALUE to be consistent with column names in aggregated data tables.Stores the delta changes for counter values between two samples, only used for counter values, 0 for all other types of measures.
I Database tables and fields TABLE 419 Definition Format TARGET_ID Target ID of the PM collector data. For device level collector it will use deviceId/virtualSwitchId, for port level it will use interfaceId/switchPortId/ fcipTunnelId/devicePortId. int COLLECTOR_ID DB ID of the pm_data_collector. int MEASURE_INDEX Stores the index_map value in case of an expression. varchar ME_ID ME_ID of the target. int VALUE Stores the 30 minutes aggregated data.
I Database tables and fields TABLE 421 TIME_SERIES_DATA_4_1DAY Field Definition Format TIME_IN_SECONDS Time when value of the measure retrieved from the corresponding target. int TARGET_TYPE Target type of the PM collector data. smallint MEASURE_ID ID of the measure (MIB/Expression). int TARGET_ID Target ID of the PM collector data. For device level collector it will use deviceId/virtualSwitchId, for port level it will use interfaceId/switchPortId/ fcipTunnelId/devicePortId.
I Database tables and fields TABLE 422 Definition Format MAX_VALUE Maximum value in 30 min table while aggregating 2 hours of data. double precision SUM_VALUE Named after SUM_VALUE to be consistent with column names in aggregated data tables.Stores the delta changes for counter values between two samples, only used for counter values, 0 for all other types of measures.
I Database tables and fields TABLE 424 TIME_SERIES_DATA_5 (Continued) Field Definition Format MEASURE_ID ID of the measure (MIB/Expression). int TARGET_ID Target ID of the PM collector data. For device level collector it will use deviceId/virtualSwitchId, for port level it will use interfaceId/switchPortId/ fcipTunnelId/devicePortId. int COLLECTOR_ID DB ID of the pm_data_collector. int MEASURE_INDEX Stores the index_map value in case of an expression. varchar ME_ID ME_ID of the target.
I Database tables and fields TABLE 426 Field Definition Format Size TOOL_MENU_TEXT* Text to be displayed for the Tool Menu. varchar 256 TOOL_ID A Tool in the TOOL_PATH table where the tools are defined. int PARAMETERS Default path for launching the tool. varchar 256 KEY_STROKE Short cut key stroke to the application. varchar 30 Field Definition Format Size ID* Unique generated database identifier. int TOOL_NAME Name of the tool.
I Database tables and fields TABLE 429 TRILL Field Definition Format TRUNKED Is this trill link part of a trunk smallint CREATION_TIME Time when the TRILL link record is created between source and destination. timestamp MISSING Is this trill link was discovered and is now missing smallint MISSING_TIME Time when the TRILL link is missing from the switch.
I Database tables and fields TABLE 434 USER_ Field Definition Format Size ID * Unique generated database identifier. int NAME User name. varchar 128 DESCRIPTION User description. varchar 512 PASSWORD User password. varchar 512 EMAIL User e-mail ID. varchar 1024 NOTIFICATION_ENABLED Flag for e-mail notification. Default value is 0. smallint FULL_NAME User’'s Full Name. varchar 512 PHONE_NUMBER User’'s Phone number.
I Database tables and fields TABLE 436 USER_DEFINED_DEVICE_DETAIL Field Definition Format Size WWN WWN of the device. char 23 NAME 'Name of the device which is updated by the user. varchar 256 TYPE Type of the device (Initiator or Target. varchar 32 IP_ADDRESS IP address of the device which is updated by the user. varchar 63 CONTACT Contact detail of the device which is updated by the user. varchar 256 LOCATION Location of the device which is updated by the user.
I Database tables and fields TABLE 439 Field Definition Format Size USER_NAME * User name whose preferences are saved. It corresponds to user_name in USER_table. varchar 128 CATEGORY * The name for a set of related preferences. varchar 128 CONTENT The set of preferences saved as name-value pairs. text TABLE 440 USER_REALTIME_MEASURE_MAPPING Field Definition Format ID Primary Key. int USER_ID Foreign key reference to the user_ Table.
I Database tables and fields TABLE 444 USER_STATE_MAP Field Definition USER_NAME STATE Current user state.
I Database tables and fields TABLE 447 VCN_MEMBER Field Definition Format Cluster deployment state: Deployed(0) Undeployed(1). smallint Device id foreign key. int Field Definition Format VCN_PEER_ID Virtual Cluster Node Peer db id. int IP_ADDRESS Peer ip address. varchar RBRIDGE_ID Peer rbridge id. int ICL_NAME Cluster ICL name used for this peer. varchar Cluster Peer fast failover state: Disabled(0) Enabled(1).
I Database tables and fields TABLE 449 VCS_CLUSTER_MEMBER (Continued) Field Definition Format Size STATE Indicates the state of the member with respect to cluster. States can be Online, Offline, Rejoining etc. varchar 64 FABRIC_STATUS Stores the fabric level status of the node like Unknown and Online. Status is unknown when: • A node is going through a reboot or ISLs have not formed yet. • A node is not part of a cluster yet. Status is Online when: • A node is waiting to rejoin a cluster.
I Database tables and fields TABLE 451 VIP_SERVER (Continued) Field Definition Format Size IP_ADDRESS The IP Address for the Virtual Server or Real Server varchar 128 NAME The Name of Virtual Server or Real Server varchar 256 TABLE 452 VIP_SERVER_BINDING Field Definition Format ID Primary Key field for the VIP_SERVER_BINDING int DEVICE_ID This is the foreign key reference key to the Device Table int The IP Address for the Virtual Server varchar The Port number of the Virtual Ser
I Database tables and fields TABLE 454 VIRTUAL_FCOE_PORT (Continued) Field Definition Format DEVICE_COUNT The number of devices associated with this Virtual FCoE Port. The default value is 0. smallint PEER_MAC The Peer FCF MAC if this Virtual FCoE Port is a FCoE VE-port varchar TABLE 455 Size VIRTUAL_FCOE_PORT_MAC_MEMBER Field Definition Format VIRTUAL_FCOE_PORT_ID The unique id of virtual fcoe port the member belongs to int MAC_ADDRESS Mac address of member.
I Database tables and fields TABLE 456 Definition Format INVALID_TX Invalid transmissions double precision CRC_ERRORS Cyclic Redundancy check error double precision TABLE 457 Size VIRTUAL_PORT_WWN_DETAILS Field Definition ID Unique generated database identifier. SWITCH_ID If the VPWWN is constructed based on AG Node WWN and AG_Port_Index then this is id of connected switch. int SWITCH_PORT_NUMBER If the VPWWN is configured for AG , this value will have the default value(-1).
I Database tables and fields TABLE 458 VIRTUAL_SWITCH (Continued) Field Definition Format Stores the switch mode. 0 is switch mode 2 is ag mode. smallint ROLE Stores the role of the switch like Primary, Subordinate, Cluster etc. varchar 32 FCS_ROLE FCS role for the Switch . This is used only when FCS policy is turned on. varchar 16 Stores the switch capability for Admin domain. 1 is capable 0 is not capable. smallint FABRIC_IDID_MODE Denotes if Insistent Domain ID mode is enabled.
I Database tables and fields TABLE 458 VIRTUAL_SWITCH (Continued) Field Definition Format Stores the switch capability for FCR support . 1 is capable 0 is not capable. smallint Stores the switch capability for FCIP support . 1 is capable 0 is not capable. smallint FCOE_CAPABLE If the switch supports FCoE. Default value is 0. smallint L2_CAPABLE If the switch supports L2. smallint L3_CAPABLE If the switch supports L3.
I Database tables and fields TABLE 458 VIRTUAL_SWITCH (Continued) Field Definition Format FCIP_CIRCUIT_CAPABLE Whether the switch can create FCIP Circuits. 1 means true and 0 means false. Default value is 0. smallint DISCOVERED_PORT_COUN T Reflects the number of managed ports in the discovered switch. Default value is 0. smallint LAST_PORT_MEMBERSHIP _CHANGE Stores the timestamp of the last port member ship update.
I Database tables and fields TABLE 458 2468 VIRTUAL_SWITCH (Continued) Field Definition Format CLUSTER_TYPE This column is used to determine whether VCS is in Fabric Cluster or Logical Chassis. The values are populated by the VCS collector during the discovery of the VCS switch. The default value -1 means that its a non-VCS device.
I Database tables and fields TABLE 459 VIRTUAL_SWITCH_CAPABILITY Field Definition Format VIRTUAL-SWITCH_ID * DB ID of virtual switch. int CAPABILITY_ * Name of capability detected on virtual switch. varchar ENABLED 1 = the capability is enabled on the virtual switch. int TABLE 460 Size 256 VIRTUAL_SWITCH_CHECKSUM Field Definition Format VIRTUAL_SWITCH_ID * DB ID of virtual switch. int CHECKSUM_KEY * Checksum key. varchar 32 CHECKSUM Checksum value.
I Database tables and fields TABLE 465 Field Definition Format VLAN_INTERFACE_RELATION_ID Database ID of the VLAN_INTERFACE_RELATION instance which is associated with the interface member. int TABLE 466 Definition Format VLAN_INTERFACE_RELATION_ID Unique database generated identifier. int VLAN_DB_ID Database ID of the VLAN instance which is associated with the interface. int INTERFACE_ID Database ID of the INTERFACE instance which is associated with the vlan.
I Database tables and fields TABLE 471 VLL_ENDPOINT_RELATION Field Definition Format MPLS_SERVICE_ENDPOINT_REL ATION_DB_ID Database ID inherited from MPLS_SERVICE_ENDPOINT_RELATION. int PW_ENET_PW_INSTANCE Represents the Index of Ethernet tables associated with this endpoint Instance. int COS This value indicates the Class Of Service for this smallint endpoint. For VLL, this value is used to select the appropriate tunnel whose COS value is either same, or almost approaching this value.
I Database tables and fields TABLE 472 Definition Format STATUS VMotion event status. 0 = info, 1 = warning, 2 = failed. smallint DRS_TRIGGERED Identifies whether the events was due to DRS. 0 = No, 1 = Yes. smallint USER_NAME Identifies that user who initiated the vmotion. varchar 80 DESCRIPTION Event message that is received.
I Database tables and fields TABLE 475 VM_DATASTORE_DETAILS Field Definition Format Size NAME Name of the datastore. varchar 256 ACCESSIBLE The connectivity status of this datastore. If this is set to false, meaning the datastore is not accessible, this datastores capacity and freespace properties cannot be validated. 0 = no 1 = yes. smallint STATUS Status of the datastore could be normal, enteringMaintenance, inMaintenance.
I Database tables and fields TABLE 476 Definition Format CONFLICT Whether the port is a conflict port. A port could be marked as conflict if an entity is discovered connecting to a port that is already occupied, or if the port is created by the host without conferring with Virtual Center Server. A conflict port will not have its runtime state persisted and the port can''t move away from the host, i.
I Database tables and fields TABLE 477 VM_DV_PORT_GROUP (Continued) Field Definition Format Size DESCRIPTION A description string of the portgroup varchar 256 UPLINK_PORT_GROUP Whether this portgroup is an uplink portgroup smallint KEY The key for the port group varchar MOR_ID The managed object reference number assigned by the hypervisor int TABLE 478 64 VM_DV_SWITCH Field Definition Format ID Unique generated database identifier. serial UUID The generated UUID of the switch.
I Database tables and fields TABLE 478 Definition Format DVS_OPER_SUPPORTED Whether this switch allow Virtual Center users to modify DVS configuration at switch level, except for host memeber, policy and scope operations smallint CREATION_TIME The create time of the switch timestamp UPLINK_PORT_NAME The uniform name of uplink ports on each host varchar VM_DATA_CENTER_ID A foreign key referencing VM_DATACENTER table instance to which this host is associated with int MOR_ID The managed objec
I Database tables and fields TABLE 480 VM_FC_HBA (Continued) Field Definition Format The type of the fiber channel port. One of : Fabric Loop Point to point Unknown smallint SPEED The current operating speed of the adapter in bits per second.
I Database tables and fields TABLE 482 VM_HOST (Continued) Field Definition Format Size CPU_TYPE Text summary of CPU hardware, such as: Intel(R) Xeon(TM) CPU 2.6 GHz varchar 64 CPU_RESOURCES Text summary of CPU resources, such as "20 GHz total, 15 GHz reserved". May be a different format for different VM vendors varchar 64 MEM_RESOURCES Text summary of memory resources, such as "7 GB total, 5 GB reserved".
I Database tables and fields TABLE 484 VM_HOST_PROXY_SWITCH (Continued) Field Definition Format Size DVS_NAME The name of the DistributedVirtualSwitch that the HostProxySwitch is part of varchar 256 DVS_UUID The uuid of the DistributedVirtualSwitch that the HostProxySwitch is a part of varchar 256 KEY_ The proxy switch key varchar 256 NUM_PORTS The number of ports that this switch currently has int NUM_PORTS_AVAILABL E The number of ports that are available on this virtual switch in
I Database tables and fields TABLE 486 Definition Format VM_DV_PORT_ID Foreign key to the vm_dv_port table. DV Port with which this vmknic is associated int MTU The MTU of the port int VM_HOST_ID FOREIGN KEY to the vm_host table int MOR_ID The managed object reference number assigned by the hypervisor int PORT_GROUP_KEY The key for the port group varchar BINARY_MAC MAC address in binary format. bytea BINARY_IP IP address in binary format.
I Database tables and fields TABLE 488 VM_NIC_TEAMING_POLICY (Continued) Field Definition Format REVERSE_POLICY The flag to indicate whether or not the teaming policy is applied to inbound frames as well. For example, if the policy is explicit failover, a broadcast request goes through uplink1 and comes back through uplink2. Then if the reverse policy is set, the frame is dropped when it is received from uplink2. This reverse policy is useful to prevent the virtual machine from getting reflections.
I Database tables and fields TABLE 489 Definition Format FABRIC_ID Identifies the fabric that contains this path. Not a foreign key reference. Copied here for convenience. Determined by locating the HBA port WWN or target port WWN in the DEVICE_PORT table. Zero if the fabric is not managed. The default value is 0. int HBA_PORT The HBAs physical port WWN for this path char 23 VM_PORT_WWN The initiator port WWN used by the VM.
I Database tables and fields TABLE 490 VM_PHYSICAL_NIC (Continued) Field Definition Format DUPLEX The flag to indicate whether or not the link is capable of full-duplex ("true") or only half-duplex ("false"). smallint MAC_ADDRESS The media access control (MAC) address of the physical network adapter. varchar 17 PCI Device hash of the PCI device corresponding to this physical network adapter. varchar 256 WAKE_ON_LAN_SUPPO RTED Flag indicating whether the NIC is wake-on-LAN capable.
I Database tables and fields TABLE 492 Field Definition Format ID Unique generated database identifier. serial NAME The name of the virtual switch. varchar PORTS_COUNT The number of ports that this virtual switch currently has. int PORTS_AVAILABLE The number of ports that are available on this virtual switch. int MTU The maximum transmission unit (MTU) associated with this virtual switch in bytes.
I Database tables and fields TABLE 494 VM_STD_VSWITCH_PORT_GROUP (Continued) Field Definition Format VM_STANDARD_VIRTUA L__SWITCH_ID Foreign Key to the vm_standard_virtual_switch table. The standard virtual swtich on which this port group exists. int MOR_ID The managed object reference number assigned by the hypervisor. int TABLE 495 Size VM_STORAGE Field Definition Format ID Uniquely identifies this LUN. serial HOST_ID Identifies the server that accesses this LUN.
I Database tables and fields TABLE 496 Field Definition Format VM_STORAGE_ID A foreign key referencing VM_STORAGE (ID). int HBA_REMOTE_PORT_ID A foreign key referencing HBA_REMOTE_PORT (ID). int TABLE 497 Size VM_TRAFFIC_SHAPING_POLICY Field Definition Format ID Unique generated database identifier. serial ENABLED 'The flag to indicate whether or not traffic shaper is enabled on the port.
I Database tables and fields TABLE 498 VM_VCENTER (Continued) Field Definition Format Size MANAGED_ELEMENT_ID A foreign key referencing MANAGED_ELEMENT(ID). int FAULT_MONITORING_ST ATE Flag to indicate whether fault monitoring is registered or not for a VM Host. Possible values are: 1.Not registered 2.Registered (Default) smallint NAME The name of the VCenter. varchar 64 UUID Unique identifier for vCenter server instance.
I Database tables and fields TABLE 500 2488 VM_VIRTUAL_ETHERNET_ADAPTER (Continued) Field Definition Format ADDRESS_TYPE MAC address type. Valid values for address type are: • Manual • Statically assigned MAC address. • Generated • Automatically generated MAC address. • Assigned • MAC address assigned by VirtualCenter. smallint MAC_ADDRESS MAC address assigned to the virtual network adapter. Clients can set this property to any of the allowed address types.
I Database tables and fields TABLE 501 VM_VIRTUAL_MACHINE Field Definition Format ID Uniquely identifies the virtual machine serial HOST_ID Identifies the server that contains this VM int HYPERVISOR_VM_ID The VM number assigned by the hypervisor. Some hypervisors identify VMs by number as well as by name int NAME User-assigned name for the VM varchar 80 DESCRIPTION Optional user-entered notes describing the VM. (Annotation in VMware terminology.
I Database tables and fields TABLE 501 Definition Format Size UNCOMMITTED_STORA GE Additional Provisioned storage for a particular virtual machine. varchar 64 UNSHARED_STORAGE Exclusive storage for a particular virtual machine. varchar 64 Size TABLE 502 VM_VIRTUAL_MACHINE_DATASTORE_MAP Field Definition Format VM_DATASTORE_DETAIL S_ID A foreign key referencing VM_DATASTORE_DETAILS(ID). int VIRTUAL_MACHINE_ID A foreign key referencing VM_VIRTUAL_MACHINE(ID).
Database tables and fields TABLE 505 I VR_CONN_DOMAIN Field Definition Format ID Unique generated database identifier. serial VCEM_PROFILE_ID Foreign key references the ID of the VCEM server that the domain belongs to. int VR_CONN_DOMAIN_GROUP_I D Nullable foreign key references the ID of the domain group that the domain may belong to. int VCEM_ASSIGNED_ID The ID assigned by the VCEM server.
I Database tables and fields TABLE 508 VR_CONN_MODULE Field Definition Format ID Unique generated database identifier. serial VR_CONN_DOMAIN_ID Foreign key references the domain ID that the module belongs to. int VCEM_ASSIGNED_ID The ID assigned by VCEM. varchar 256 WWN The WWN of the module. char 23 PRODUCT_NAME The product name of the module. varchar 256 SERIAL_NUMBER The serial number of the module. varchar 32 STATUS The current status of the module.
I Database tables and fields TABLE 510 VR_CONN_SERVER_PROFILE Field Definition Format ID Unique generated database identifier. serial VCEM_PROFILE_ID Foreign key references the ID of the VCEM server that the server profile belongs to. int VR_CONN_DOMAIN_GROUP_I D Nullable foreign key references the ID of the domain group that the server profile may belong to. int VCEM_ASSIGNED_ID The ID assigned by the VCEM server.
I Database tables and fields TABLE 512 Definition Format Size RF_DOMAIN_NAME RF domain name set for the AP. varchar 64 TIME_ZONE Time zone set for the AP. varchar 80 COUNTRY Country set for the AP. varchar 32 VLAN_FOR_CONTROL_TRAFFI C VLAN for control traffic set for the AP. varchar 512 CLIENT_COUNT Number of wireless clients or stations that connected or associated to the AP. int TABLE 513 WIRELESS_PRODUCT_RELATION Field Definition Format ID The primary key of the table.
I Database tables and fields TABLE 516 ZONE_ALIAS Field Definition Format ID* Unique generated database identifier. int ZONE_DB_ID PK of the owning ZONE_DB. int NAME The zone alias name. varchar 64 Size TABLE 517 Size ZONE_ALIAS_IN_ZONE Field Definition Format ZONE_ALIAS_ID* PK of the zone alias. int ZONE_ID* PK of the zone. int 23 Size TABLE 518 ZONE_ALIAS_MEMBER Field Definition Format ID* Unique generated database identifier.
I Database tables and fields TABLE 520 ZONE_DB_CONFIG Field Definition Format ID Unique generated database identifier. int ZONE_DB_ID PK of the owning zone DB int DEFINED_CONTENT Defined zone raw config string, wrapped with $ to prevent special char trimming text ACTIVE_CONTENT Active zone raw config string text TI_ZONE_CONTENT TI zone raw config string text TABLE 521 ZONE_DB_CONTENT Field Definition Format ID* PK of the owning offline zone DB.
I Views TABLE 525 ZONE_SET Field Definition Format ID* Unique generated database identifier. int ZONE_DB_ID PK of owning zone DB. int NAME Zone set name. varchar ACTIVE 1 = active zone set 0 = otherwise. smallint Size 64 Views ADAPTER_PORT_CONFIG_INFO create or replace view ADAPTER_PORT_CONFIG_INFO as select ADAPTER_PORT_CONFIG.ID, ADAPTER_PORT_CONFIG.NAME as CONFIG_NAME, ADAPTER_PORT_CONFIG.TYPE as TYPE, ADAPTER_PORT_CONFIG_PROPERTY.NAME as PROPERTY_NAME, ADAPTER_PORT_CONFIG_DETAILS.
I Views BIRTREPORT_SCHEDULE_INFO CREATE OR REPLACE VIEW birtreport_schedule_info AS SELECT birtreport_schedule_config.id AS schedule_id, birtreport_schedule_config.name AS schedule_name, birtreport_schedule_config.report_store_location, birtreport_schedule_config.overwrite, birtreport_schedule_config.format_type, birtreport_schedule_config.created_by AS birtreport_schedule_config_created_by, birtreport_schedule_config.email_delivery, birtreport_schedule_config.folder_delivery, birtreport_schedule_config.
Views I deployment_status.deployment_configuration_id AND deployment_status.deployment_time = (SELECT max(deployment_status.deployment_time) FROM deployment_status WHERE deployment_status.deployment_configuration_id = deployment_configuration.id) LEFT JOIN schedule_entry ON schedule_entry.identity::text = deployment_configuration.id::character varying(16)::text AND schedule_entry.
I Views left outer join CNA_ETH_PORT_CONFIG on CNA_PORT.ID = CNA_ETH_PORT_CONFIG.CNA_PORT_ID; CNA_PORT_DETAILS_INFO create or replace view CNA_PORT_DETAILS_INFO as select CNA_PORT.ID, CNA_PORT.PORT_NUMBER, CNA_PORT.PORT_WWN, CNA_PORT.NODE_WWN, CNA_PORT.PHYSICAL_PORT_TYPE, CNA_PORT.NAME, CNA_PORT.MAC_ADDRESS, CNA_PORT.MEDIA, CNA_PORT.CEE_STATE, CNA_PORT.HBA_ID, CNA_PORT.CREATION_TIME as CNA_PORT_CREATION_TIME, CNA_ETH_PORT.ID as ETH_PORT_ID, CNA_ETH_PORT.ETH_DEV, CNA_ETH_PORT.ETH_LOG_LEVEL, CNA_ETH_PORT.
Views I CNA_ETH_PORT.IOC_ID, CNA_ETH_PORT.HARDWARE_PATH, CNA_ETH_PORT.STATUS, CNA_ETH_PORT.CREATION_TIME as ETH_PORT_CREATION_TIME, HBA_PORT.DEVICE_PORT_ID, CNA_ETH_PORT.MTU, CNA_PORT.ALARM_WARNING from CNA_PORT left outer join HBA_PORT on CNA_PORT.ID = HBA_PORT.CNA_PORT_ID left outer join CNA_ETH_PORT on CNA_PORT.ID = CNA_ETH_PORT.CNA_PORT_ID; CORE_SWITCH_DETAILS_INFO create or replace view CORE_SWITCH_DETAILS_INFO as select CORE_SWITCH.ID, CORE_SWITCH.IP_ADDRESS, CORE_SWITCH.WWN, CORE_SWITCH.
I Views CORE_SWITCH_DETAILS.ACT_CP_SEC_FW_VERSION, CORE_SWITCH_DETAILS.STBY_CP_PRI_FW_VERSION, CORE_SWITCH_DETAILS.STBY_CP_SEC_FW_VERSION, CORE_SWITCH_DETAILS.EGM_CAPABLE, CORE_SWITCH_DETAILS.SUB_TYPE, CORE_SWITCH_DETAILS.PARTITION, CORE_SWITCH_DETAILS.MAX_NUM_OF_BLADES, CORE_SWITCH_DETAILS.VENDOR_VERSION, CORE_SWITCH_DETAILS.VENDOR_PART_NUMBER, CORE_SWITCH_DETAILS.RNID_SEQUENCE_NUMBER, CORE_SWITCH_DETAILS.CONTACT, CORE_SWITCH_DETAILS.LOCATION, CORE_SWITCH_DETAILS.DESCRIPTION, CORE_SWITCH_DETAILS.
Views I LUN.TIME_LEFT_FOR_AUTO_REKEY, CRYPTO_HOST.HOST_PORT_WWN, CRYPTO_HOST.HOST_NODE_WWN LUN.THIN_PROVISION_LUN from CRYPTO_LUN LUN, CRYPTO_HOST where LUN.CRYPTO_HOST_ID = CRYPTO_HOST.ID; CRYPTO_TARGET_ENGINE_INFO create or replace view CRYPTO_TARGET_ENGINE_INFO as select CRYPTO_TARGET_CONTAINER.ID TARGET_CONTAINER_ID, CRYPTO_TARGET_CONTAINER.NAME, CRYPTO_TARGET_CONTAINER.VT_NODE_WWN, CRYPTO_TARGET_CONTAINER.VT_PORT_WWN, CRYPTO_TARGET_CONTAINER.FAILOVER_STATUS, CRYPTO_TARGET_CONTAINER.
I Views DASHBOARD_CANVAS_PREFERENCE.DASHBOARD_CANVAS_ID, DASHBOARD_CANVAS_PREFERENCE.VISIBLE, DASHBOARD_CANVAS_PREFERENCE.TIME_SCOPE, DASHBOARD_CANVAS_PREFERENCE.USER_ID from DASHBOARD, DASHBOARD_CANVAS, DASHBOARD_CANVAS_PREFERENCE where DASHBOARD.ID = DASHBOARD_CANVAS_PREFERENCE.DASHBOARD_ID and DASHBOARD_CANVAS.ID = DASHBOARD_CANVAS_PREFERENCE.DASHBOARD_CANVAS_ID; DEPLOYMENT_INFO create or replace view DEPLOYMENT_INFO as select DEPLOYMENT_CONFIGURATION.ID as ID, DEPLOYMENT_CONFIGURATION.
I Views DEPLOYMENT_LOG create or replace view DEPLOYMENT_LOG as select DEPLOYMENT_CONFIGURATION.ID, DEPLOYMENT_CONFIGURATION.NAME, DEPLOYMENT_CONFIGURATION.DESCRIPTION, DEPLOYMENT_HANDLER.MODULE, DEPLOYMENT_HANDLER.SUB_MODULE, DEPLOYMENT_STATUS.DEPLOYMENT_TIME, DEPLOYMENT_CONFIGURATION.DEPLOY_OPTION as DEPLOYMENT_OPTION, DEPLOYMENT_STATUS.STATUS, DEPLOYMENT_STATUS.DEPLOYED_BY, DEPLOYMENT_CONFIGURATION.CREATED_BY as CREATOR, DEPLOYMENT_CONFIGURATION.SCHEDULE_ENABLED, DEPLOYMENT_CONFIGURATION.
I Views left join SWITCH_PORT SWPORT on DEVICE_CONNECTION.SWITCH_PORT_ID = SWPORT.ID left join SWITCH_PORT AGPORT on DEVICE_CONNECTION.AG_PORT_ID = AGPORT.ID left join HBA_PORT_DEVICE_PORT_MAP on DEVICE_PORT.ID = HBA_PORT_DEVICE_PORT_MAP.DEVICE_PORT_ID left join HBA_PORT on HBA_PORT_DEVICE_PORT_MAP.HBA_PORT_ID = HBA_PORT.DEVICE_PORT_ID left join HBA on HBA_PORT.HBA_ID = HBA.ID left join VM_FC_HBA_DEVICE_PORT_MAP ON VM_FC_HBA_DEVICE_PORT_MAP.DEVICE_PORT_ID = DEVICE_PORT.ID left join VM_FC_HBA ON VM_FC_HBA.
Views I timestamp with time zone 'epoch' + TIME_IN_SECONDS * interval '1 second' as CREATION_TIME, sum(case when MEASURE_ID = 208 then value else 0 end) as TX_UTILIZATION, sum(case when MEASURE_ID = 209 then value else 0 end) as RX_UTILIZATION, sum(case when MEASURE_ID = 210 then value else 0 end) as CRC_ERRORS from TIME_SERIES_DATA_1_2HOUR, VIRTUAL_SWITCH where ME_ID = MANAGED_ELEMENT_ID and COLLECTOR_ID = 16 group by ME_ID, TARGET_TYPE, TARGET_ID, TIME_IN_SECONDS,VIRTUAL_SWITCH_ID order by TIME_IN_SECON
I Views TE_PORT_STATS_30MIN_INFO create or replace view TE_PORT_STATS_30MIN_INFO as select VIRTUAL_SWITCH.
Views I ME_ID, TARGET_ID as PORT_ID, timestamp with time zone 'epoch' + TIME_IN_SECONDS * interval '1 second' as CREATION_TIME, sum(case when MEASURE_ID = 193 then value else 0 end) as RECEIVE_OK_PERCENT_UTIL, sum(case when MEASURE_ID = 194 then value else 0 end) as TRANSMIT_OK_PERCENT_UTIL, sum(case when MEASURE_ID = 196 then value else 0 end) as RECEIVE_OK, sum(case when MEASURE_ID = 195 then value else 0 end) as TRANSMIT_OK, sum(case when MEASURE_ID = 36 then value else 0 end) as RECEIVE_EOF, sum(case
I Views VIRTUAL_SWITCH.FCS_ROLE, VIRTUAL_SWITCH.DOMAIN_ID, VIRTUAL_SWITCH.VIRTUAL_FABRIC_ID, VIRTUAL_SWITCH.BASE_SWITCH, VIRTUAL_SWITCH.MAX_ZONE_CONFIG_SIZE, VIRTUAL_SWITCH.CREATION_TIME, VIRTUAL_SWITCH.LAST_UPDATE_TIME, VIRTUAL_SWITCH.USER_NAME, VIRTUAL_SWITCH.PASSWORD, VIRTUAL_SWITCH.MANAGEMENT_STATE, VIRTUAL_SWITCH.STATE, VIRTUAL_SWITCH.STATUS, VIRTUAL_SWITCH.STATUS_REASON, VIRTUAL_SWITCH.FABRIC_IDID_MODE, VIRTUAL_SWITCH.LOGICAL_ID, VIRTUAL_SWITCH.USER_DEFINED_VALUE_1, VIRTUAL_SWITCH.
I Views VIRTUAL_SWITCH.PROTOCOL, FABRIC_MEMBER.FABRIC_ID, FABRIC_MEMBER.TRUSTED, FABRIC_MEMBER.MISSING, FABRIC_MEMBER.MISSING_TIME, FABRIC.MANAGED as FABRIC_MANAGED, FABRIC.PRINCIPAL_SWITCH_WWN, FABRIC.SEED_SWITCH_WWN, FABRIC.TYPE as FABRIC_TYPE from CORE_SWITCH, VIRTUAL_SWITCH, FABRIC_MEMBER, FABRIC where VIRTUAL_SWITCH.CORE_SWITCH_ID = CORE_SWITCH.ID and FABRIC_MEMBER.VIRTUAL_SWITCH_ID = VIRTUAL_SWITCH.ID and FABRIC_MEMBER.FABRIC_ID = FABRIC.
I Views virtual_switch.fcip_circuit_capable, virtual_switch.max_fcip_tunnels, virtual_switch.max_fcip_circuits, virtual_switch.fcip_licensed, virtual_switch.addressing_mode, virtual_switch.previous_state, virtual_switch.managed_element_id, virtual_switch.hif_enabled, virtual_switch.auto_snmp, virtual_switch.rnid_sequence_number, virtual_switch.vcs_id, virtual_switch.cluster_type, virtual_switch.cluster_mode, virtual_switch.rnid_tag, virtual_switch.switch_id, virtual_switch.monitored, virtual_switch.
Views I varying, 'EX-Port'::character varying, 'FL-Port'::character varying, 'SIM-Port'::character varying, 'N-Port'::character varying]::text[]))OR switch_port.type like'LB-Port%') AND switch_port.occupied = 1 ) AS occupied_switch_port_count, ( SELECT count(switch_port.id) AS count FROM switch_port WHERE switch_port.virtual_switch_id = virtual_switch.id AND switch_port.licensed = 1 AND ((switch_port.
I Views DEVICE_PORT.COS, DEVICE_PORT.NPV_PHYSICAL, SWITCH_PORT.ID as SWITCH_PORT_ID, SWITCH_PORT.WWN as SWITCH_PORT_WWN, SWITCH_PORT.NAME as SWITCH_PORT_NAME, SWITCH_PORT.SLOT_NUMBER, SWITCH_PORT.PORT_NUMBER, SWITCH_PORT.PORT_INDEX, SWITCH_PORT.TYPE as SWITCH_PORT_TYPE, SWITCH_PORT.FULL_TYPE as SWITCH_PORTFULL_TYPE, SWITCH_PORT.EXT_TYPE as SWITCH_PORT_EXT_TYPE, SWITCH_PORT.STATUS as SWITCH_PORT_STATUS, SWITCH_PORT.HEALTH as SWITCH_PORT_HEALTH, SWITCH_PORT.SPEED, SWITCH_PORT.MAX_PORT_SPEED, SWITCH_PORT.
Views I AG_N_PORT.REMOTE_PORT_WWN as EDGE_SWITCH_PORT_WWN, AG_N_PORT.WWN as AG_N_PORT_WWN, AG_F_PORT.WWN as AG_F_PORT_WWN, AG_F_PORT.REMOTE_NODE_WWN, AG_F_PORT.REMOTE_PORT_WWN as DEVICE_PORT_WWN from N2F_PORT_MAP, SWITCH_PORT AG_N_PORT, SWITCH_PORT AG_F_PORT, VIRTUAL_SWITCH AG_SWITCH where N2F_PORT_MAP.VIRTUAL_SWITCH_ID = AG_N_PORT.VIRTUAL_SWITCH_ID and N2F_PORT_MAP.N_PORT = AG_N_PORT.USER_PORT_NUMBER and N2F_PORT_MAP.VIRTUAL_SWITCH_ID = AG_F_PORT.VIRTUAL_SWITCH_ID and N2F_PORT_MAP.F_PORT = AG_F_PORT.
I Views on DEVICE_NODE.WWN = USER_DEFINED_DEVICE_DETAIL.WWN left outer join FABRIC on DEVICE_NODE.FABRIC_ID = FABRIC.ID left outer join DEVICE_FDMI_DETAILS on DEVICE_NODE.ID = DEVICE_FDMI_DETAILS.DEVICE_NODE_ID; DEVICE_PORT_INFO CREATE VIEW device_port_info AS select DEVICE_PORT.ID, DEVICE_PORT.NODE_ID, DEVICE_PORT.DOMAIN_ID, DEVICE_PORT.WWN, DEVICE_PORT.SWITCH_PORT_WWN, DEVICE_PORT.NUMBER, DEVICE_PORT.PORT_ID, DEVICE_PORT.TYPE, DEVICE_PORT.SYMBOLIC_NAME, DEVICE_PORT.FC4_TYPE, DEVICE_PORT.
Views I coalesce(VS1.MONITORED, VS2.MONITORED) as MONITORED, FABRIC.PRINCIPAL_SWITCH_WWN as PRINCIPAL_WWN, FABRIC.ID as FABRIC_ID from DEVICE_PORT left outer join USER_DEFINED_DEVICE_DETAIL on DEVICE_PORT.WWN = USER_DEFINED_DEVICE_DETAIL.WWN left outer join FICON_DEVICE_PORT on DEVICE_PORT.ID = FICON_DEVICE_PORT.DEVICE_PORT_ID left outer join DEVICE_NODE on DEVICE_PORT.NODE_ID = DEVICE_NODE.ID left outer join SWITCH_PORT on DEVICE_PORT.SWITCH_PORT_WWN = SWITCH_PORT.
I Views SP.NAME as SWITCH_PORT_NAME, SP.LOGICAL_PORT_WWN, SP.VIRTUAL_SWITCH_ID, CS.IP_ADDRESS as SWITCH_IP_ADDRESS, coalesce(USER_DEFINED_DEVICE_DETAIL.TYPE, DN.TYPE, ''::character varying) as USER_DEFINED_DEVICE_TYPE, USER_DEFINED_DEVICE_DETAIL.NAME as USER_DEFINED_NAME, USER_DEFINED_DEVICE_DETAIL.IP_ADDRESS as USER_DEFINED_IP_ADDRESS, USER_DEFINED_DEVICE_DETAIL.CONTACT, USER_DEFINED_DEVICE_DETAIL.LOCATION, USER_DEFINED_DEVICE_DETAIL.DESCRIPTION from DEVICE_PORT DP join DEVICE_NODE DN on DP.NODE_ID = DN.
Views I and DEVICE_PORT.NODE_ID = DEVICE_NODE.ID; ISL_CONNECTION_INFO create or replace view ISL_CONNECTION_INFO as select distinct ISL_CONNECTION.ID, ISL_CONNECTION.FABRIC_ID, ISL_CONNECTION.SOURCE_SWITCH_PORT_ID, ISL_CONNECTION.TARGET_SWITCH_PORT_ID, ISL_CONNECTION.COST, ISL_CONNECTION.TYPE, ISL_CONNECTION.TRUSTED, ISL_CONNECTION.MISSING, ISL_CONNECTION.MISSING_TIME, ISL_CONNECTION.CREATION_TIME, ISL_CONNECTION.TRUNKED, ISL_CONNECTION.MISSING_REASON, ISL_CONNECTION.MASTER_CONNECTION_ID, ISL_CONNECTION.
I Views SOURCE_VIRTUAL_SWITCH.ID as SOURCE_SWITCH_ID, SOURCE_VIRTUAL_SWITCH.NAME as SOURCE_SWITCH_NAME, SOURCE_VIRTUAL_SWITCH.WWN as SOURCE_SWITCH_WWN, SOURCE_VIRTUAL_SWITCH.CORE_SWITCH_ID as SOURCE_CORE_SWITCH_ID, SOURCE_VIRTUAL_SWITCH.BASE_SWITCH as SOURCE_BASE_SWITCH, SOURCE_VIRTUAL_SWITCH.MANAGEMENT_STATE as SOURCE_VIRTUAL_SWITCH_MANAGEMENT_STATE, SOURCE_VIRTUAL_SWITCH.MONITORED as SOURCE_VIRTUAL_SWITCH_MONITORED, SOURCE_SWITCH_PORT.ID as SOURCE_SWITCH_PORT_ID, SOURCE_SWITCH_PORT.
Views I ETHERNET_ISL.ID as ETHERNET_ISL_ID, ETHERNET_ISL.SOURCE_PORT_ID, ETHERNET_ISL.DEST_PORT_ID, ETHERNET_ISL.TRUSTED, ETHERNET_ISL.CREATION_TIME, ETHERNET_ISL.MISSING, ETHERNET_ISL.MISSING_TIME, SOURCE_SWITCH_PORT.VIRTUAL_SWITCH_ID as SOURCE_SWITCH_ID, SOURCE_SWITCH_PORT.USER_PORT_NUMBER as SOURCE_PORT_NUMBER, SOURCE_SWITCH_PORT.TYPE as SOURCE_PORT_TYPE, SOURCE_VIRTUAL_SWITCH.VIRTUAL_FABRIC_ID as SOURCE_VIRTUAL_FABRIC_ID, DEST_SWITCH_PORT.VIRTUAL_SWITCH_ID as DEST_SWITCH_ID, DEST_SWITCH_PORT.
I Views EVENT.PORT_GROUP_ID as PORT_GROUP_ID, EVENT.SPECIAL_EVENT, EVENT_ORIGIN.ID as ORIGIN, EVENT_CATEGORY.ID as EVENT_CATEGORY, EVENT_DESCRIPTION.DESCRIPTION as DESCRIPTION, EVENT_MODULE.ID as MODULE, EVENT_DETAILS.RAS_LOG_ID as RAS_LOG_ID, EVENT_DETAILS.PRODUCT_ADDRESS as PRODUCT_ADDRESS, EVENT_DETAILS.CONTRIBUTORS as CONTRIBUTORS, EVENT_DETAILS.NODE_WWN as NODE_WWN, EVENT_DETAILS.PORT_WWN as PORT_WWN, EVENT_DETAILS.OPERATIONAL_STATUS as OPERATIONAL_STATUS, EVENT_DETAILS.
Views I EVENT_DETAILS.RAS_LOG_ID as RAS_LOG_ID, EVENT_DETAILS.PRODUCT_ADDRESS as PRODUCT_ADDRESS, EVENT_DETAILS.CONTRIBUTORS as CONTRIBUTORS, EVENT_DETAILS.NODE_WWN as NODE_WWN, EVENT_DETAILS.OPERATIONAL_STATUS as OPERATIONAL_STATUS, EVENT_DETAILS.FIRST_OCCURRENCE_SWITCH_TIME as FIRST_OCCURRENCE_SWITCH_TIME, EVENT_DETAILS.LAST_OCCURRENCE_SWITCH_TIME as LAST_OCCURRENCE_SWITCH_TIME, EVENT_DETAILS.VIRTUAL_FABRIC_ID as VIRTUAL_FABRIC_ID, EVENT_DETAILS.USER_NAME as USER_NAME, EVENT_DETAILS.
I Views FABRIC.SEED_SWITCH_WWN = VIRTUAL_SWITCH.WWN and VIRTUAL_SWITCH.CORE_SWITCH_ID = CORE_SWITCH.ID; FCIP_TUNNEL_CIRCUIT_INFO CREATE VIEW fcip_tunnel_circuit_info AS select FCIP_TUNNEL_CIRCUIT.ID, FCIP_TUNNEL_CIRCUIT.TUNNEL_ID, FCIP_TUNNEL_CIRCUIT.CIRCUIT_NUMBER, FCIP_TUNNEL_CIRCUIT.COMPRESSION_ENABLED, FCIP_TUNNEL_CIRCUIT.TURBO_WRITE_ENABLED, FCIP_TUNNEL_CIRCUIT.TAPE_ACCELERATION_ENABLED, FCIP_TUNNEL_CIRCUIT.IKE_POLICY_NUM, FCIP_TUNNEL_CIRCUIT.IPSEC_POLICY_NUM, FCIP_TUNNEL_CIRCUIT.
Views I left outer join GIGE_PORT on FCIP_CIRCUIT_PORT_MAP.SWITCH_PORT_ID = GIGE_PORT.ID left outer join SWITCH_PORT on GIGE_PORT.SWITCH_PORT_ID = SWITCH_PORT.ID; FCIP_TUNNEL_INFO create or replace view FCIP_TUNNEL_INFO as select FCIP_TUNNEL.ID, FCIP_TUNNEL.TUNNEL_ID, FCIP_TUNNEL.VLAN_TAG, FCIP_TUNNEL.SOURCE_IP, FCIP_TUNNEL.DEST_IP, FCIP_TUNNEL.LOCAL_WWN, FCIP_TUNNEL.REMOTE_WWN_RESTRICT, FCIP_TUNNEL.COMMUNICATION_RATE, FCIP_TUNNEL.MIN_RETRANSMIT_TIME, FCIP_TUNNEL.SELECTIVE_ACK_ENABLED, FCIP_TUNNEL.
I Views FCIP_TUNNEL.PRESHARED_KEY, FCIP_TUNNEL.QOS_HIGH, FCIP_TUNNEL.QOS_MEDIUM, FCIP_TUNNEL.QOS_LOW, FCIP_TUNNEL.BACKWARD_COMPATIBLE, FCIP_TUNNEL.FICON_TERADATA_READ_ENABLED, FCIP_TUNNEL.FICON_TERADATA_WRITE_ENABLED, PORT.WWN as VIRTUAL_PORT_WWN, PORT.REMOTE_PORT_WWN as REMOTE_PORT_WWN, PORT.REMOTE_NODE_WWN as REMOTE_NODE_WWN, PORT.ID as SWITCH_PORT_ID, PORT.PORT_NUMBER as SWITCH_PORT_NUMBER, PORT.USER_PORT_NUMBER as USER_PORT_NUMBER, PORT.PORT_INDEX, PORT.
Views I FRU.VENDOR_EQUIPMENT_TYPE, FRU.OPERATIONAL_STATUS, FRU.TOTAL_OUTPUT_POWER, FRU.SPEED, FRU.CREATION_TIME, FRU.LAST_UPDATE_TIME, FRU.PREVIOUS_OP_STATUS, FRU.VENDOR, CORE_SWITCH.WWN as PHYSICAL_SWITCH_WWN, VIRTUAL_SWITCH.SWITCH_MODE as VIRTUAL_SWITCH_MODE, VIRTUAL_SWITCH.MANAGEMENT_STATE, VIRTUAL_SWITCH.MONITORED from FRU, CORE_SWITCH, VIRTUAL_SWITCH where FRU.CORE_SWITCH_ID = CORE_SWITCH.ID and FRU.CORE_SWITCH_ID = VIRTUAL_SWITCH.
I Views GIGE_PORT.PORT_NAME, GIGE_PORT.OPERATIONAL_STATUS, GIGE_PORT.LED_STATE, GIGE_PORT.SPEED_LED_STATE, GIGE_PORT.PORT_TYPE, GIGE_PORT.PERSISTENTLY_DISABLED, GIGE_PORT.INTERFACE_TYPE, GIGE_PORT.CHECKSUM, GIGE_PORT.FCIP_CAPABLE, coalesce(CARD.FCIP_CIRCUIT_CAPABLE, VIRTUAL_SWITCH.FCIP_CIRCUIT_CAPABLE) as FCIP_CIRCUIT_CAPABLE, GIGE_PORT.ISCSI_CAPABLE, GIGE_PORT.REMOTE_MAC_ADDRESS, GIGE_PORT.INBAND_MANAGEMENT_STATUS, GIGE_PORT.LAST_UPDATE, SWITCH_PORT.VIRTUAL_SWITCH_ID, SWITCH_PORT.
Views I birtreport_schedule_config.deployment_id, birtreport_schedule_config.email_delivery, birtreport_schedule_config.folder_delivery, CREATE OR REPLACE VIEW generated_birtreport_info AS SELECT generated_birtreport.id AS generated_report_id, generated_birtreport.file_name, generated_birtreport.rptdoc_store_location, generated_birtreport.generate_time, generated_birtreport.format, generated_birtreport.flagged, generated_birtreport.shared, generated_birtreport.report_template_id, generated_birtreport.
I Views HBA_PORT.CREATION_TIME as HBA_PORT_CREATION_TIME, HBA_PORT.MISSING as HBA_PORT_MISSING, HBA_PORT.MISSING_TIME as HBA_PORT_MISSING_TIME, HBA_PORT.OPERATING_SPEED, HBA_PORT.CNA_PORT_ID, HBA_PORT.PORT_NWWN, HBA_PORT.PHYSICAL_PORT_WWN, HBA_PORT.SWITCH_IP, HBA_PORT.PRINCIPAL_SWITCH_WWN, HBA_PORT.HBA_ID, HBA_PORT.PORT_NUMBER, HBA_PORT.NAME, HBA_PORT.FACTORY_PORT_WWN, HBA_PORT.FACTORY_NODE_WWN, HBA_PORT.PREBOOT_CREATED, HBA_PORT.MAX_BANDWIDTH, HBA_PORT.PCIF_INDEX, HBA_PORT.MAX_PCIF, HBA_PORT_DETAIL.
I Views HBA_PORT_FCOE_DETAILS.FCF_FCMAP, HBA_PORT_FCOE_DETAILS.FCF_FPMA_MAC, HBA_PORT_FCOE_DETAILS.FCF_MAC, HBA_PORT_FCOE_DETAILS.FCF_MODE, HBA_PORT_FCOE_DETAILS.FCF_NAMEID, HBA_PORT_FCOE_DETAILS.FCPIM_MPIO_MODE, HBA_PORT_FCOE_DETAILS.PORT_LOG_ENABLED, HBA_PORT_FCOE_DETAILS.MAX_FRAME_SIZE as FCOE_MAX_FRAME_SIZE, HBA_PORT_FCOE_DETAILS.MTU as FCOE_MTU, HBA_PORT_FCOE_DETAILS.PATH_TOV as FCOE_PATH_TOV, HBA_PORT_FCOE_DETAILS.SCSI_QUEUE_DEPTH as FCOE_SCSI_QUEUE_DEPTH, HBA_PORT_FCOE_DETAILS.
I Views HBA_REMOTE_PORT.TARGET_ID, HBA_REMOTE_PORT.ROLE, HBA_REMOTE_PORT.VENDOR, HBA_REMOTE_PORT.PRODUCT_ID, HBA_REMOTE_PORT.PRODUCT_VERSION, HBA_REMOTE_PORT.QOS_PRIORITY, HBA_REMOTE_PORT.QOS_FLOW_ID, HBA_REMOTE_PORT.CURRENT_SPEED, HBA_REMOTE_PORT.TRL_ENFORCED, HBA_REMOTE_PORT.BUS_NO, HBA_REMOTE_PORT_LUN.FCP_LUN, HBA_REMOTE_PORT_LUN.CAPACITY, HBA_REMOTE_PORT_LUN.BLOCK_SIZE, HBA_REMOTE_PORT_LUN.VENDOR as LUN_VENDOR, HBA_REMOTE_PORT_LUN.PRODUCT_ID as LUN_PRODUCT_ID, HBA_REMOTE_PORT_LUN.
I Views HOST_INVENTORY_REPORT_INFO CREATE OR REPLACE VIEW host_inventory_report_info AS select DEVICE_ENCLOSURE.ID as DEVICE_ENCLOSURE_ID, DEVICE_ENCLOSURE.NAME as HOST_NAME, DEVICE_ENCLOSURE.IP_ADDRESS as HOST_IP, case when (DEVICE_ENCLOSURE.VENDOR is null or DEVICE_ENCLOSURE.VENDOR = '') then 'NA' else DEVICE_ENCLOSURE.VENDOR end as HOST_VENDOR, DEVICE_ENCLOSURE.MODEL as HOST_MODEL, DEVICE_ENCLOSURE.OS as HOST_OS, DEVICE_ENCLOSURE.LOCATION as HOST_LOCATION, DEVICE_ENCLOSURE.
I Views ADAPTER_PORT_FAA_STATUS, case when (HBA_PORT_DETAIL.WWN_SOURCE is null or HBA_PORT_DETAIL.WWN_SOURCE = '') then 'NA' else HBA_PORT_DETAIL.WWN_SOURCE end as ADAPTER_PORT_WWN_SOURCE, HBA_PORT_DETAIL.BOOT_OVER_SAN as ADAPTER_PORT_BOOT_OVER_SAN, ADAPTER_PORT.MAX_SPEED_SUPPORTED as ADAPTER_PORT_MAX_SPEED_SUPPORTED, ADAPTER_PORT.OPERATING_STATE as PORT_OPERATING_STATE, ADAPTER_PORT_COUNT.PORT_COUNT as HBA_PORT_COUNT, HBA.ID as HBA_PORT_ID, ADAPTER_PORT_FABRIC_MAP.FABRIC_NAME, ADAPTER_PORT_FABRIC_MAP.
I Views vs.domain_id As edge_virtual_switch_domain_id, sp.category AS sp_category, sp.licensed AS sp_licensed, sp.name AS sp_name, sp.slot_number AS sp_slot_number, sp.port_number AS sp_port_number, sp.port_id AS sp_port_id, sp.port_index AS sp_port_index, sp.area_id AS sp_area_id, sp.mac_address AS sp_mac_address, sp.status AS sp_status, sp.state AS sp_state, cs.model AS edge_core_switch_smodel, cs.ip_address AS edge_core_switch_ip_address, cs.wwn AS edge_core_switch_physical_switch_wwn, cs.
I Views CNA_ETH_PORT.CNA_PORT_ID and CNA_PORT.ID = CNA_ETH_PORT.CNA_PORT_ID and DEVICE_PORT.NPV_PHYSICAL=0 ) as ADAPTER_PORT, (select HBA_PORT.HBA_ID, count(HBA_PORT.DEVICE_PORT_ID) as PORT_COUNT from HBA_PORT, DEVICE_PORT_INFO where HBA_PORT.DEVICE_PORT_ID = DEVICE_PORT_INFO.ID and DEVICE_PORT_INFO.NPV_PHYSICAL = 0 group by (HBA_PORT.HBA_ID)) as ADAPTER_PORT_COUNT where DEVICE_ENCLOSURE.MANAGED_BY in (2,4) and DEVICE_ENCLOSURE.ID = HBA.HOST_ID and ADAPTER_PORT.HBA_ID = HBA.ID and ADAPTER_PORT.
Views I DEVICE_ENCLOSURE.LOCATION, DEVICE_ENCLOSURE.DESCRIPTION, DEVICE_ENCLOSURE.COMMENT_, DEVICE_ENCLOSURE.IP_ADDRESS, DEVICE_ENCLOSURE.VENDOR, DEVICE_ENCLOSURE.MODEL, DEVICE_ENCLOSURE.SERIAL_NUMBER, DEVICE_ENCLOSURE.FIRMWARE, DEVICE_ENCLOSURE.USER_DEFINED_VALUE1, DEVICE_ENCLOSURE.USER_DEFINED_VALUE2, DEVICE_ENCLOSURE.USER_DEFINED_VALUE3, DEVICE_ENCLOSURE.HCM_AGENT_VERSION, DEVICE_ENCLOSURE.OS_VERSION, DEVICE_ENCLOSURE.CREATED_BY, DEVICE_ENCLOSURE.TRACK_CHANGES, DEVICE_ENCLOSURE.
I Views DEVICE_ENCLOSURE.COMMENT_, DEVICE_ENCLOSURE.IP_ADDRESS, DEVICE_ENCLOSURE.VENDOR, DEVICE_ENCLOSURE.MODEL, DEVICE_ENCLOSURE.SERIAL_NUMBER, DEVICE_ENCLOSURE.FIRMWARE, DEVICE_ENCLOSURE.USER_DEFINED_VALUE1, DEVICE_ENCLOSURE.USER_DEFINED_VALUE2, DEVICE_ENCLOSURE.USER_DEFINED_VALUE3, DEVICE_ENCLOSURE.HCM_AGENT_VERSION, DEVICE_ENCLOSURE.OS_VERSION, DEVICE_ENCLOSURE.CREATED_BY, DEVICE_ENCLOSURE.TRACK_CHANGES, DEVICE_ENCLOSURE.LAST_UPDATE_TIME, DEVICE_ENCLOSURE.LAST_UPDATE_MODULE, DEVICE_ENCLOSURE.
Views I FCIP_TUNNEL.VIRTUAL_SWITCH_ID, DP0_SWITCH_PORT.USER_PORT_NUMBER, DP1_GIGE_PORT.PORT_NUMBER as DP1_GIGE_PORT_NUMBER, DP1_GIGE_PORT.SLOT_NUMBER as DP1_GIGE_PORT_SLOT_NUMBER, FCIP_CIRCUIT_PORT_MAP.DP1_SWITCH_PORT_ID as DP1_GIGE_PORT_ID, DP1_SWITCH_PORT.USER_PORT_NUMBER as DP1_USER_PORT_NUMBER from FCIP_TUNNEL, FCIP_TUNNEL_CIRCUIT left join FCIP_CIRCUIT_PORT_MAP on FCIP_CIRCUIT_PORT_MAP.CIRCUIT_ID = FCIP_TUNNEL_CIRCUIT.ID left join GIGE_PORT as DP0_GIGE_PORT on FCIP_CIRCUIT_PORT_MAP.
I Views bb_switch_port.wwn AS bb_switch_port_wwn, bb_switch_port.name AS bb_switch_port_name, bb_switch_port.slot_number AS bb_switch_port_slot_number, bb_switch_port.port_number AS bb_switch_port_port_number, bb_switch_port.port_id AS bb_switch_port_port_id, bb_switch_port.port_index AS bb_switch_port_port_index, bb_switch_port.area_id AS bb_switch_port_area_id, bb_switch_port.mac_address AS bb_switch_port_mac_address, bb_switch_port.status AS bb_switch_port_status, bb_switch_port.
Views I edge_switch_port.health AS edge_switch_port_health, edge_switch_port.status_message AS edge_switch_port_status_message, edge_switch_port.category AS edge_switch_port_category, edge_switch_port.licensed AS edge_switch_port_licensed, edge_switch_port.type AS edge_switch_port_type, edge_switch_port.kind AS edge_switch_port_kind, edge_switch_port.physical_port AS edge_switch_port_physical_port, edge_switch_port.trunked AS edge_switch_port_trunked, edge_switch_port.
I Views WHERE bb_fabric.managed = 1 AND bb_vs.monitored = 1 AND (edge_fabric.managed IS NULL OR edge_fabric.managed = 1) AND (edge_vs.monitored IS NULL OR edge_vs.monitored = 1); ISL_INFO create or replace view ISL_INFO as select distinct ISL.ID, ISL.FABRIC_ID, ISL.COST, ISL.TYPE, ISL.SOURCE_DOMAIN_ID, ISL.SOURCE_PORT_NUMBER, ISL.MISSING, ISL.MISSING_TIME, ISL.TRUSTED, ISL.CREATION_TIME, ISL.TRUNKED, ISL.MISSING_REASON, SOURCE_VIRTUAL_SWITCH.ID as SOURCE_SWITCH_ID, SOURCE_VIRTUAL_SWITCH.
I Views FABRIC_MEMBER VIRTUAL_SWITCH SWITCH_PORT FABRIC where DEST_FABRIC_MEMBER, DEST_VIRTUAL_SWITCH, DEST_SWITCH_PORT, SOURCE_FABRIC_MEMBER.FABRIC_ID = ISL.FABRIC_ID and SOURCE_VIRTUAL_SWITCH.ID = SOURCE_FABRIC_MEMBER.VIRTUAL_SWITCH_ID and SOURCE_VIRTUAL_SWITCH.DOMAIN_ID = ISL.SOURCE_DOMAIN_ID and SOURCE_SWITCH_PORT.VIRTUAL_SWITCH_ID = SOURCE_VIRTUAL_SWITCH.ID and SOURCE_SWITCH_PORT.CATEGORY = 1 and SOURCE_SWITCH_PORT.USER_PORT_NUMBER = ISL.SOURCE_PORT_NUMBER and DEST_FABRIC_MEMBER.FABRIC_ID = ISL.
I Views SOURCE_SWITCH_PORT.STATE AS SOURCE_SWITCH_PORT_STATE, SOURCE_SWITCH_PORT.HEALTH AS SOURCE_SWITCH_PORT_HEALTH, SOURCE_SWITCH_PORT.STATUS_MESSAGE AS SOURCE_SWITCH_PORT_STATUS_MESSAGE, SOURCE_SWITCH_PORT.CATEGORY AS SOURCE_SWITCH_PORT_CATEGORY, SOURCE_SWITCH_PORT.LICENSED AS SOURCE_SWITCH_PORT_LICENSED, SOURCE_SWITCH_PORT.TYPE AS SOURCE_SWITCH_PORT_TYPE, SOURCE_SWITCH_PORT.KIND AS SOURCE_SWITCH_PORT_KIND, SOURCE_SWITCH_PORT.PHYSICAL_PORT AS SOURCE_PHYSICAL_PORT, SOURCE_SWITCH_PORT.
Views I FABRIC.PRINCIPAL_SWITCH_WWN AS FABRIC_PRINCIPAL_SWITCH_WWN, FABRIC.MANAGEMENT_STATE AS FABRIC_MANAGEMENT_STATE, FABRIC.TYPE AS FABRIC_TYPE, FABRIC.MANAGED AS FABRIC_MANAGED FROM ISL LEFT JOIN FABRIC_MEMBER SOURCE_FABRIC_MEMBER ON SOURCE_FABRIC_MEMBER.FABRIC_ID = ISL.FABRIC_ID JOIN VIRTUAL_SWITCH SOURCE_VIRTUAL_SWITCH ON SOURCE_VIRTUAL_SWITCH.ID = SOURCE_FABRIC_MEMBER.VIRTUAL_SWITCH_ID AND SOURCE_VIRTUAL_SWITCH.DOMAIN_ID = ISL.
I Views DEST_SWITCH_PORT.IDENTIFIER as DEST_SWITCH_PORT_IDENTIFIER, DEST_SWITCH_PORT.KIND as DEST_SWITCH_PORT_KIND, DEST_SWITCH_PORT.PHYSICAL_PORT as DEST_PHYSICAL_PORT, DEST_SWITCH_PORT.
Views I SWITCH_PORT where ISL_TRUNK_GROUP.id = ISL_TRUNK_MEMBER.GROUP_ID and ISL_TRUNK_GROUP.VIRTUAL_SWITCH_ID = SWITCH_PORT.VIRTUAL_SWITCH_ID and ISL_TRUNK_MEMBER.PORT_NUMBER= SWITCH_PORT.USER_PORT_NUMBER; ISL_TRUNK_INFO create or replace view ISL_TRUNK_INFO as select ISL_TRUNK_GROUP.ID, ISL_TRUNK_GROUP.TRUSTED, ISL_TRUNK_GROUP.MISSING, ISL_TRUNK_GROUP.MISSING_TIME, ISL_TRUNK_GROUP.MEMBER_TRACKING_STATUS, ISL_INFO.COST, ISL_INFO.TYPE, ISL_INFO.SOURCE_PORT_NUMBER, ISL_INFO.SOURCE_SWITCH_ID, ISL_INFO.
I Views L2_NEIGHBOR.INTERFACE_ID, L2_NEIGHBOR.RMT_IP_ADDRESS, L2_NEIGHBOR.RMT_IF_NAME, LLDP_DATA.DEVICE_ID as RMT_DEVICE_ID, LLDP_DATA.INTERFACE_ID as RMT_INTERFACE_ID, PHY_INTF.PHYSICAL_ADDRESS as RMT_INTERFACE_MAC, RMT_DEVICE.IS_ROUTER from device RMT_DEVICE, LLDP_DATA, L2_NEIGHBOR, physical_interface PHY_INTF where LLDP_DATA.CHASSIS_ID = L2_NEIGHBOR.LLDP_REM_CHASSIS_ID and LLDP_DATA.CHASSIS_ID_SUBTYPE = L2_NEIGHBOR.LLDP_REM_CHASSIS_ID_SUBTYPE and LLDP_DATA.PORT_ID = L2_NEIGHBOR.
Views I MAPS_EVENT on MAPS_EVENT.ID = MAPS_EVENT_DETAILS.MAPS_EVENT_ID left outer join MAPS_EVENT_CAUSE_ACTION on MAPS_EVENT.VIOLATION_TYPE = MAPS_EVENT_CAUSE_ACTION.VIOLATION_TYPE left outer join VIRTUAL_SWITCH on MAPS_EVENT.MANAGED_ELEMENT_ID = VIRTUAL_SWITCH.MANAGED_ELEMENT_ID left outer join SWITCH_PORT on MAPS_EVENT.SWITCH_PORT_ID = SWITCH_PORT.ID LEFT JOIN INTERFACE ON MAPS_EVENT.INTERFACE_ID = INTERFACE.INTERFACE_ID left outer join FCIP_TUNNEL_CIRCUIT on MAPS_EVENT.
I Views EDGE_SWITCH_PORT.KIND as EDGE_SWITCH_PORT_KIND, EDGE_SWITCH_PORT.LAST_UPDATE as EDGE_SWITCH_PORT_LAST_UPDATE, EDGE_SWITCH.WWN as EDGE_VIRTUAL_SWITCH_WWN, EDGE_SWITCH.NAME as EDGE_SWITCH_NAME, EDGE_SWITCH.DOMAIN_ID as EDGE_SWITCH_DOMAIN_ID, EDGE_SWITCH.SWITCH_MODE as EDGE_SWITCH_MODE, EDGE_SWITCH.OPERATIONAL_STATUS as EDGE_SWITCH_OPERATIONAL_STATUS, EDGE_SWITCH.MANAGEMENT_STATE as EDGE_SWITCH_MANAGEMENT_STATE, EDGE_SWITCH.STATE as EDGE_SWITCH_STATE, EDGE_SWITCH.
Views I AG_F_PORT.QOS_ENABLED as AG_F_PORT_QOS_ENABLED, AG_F_PORT.TUNNEL_CONFIGURED as AG_F_PORT_TUNNEL_CONFIGURED, AG_F_PORT.FCR_FABRIC_ID as AG_F_PORT_FCR_FABRIC_ID, AG_F_PORT.FCR_INTEROP_MODE as AG_F_PORT_FCR_INTEROP_MODE, AG_F_PORT.USER_DEFINED_VALUE1 as AG_F_PORT_USER_DEFINED_VALUE1, AG_F_PORT.USER_DEFINED_VALUE2 as AG_F_PORT_USER_DEFINED_VALUE2, AG_F_PORT.USER_DEFINED_VALUE3 as AG_F_PORT_USER_DEFINED_VALUE3, AG_F_PORT.KIND as AG_F_PORT_KIND, AG_F_PORT.LAST_UPDATE as AG_F_PORT_LAST_UPDATE, AG_SWITCH.
I Views END_DEVICE_PORT.HARDWARE_ADDRESS, END_DEVICE_PORT.TRUSTED as DEVICE_PORT_TRUSTED, END_DEVICE_PORT.CREATION_TIME as DEVICE_PORT_CREATION_TIME, END_DEVICE_PORT.MISSING as DEVICE_PORT_MISSING, END_DEVICE_PORT.MISSING_TIME as DEVICE_PORT_MISSING_TIME, END_DEVICE_PORT.LOGGED_TO_AG, END_DEVICE_PORT.AG_NODE_WWN, END_DEVICE_PORT.AG_N_PORT_WWN As AG_SWITCH_N_PORT_WWN, END_DEVICE_PORT.MISSING_REASON from N2F_PORT_MAP left join SWITCH_PORT AG_F_PORT on AG_F_PORT.USER_PORT_NUMBER = N2F_PORT_MAP.
Views I TEMP_MODULE.NUM_CPUS, TEMP_MODULE.HW_REVISION, TEMP_MODULE.SW_REVISION, TEMP_MODULE.SLOT_NUM, TEMP_MODULE.DEVICE_ID, TEMP_MODULE.PHYSICAL_DEVICE_ID, TEMP_MODULE.UNIT_NUMBER, TEMP_MODULE.UNIT_PRESENT, case when TEMP_MODULE.UNIT_PRESENT = 1 then 'YES' else 'NO' end as UNIT_PRESENT_TXT, TEMP_MODULE.MANAGED_ELEMENT_ID, TEMP_MODULE.IP_ADDRESS, TEMP_FOUNDRY_MODULE.SERIAL_NUM, TEMP_FOUNDRY_MODULE.DRAM_SIZE, TEMP_FOUNDRY_MODULE.BOOT_FLASH_SIZE, TEMP_FOUNDRY_MODULE.CODE_FLASH_SIZE, TEMP_FOUNDRY_MODULE.
I Views ) TEMP_FOUNDRY_MODULE ON TEMP_MODULE.MODULE_ID = TEMP_FOUNDRY_MODULE.MODULE_ID; NPORT_WWN_MAP_INFO This view provides a consolidation between Nport WWN map and AG''s N and F ports. It considers only those N-Ports that are currently occupied that is having non-empty remote port wwn.
Views I PHANTOM_PORT.VIRTUAL_SWITCH_ID = VIRTUAL_SWITCH.ID; PRODUCT_INFO CREATE VIEW product_info AS select distinct TEMP_DEVICE.DEVICE_ID, TEMP_DEVICE.MANAGED_ELEMENT_ID, TEMP_DEVICE.ALIAS_NAME, TEMP_DEVICE.HOST_NAME, TEMP_DEVICE.OPER_STATUS, case when TEMP_DEVICE.OPER_STATUS = 1 then (case when TEMP_DEVICE.FABRIC_WATCH_STATUS = 2 then 'DEGRADED' when TEMP_DEVICE.FABRIC_WATCH_STATUS = 3 then 'DOWN' else 'REACHABLE' end) when TEMP_DEVICE.OPER_STATUS = 2 then 'NOT REACHABLE' when TEMP_DEVICE.
I Views case when TEMP_DEVICE.SUB_CATEGORY > 0 then (select distinct VCSD.IP_ADDRESS from DEVICE as VCSD where VCSD.MANAGED_ELEMENT_ID in (select distinct VM.CLUSTER_ME_ID from VCS_CLUSTER_MEMBER as VM where TEMP_DEVICE.MANAGED_ELEMENT_ID = VM.MEMBER_ME_ID)) else null end as VCS_IP_ADDRESS, TEMP_DEVICE.SYS_CONTACT, TEMP_DEVICE.SYS_LOCATION, TEMP_DEVICE.DESCRIPTION, TEMP_DEVICE.LAST_SEEN_TIME, TO_TIMESTAMP(TEMP_DEVICE.LAST_SEEN_TIME,'YYYYMMDDHH24MISS') as LAST_SEEN_TIMESTAMP, TEMP_DEVICE.
I Views from DEVICE as TEMP_DEVICE left join ( select FOUNDRY_DEVICE.DEVICE_ID, FOUNDRY_DEVICE.PRODUCT_TYPE, FOUNDRY_DEVICE.IMAGE_VERSION from FOUNDRY_DEVICE ) TEMP_FOUNDRY_DEVICE on TEMP_DEVICE.DEVICE_ID = TEMP_FOUNDRY_DEVICE.DEVICE_ID left join ( select PHYSICAL_DEVICE.DEVICE_ID, PHYSICAL_DEVICE.PHYSICAL_DEVICE_ID, PHYSICAL_DEVICE.NUM_SLOTS, PHYSICAL_DEVICE.UNIT_NUMBER from PHYSICAL_DEVICE ) TEMP_PHYSICAL_DEVICE on TEMP_DEVICE.DEVICE_ID = TEMP_PHYSICAL_DEVICE.
I Views PORT_BOTTLENECK_STATUS.STATUS, SWITCH_PORT.VIRTUAL_SWITCH_ID, SWITCH_PORT.USER_PORT_NUMBER, SWITCH_PORT.TYPE from PORT_BOTTLENECK_STATUS left outer join SWITCH_PORT on PORT_BOTTLENECK_STATUS.SWITCH_PORT_ID = SWITCH_PORT.ID; PORT_GROUP_INFO create or replace view PORT_GROUP_INFO as select SWITCH_PORT.ID as PORT_ID, SWITCH_PORT.NAME as SWITCH_PORT_NAME, SWITCH_PORT.WWN, SWITCH_PORT.HEALTH, SWITCH_PORT.STATUS, SWITCH_PORT.PORT_NUMBER, SWITCH_PORT.SLOT_NUMBER, SWITCH_PORT.
Views I PORT_PROFILE_INFO create or replace view PORT_PROFILE_INFO as select PORT_PROFILE.ID, PORT_PROFILE.SWITCH_ME_ID, PORT_PROFILE.NAME, PORT_PROFILE.STATE, PORT_PROFILE.SWITCH_PORT_MODE, PORT_PROFILE.ACL_PROFILE, PORT_PROFILE.QOS_PROFILE, PORT_PROFILE.FCOE_PROFILE, PORT_PROFILE.VLAN_PROFILE, PORT_PROFILE.VLAN_DETAILS, PORT_PROFILE.DEFAULT_PROFILE, PORT_PROFILE.ACL_NAME, PORT_PROFILE.FCOE_MAP_NAME, PORT_PROFILE.ACTIVATED, PORT_PROFILE_QOS_MAP.DCB_MODE, PORT_PROFILE_QOS_MAP.
I Views PORT_PROFILE.FCOE_PROFILE, PORT_PROFILE.VLAN_PROFILE, PORT_PROFILE.VLAN_DETAILS, PORT_PROFILE.DEFAULT_PROFILE, PORT_PROFILE.ACL_NAME, PORT_PROFILE.FCOE_MAP_NAME, PORT_PROFILE_INTERFACE_MAP.INTERFACE_ID, PORT_PROFILE_INTERFACE_MAP.SWITCH_PORT_ID from PORT_PROFILE, PORT_PROFILE_INTERFACE_MAP where PORT_PROFILE.ID= PORT_PROFILE_INTERFACE_MAP.PROFILE_ID; PORT_PROFILE_MAC_INFO create or replace view PORT_PROFILE_MAC_INFO as select PORT_PROFILE_MAC_MAP.PROFILE_ID, PORT_PROFILE_MAC_MAP.
Views I PROTOCOL_VLAN_INFO create or replace view PROTOCOL_VLAN_INFO as select V.*, port_vlan_db_id, is_dynamic, protocol from vlan V, sub_port_vlan SPV, protocol_vlan PV where V.vlan_db_id = SPV.vlan_db_id AND SPV.vlan_db_id = PV.
I Views where SLNUM <= (select MAX_SLNUM from SFLOW_MINUTE_MAC_SLNUM fetch first 1 rows only) union all select DEVICE_ID, TIME_IN_SECONDS, SRC_MAC, DEST_MAC, IN_VLAN, OUT_VLAN, FRAMES, BYTES from SFLOW_STAGING where SLNUM >= (select MIN_SLNUM from SFLOW_STAGING_SLNUM fetch first 1 rows only); SCOM_EE_MONITOR_INFO This view provides combined ee_monitor, ee_monitor_stats, device_port and device_node tables to get the EE Monitor information for SCOM plug-in.
Views I SENSOR.CORE_SWITCH_ID, SENSOR.SENSOR_ID, SENSOR.CURRENT_READING, SENSOR.TYPE, SENSOR.SUB_TYPE, SENSOR.DESCRIPTION, SENSOR.STATUS, SENSOR.OPERATIONAL_STATUS, SENSOR.PART_NUMBER, SENSOR.SERIAL_NUMBER, SENSOR.VERSION, SENSOR.CREATION_TIME, SENSOR.LAST_UPDATE_TIME, SENSOR.FRU_TYPE, SENSOR.UNIT_NUMBER, SENSOR.STATE, CORE_SWITCH.WWN as PHYSICAL_SWITCH_WWN, VIRTUAL_SWITCH.SWITCH_MODE as VIRTUAL_SWITCH_MODE, VIRTUAL_SWITCH.MANAGEMENT_STATE, VIRTUAL_SWITCH.
I Views SC.CARDCN_ID, SC.FIRST_NAME, SC.LAST_NAME, SC.NOTES, SC.CREATION_TIME, -1 ENGINE_ID, EG.ID ENCRYPTION_GROUP_ID, EG.NAME GROUP_NAME, RCGM.POSITION_ CARD_POSITION, -1 CRYPTO_SWITCH_ID, -1 SLOT_NUMBER from SMART_CARD SC, ENCRYPTION_GROUP EG, RECOVERY_CARD_GROUP_MAPPING RCGM where SC.ID = RCGM.SMART_CARD_ID and EG.ID = RCGM.ENCRYPTION_GROUP_ID and SC.CARD_TYPE = 1 union select SC.ID SMART_CARD_ID, SC.CARD_TYPE, SC.CARD_INFO, SC.CARDCN_ID, SC.FIRST_NAME, SC.LAST_NAME, SC.NOTES, SC.CREATION_TIME, EE.
Views I SWITCH_CONFIG. IS_BASELINE, SWITCH_CONFIG. BACKUP_TYPE, SWITCH_CONFIG. DRIFT_STATUS, SWITCH_CONFIG_DETAIL.IP_ADDRESS, SWITCH_CONFIG_DETAIL.WWN, SWITCH_CONFIG_DETAIL.PHYSICAL_SWITCH_WWN, SWITCH_CONFIG_DETAIL.MODEL_NUMBER as SWITCH_MODEL_NUMBER from SWITCH_CONFIG, SWITCH_CONFIG_DETAIL where SWITCH_CONFIG.ID= SWITCH_CONFIG_DETAIL.SWITCH_CONFIG_ID; SWITCH_PORT_DETAILS_INFO create or replace view SWITCH_PORT_DETAILS_REPORT_INFO as with SWPRT_VSW_CSW_CSWDET_SWMDL_VIEW as ( select SWITCH_PORT.
I Views VIRTUAL_SWITCH.NAME as REMOTE_SWITCH_NAME, VIRTUAL_SWITCH.SWITCH_MODE as REMOTE_SWITCH_MODE, VIRTUAL_SWITCH.DOMAIN_ID as REMOTE_SWITCH_DOMAIN_ID, VIRTUAL_SWITCH.WWN as REMOTE_VIRTUAL_SWITCH_WWN, VIRTUAL_SWITCH.OPERATIONAL_STATUS as REMOTE_SWITCH_OPERATIONAL_STATUS, VIRTUAL_SWITCH.MANAGEMENT_STATE as REMOTE_SWITCH_MANAGEMENT_STATE, VIRTUAL_SWITCH.STATE as REMOTE_SWITCH_STATE, VIRTUAL_SWITCH.STATUS as REMOTE_SWITCH_STATUS, VIRTUAL_SWITCH.STATUS_REASON as REMOTE_SWITCH_STATUS_REASON, CORE_SWITCH.
Views I DEVICE_NODE.AG as DEVICE_NODE_IS_AG, DEVICE_NODE.SIMULATED as DEVICE_NODE_SIMULATED, DEVICE_NODE.FABRIC_ID as DEVICE_NODE_FABRIC_ID from DEVICE_PORT join DEVICE_NODE on DEVICE_PORT.NODE_ID = DEVICE_NODE.ID ) select FABRIC_MEMBER.FABRIC_ID, FABRIC.SEED_SWITCH_WWN as FABRIC_SEED_SWITCH_WWN, FABRIC.NAME as FABRIC_NAME, FABRIC.MANAGEMENT_STATE as FABRIC_MANAGEMENT_STATE, FABRIC.PRINCIPAL_SWITCH_WWN as FABRIC_PRINCIPAL_SWITCH_WWN, FABRIC.FABRIC_NAME as FABRIC_SWITCH_PERSIST_FABRIC_NAME, FABRIC.
I Views DEVPORT_DEVNODE_VIEW.DEVICE_NODE_ID, DEVPORT_DEVNODE_VIEW.DEVICE_PORT_COS, DEVPORT_DEVNODE_VIEW.DEVICE_NODE_WWN, DEVPORT_DEVNODE_VIEW.DEVICE_NODE_DEVICE_TYPE, DEVPORT_DEVNODE_VIEW.DEVICE_NODE_NAME, DEVPORT_DEVNODE_VIEW.DEVICE_FDMI_HOST_NAME, DEVPORT_DEVNODE_VIEW.DEVICE_NODE_CAPABILITY, DEVPORT_DEVNODE_VIEW.DEVICE_NODE_TYPE, DEVPORT_DEVNODE_VIEW.DEVICE_NODE_VENDOR, DEVPORT_DEVNODE_VIEW.DEVICE_NODE_PROXY_DEVICE, DEVPORT_DEVNODE_VIEW.DEVICE_NODE_IS_AG, DEVPORT_DEVNODE_VIEW.
Views I SWPRT_VSW_CSW_CSWDET_SWMDL_VIEW.REMOTE_SWITCH_STATE, SWPRT_VSW_CSW_CSWDET_SWMDL_VIEW.REMOTE_SWITCH_STATUS, SWPRT_VSW_CSW_CSWDET_SWMDL_VIEW.REMOTE_SWITCH_STATUS_REASON, SWPRT_VSW_CSW_CSWDET_SWMDL_VIEW.REMOTE_CORE_SWITCH_ID, SWPRT_VSW_CSW_CSWDET_SWMDL_VIEW.REMOTE_CORE_SWITCH_IP_ADDRESS, SWPRT_VSW_CSW_CSWDET_SWMDL_VIEW.REMOTE_CORE_SWITCH_WWN, SWPRT_VSW_CSW_CSWDET_SWMDL_VIEW.REMOTE_CORE_SWITCH_NAME, SWPRT_VSW_CSW_CSWDET_SWMDL_VIEW.REMOTE_CORE_SWITCH_TYPE, SWPRT_VSW_CSW_CSWDET_SWMDL_VIEW.
I Views varying]::text[])) or SWITCH_PORT.TYPE::text~~ 'LB-Port%'::text) and VIRTUAL_SWITCH.MONITORED = 1 and (VIRTUAL_SWITCH.SWITCH_MODE = any (array[0, 2])) and ((CORE_SWITCH.TYPE <> all (array[62, 63])) or (SWITCH_PORT.SLOT_NUMBER <> all (array[5, 8]))) and (FABRIC.MANAGED is null or FABRIC.MANAGED = 1) and (FABRIC.TYPE is null or (FABRIC.TYPE <> all (array[65, 66, 4]))); SWITCH_DETAILS_INFO create or replace view SWITCH_DETAILS_INFO as select CORE_SWITCH.ID as PHYSICAL_SWITCH_ID, CORE_SWITCH.
Views I VIRTUAL_SWITCH.USER_DEFINED_VALUE_1, VIRTUAL_SWITCH.USER_DEFINED_VALUE_2, VIRTUAL_SWITCH.USER_DEFINED_VALUE_3, VIRTUAL_SWITCH.FMS_MODE, VIRTUAL_SWITCH.DYNAMIC_LOAD_SHARING, VIRTUAL_SWITCH.PORT_BASED_ROUTING, VIRTUAL_SWITCH.IN_ORDER_DELIVERY, VIRTUAL_SWITCH.INSISTENT_DID_MODE, VIRTUAL_SWITCH.FCR_CAPABLE, VIRTUAL_SWITCH.LAST_PORT_MEMBERSHIP_CHANGE, VIRTUAL_SWITCH.FCIP_CIRCUIT_CAPABLE, VIRTUAL_SWITCH.MAX_FCIP_TUNNELS, VIRTUAL_SWITCH.MAX_FCIP_CIRCUITS, VIRTUAL_SWITCH.FCIP_LICENSED, VIRTUAL_SWITCH.
I Views CORE_SWITCH_DETAILS.CONTACT, CORE_SWITCH_DETAILS.LOCATION, CORE_SWITCH_DETAILS.DESCRIPTION, CORE_SWITCH_DETAILS.RNID_SEQUENCE_NUMBER, CORE_SWITCH_DETAILS.FIRMWARE_VERSION as CSD_FIRMWARE_VERSION, CORE_SWITCH_DETAILS.CHASSIS_PACKAGE_TYPE, CORE_SWITCH_DETAILS.IP_ADDRESS_PREFIX, CORE_SWITCH_DETAILS.DOMAIN_NAME, CORE_SWITCH_DETAILS.FRAME_LOG_SIZE, CORE_SWITCH_DETAILS.FRAME_LOG_ENABLED, CORE_SWITCH_DETAILS.
Views I SWITCH_PORT.STATUS, SWITCH_PORT.HEALTH, SWITCH_PORT.STATUS_MESSAGE, SWITCH_PORT.PHYSICAL_PORT, SWITCH_PORT.LOCKED_PORT_TYPE, SWITCH_PORT.CATEGORY, SWITCH_PORT.PROTOCOL, SWITCH_PORT.SPEED, SWITCH_PORT.SPEEDS_SUPPORTED, SWITCH_PORT.MAX_PORT_SPEED, SWITCH_PORT.DESIRED_CREDITS, SWITCH_PORT.BUFFER_ALLOCATED, SWITCH_PORT.ESTIMATED_DISTANCE, SWITCH_PORT.ACTUAL_DISTANCE, SWITCH_PORT.LONG_DISTANCE_SETTING, SWITCH_PORT.DEGRADED_PORT, SWITCH_PORT.REMOTE_NODE_WWN, SWITCH_PORT.REMOTE_PORT_WWN, SWITCH_PORT.
I Views SWITCH_PORT.PORT_COMMISSION_STATE, SWITCH_PORT.FEATURES_SUPPORTED, SWITCH_PORT.FEATURES_ENABLED, SWITCH_PORT.FEATURES_ACTIVE, SWITCH_PORT.DISABLED_REASON_CODE, SWITCH_PORT.DISABLED_REASON, SWITCH_PORT.FENCED, SWITCH_PORT.MASTER_PORT_NUMBER, SWITCH_PORT.SPEED_TYPE, VIRTUAL_SWITCH.WWN as VIRTUAL_SWITCH_WWN, VIRTUAL_SWITCH.ROLE as SWITCH_ROLE, VIRTUAL_SWITCH.VIRTUAL_FABRIC_ID as VIRTUAL_FABRIC_ID, VIRTUAL_SWITCH.DOMAIN_ID as DOMAIN_ID, VIRTUAL_SWITCH.INTEROP_MODE as INTEROP_MODE, VIRTUAL_SWITCH.
Views I VIRTUAL_SWITCH.VIRTUAL_FABRIC_ID, VIRTUAL_SWITCH.BASE_SWITCH, VIRTUAL_SWITCH.MAX_ZONE_CONFIG_SIZE, VIRTUAL_SWITCH.CREATION_TIME, VIRTUAL_SWITCH.LAST_UPDATE_TIME, VIRTUAL_SWITCH.USER_NAME, VIRTUAL_SWITCH.PASSWORD, VIRTUAL_SWITCH.MANAGEMENT_STATE, VIRTUAL_SWITCH.STATE, VIRTUAL_SWITCH.STATUS, VIRTUAL_SWITCH.STATUS_REASON, VIRTUAL_SWITCH.MONITORED, VIRTUAL_SWITCH.USER_DEFINED_VALUE_1, VIRTUAL_SWITCH.USER_DEFINED_VALUE_2, VIRTUAL_SWITCH.USER_DEFINED_VALUE_3, FABRIC_MEMBER.FABRIC_ID, FABRIC_MEMBER.
I Views TIME_SERIES_DATA_INFO CREATE VIEW time_series_data_info AS ( ( ( ( ( ( select * from TIME_SERIES_DATA_1 union all select TIME_SERIES_DATA_1_30MIN.TIME_IN_SECONDS, TIME_SERIES_DATA_1_30MIN.TARGET_TYPE, TIME_SERIES_DATA_1_30MIN.MEASURE_ID, TIME_SERIES_DATA_1_30MIN.TARGET_ID, TIME_SERIES_DATA_1_30MIN.COLLECTOR_ID, TIME_SERIES_DATA_1_30MIN.MEASURE_INDEX, TIME_SERIES_DATA_1_30MIN.ME_ID, TIME_SERIES_DATA_1_30MIN.VALUE, TIME_SERIES_DATA_1_30MIN.
Views I TIME_SERIES_DATA_2_2HOUR.VALUE, TIME_SERIES_DATA_2_2HOUR.SUM_VALUE from TIME_SERIES_DATA_2_2HOUR) union all select TIME_SERIES_DATA_2_1DAY.TIME_IN_SECONDS, TIME_SERIES_DATA_2_1DAY.TARGET_TYPE, TIME_SERIES_DATA_2_1DAY.MEASURE_ID, TIME_SERIES_DATA_2_1DAY.TARGET_ID, TIME_SERIES_DATA_2_1DAY.COLLECTOR_ID, TIME_SERIES_DATA_2_1DAY.MEASURE_INDEX, TIME_SERIES_DATA_2_1DAY.ME_ID, TIME_SERIES_DATA_2_1DAY.VALUE, TIME_SERIES_DATA_2_1DAY.
I Views (measure.name::text || '.'::text) || tsd.measure_index::text AS collectible_name, measure.detail AS collectible_detail, tsd.value, tsd.time_in_seconds, tsd.measure_index FROM time_series_data_info tsd JOIN switch_port sp ON tsd.target_type = 4 AND tsd.target_id = sp.id JOIN virtual_switch vs ON sp.virtual_switch_id = vs.id JOIN device de ON vs.managed_element_id = de.managed_element_id JOIN pm_data_collector ON pm_data_collector.id = tsd.collector_id JOIN measure ON measure.id = tsd.
Views I SOURCE_DEVICE.DEVICE_ID AS SOURCE_DEVICE_ID, TRILL.DEST_DOMAIN_ID, TRILL.DEST_PORT_NUMBER, TRILL.DEST_PORT_NAME as DEST_SWITCH_PORT_NAME, TRILL.DEST_ME_ID, DEST_DEVICE.DEVICE_ID AS DEST_DEVICE_ID from TRILL, device VCS_DEVICE, device SOURCE_DEVICE, VIRTUAL_SWITCH SOURCE_VIRTUAL_SWITCH, device DEST_DEVICE, VIRTUAL_SWITCH DEST_VIRTUAL_SWITCH where SOURCE_DEVICE.MANAGED_ELEMENT_ID = TRILL.SOURCE_ME_ID and DEST_DEVICE.MANAGED_ELEMENT_ID = TRILL.DEST_ME_ID and VCS_DEVICE.MANAGED_ELEMENT_ID = TRILL.
I Views ROLE.ID ROLE_ID, ROLE.NAME ROLE_NAME, USER_.NAME USER_NAME from USER_, RESOURCE_GROUP, ROLE, USER_RESOURCE_MAP, USER_ROLE_MAP where USER_ROLE_MAP.USER_NAME = USER_.NAME and USER_ROLE_MAP.ROLE_ID = ROLE.ID and USER_RESOURCE_MAP.RESOURCE_GROUP_ID = RESOURCE_GROUP.ID and USER_RESOURCE_MAP.USER_NAME = USER_.NAME; VIRTUAL_FCOE_PORT_INFO create or replace view VIRTUAL_FCOE_PORT_INFO as select VIRTUAL_FCOE_PORT.ID, VIRTUAL_FCOE_PORT.VIRTUAL_SWITCH_ID, VIRTUAL_FCOE_PORT.PORT_WWN, VIRTUAL_FCOE_PORT.
Views I VIRTUAL_PORT_WWN_DETAILS.SWITCH_PORT_NUMBER, VIRTUAL_PORT_WWN_DETAILS.SLOT_NUMBER, coalesce(CS1.IP_ADDRESS, CS2.IP_ADDRESS, UDDD.IP_ADDRESS) as IP_ADDRESS, coalesce(VS1.NAME, VS2.NAME, UDDD.NAME) as SWITCH_NAME, coalesce(VS1.WWN, VS2.WWN) as SWITCH_WWN, VIRTUAL_PORT_WWN_DETAILS.AG_NODE_WWN, VIRTUAL_PORT_WWN_DETAILS.AG_PORT_NUMBER, VIRTUAL_PORT_WWN_DETAILS.STATUS, VIRTUAL_PORT_WWN_DETAILS.TYPE, VIRTUAL_PORT_WWN_DETAILS.USER_VPWWN, VIRTUAL_PORT_WWN_DETAILS.AUTO_VPWWN, VIRTUAL_PORT_WWN_DETAILS.
I Views AND VM_VIRTUAL_MACHINE.HOST_ID = VM_VCENTER_MEMBER.VM_HOST_ID; VLAN_INT_CLASSIFIER_INFO CREATE VIEW vlan_int_classifier_info AS select VLAN_INTERFACE_RELATION.VLAN_INTERFACE_RELATION_ID, VLAN_INTERFACE_RELATION.VLAN_DB_ID, VLAN_INTERFACE_RELATION.INTERFACE_ID, VLAN_INT_C_TAG_RELATION.C_TAG_ID, MAC_GROUP.NAME, MAC_GROUP.MAC_GROUP_ID, MAC_GROUP.TYPE, MAC_GROUP_MEMBER.MAC_ADDRESS, MAC_GROUP_MEMBER.MASK, MAC_GROUP.ID AS MAC_GROUP_DB_ID, DEVICE.
Views I VM_PATH.TARGET_PORT AS TARGET_PORT_WWN, VM_STORAGE.NAME AS LUN_CAN_NAME, VM_PATH.FS_TYPE, VM_VIRTUAL_MACHINE.HYPERVISOR_VM_ID, DEVICE_ENCLOSURE.MANAGED_ELEMENT_ID AS HOST_ME_ID, DEVICE_ENCLOSURE.IP_ADDRESS AS HOST_IP_ADDRESS, DEVICE_ENCLOSURE.HOST_NAME AS HYPERVISOR_HOST_NAME, FABRIC.NAME AS FABRIC_NAME, VIRTUAL_SWITCH.NAME AS VIRTUAL_NAME, SWITCH_PORT.STATUS AS SWITCH_PORT_STATUS, SWITCH_PORT.ID as SWITCH_PORT_ID, SWITCH_PORT.PORT_ID, SWITCH_PORT.PORT_NUMBER, SWITCH_PORT.
I Views VM_VCENTER.ID as VCENTER_ID, DEVICE_ENCLOSURE.ID AS HOST_DB_ID, DEVICE_ENCLOSURE.IP_ADDRESS as HYPERVISOR_HOST, VM_VIRTUAL_MACHINE.ID as VM_ID, VM_VIRTUAL_MACHINE.IP_ADDRESS AS VM_IP_ADDRESS, VM_VIRTUAL_MACHINE.HOSTNAME AS VM_HOST_NAME, VM_VIRTUAL_MACHINE.UUID as VM_UUID, VM_VIRTUAL_MACHINE.NAME as VM_NAME, VM_PATH.NAME as PATH_NAME, VM_PATH.HBA_PORT as ADAPTER_PORT_WWN, VM_PATH.TARGET_PORT as TARGET_PORT_WWN, VM_STORAGE.NAME as LUN_CAN_NAME, VM_PATH.FS_TYPE, VM_VIRTUAL_MACHINE.
Views and and and and I SWITCH_PORT.VIRTUAL_SWITCH_ID = VIRTUAL_SWITCH.ID VIRTUAL_SWITCH.CORE_SWITCH_ID = CORE_SWITCH.ID DEVICE_PORT.NODE_ID = DEVICE_NODE.ID DEVICE_NODE.FABRIC_ID = FABRIC.ID; comment on view VM_CONNECTIVITY_INFO is 'Combine fabric and VM info to derive end to end connectivity information for the VM'; VM_NETWORK_CONNECTIVITY_INFO CREATE VIEW vm_network_connectivity_info AS select VM_VIRTUAL_ETHERNET_ADAPTER.ID as VNIC_ID, VM_VIRTUAL_ETHERNET_ADAPTER.
I Views left join (select PROFILE_ID, array_agg(VLANID)::varchar as VLAN from PORT_PROFILE_VLAN_MAP group by PROFILE_ID) PROFILE_VLAN_MAP on PROFILE_VLAN_MAP.PROFILE_ID = PORT_PROFILE.ID left join VM_NETWORK_SETTINGS on VM_NETWORK_SETTINGS.VM_STD_VSWITCH_PORT_GROUP_ID = VM_VIRTUAL_ETHERNET_ADAPTER.VM_STD_VSWITCH_PORT_GROUP_ID where VM_VIRTUAL_ETHERNET_ADAPTER.VIRTUAL_MACHINE_ID = VM_VIRTUAL_MACHINE.ID and VM_VIRTUAL_MACHINE.HOST_ID = VM_VCENTER_MEMBER.VM_HOST_ID and VM_VIRTUAL_MACHINE.HOST_ID = VM_HOST.
Views I left join VCS_CLUSTER_MEMBER on VCS_CLUSTER_MEMBER.MEMBER_ME_ID = DEVICE.MANAGED_ELEMENT_ID left join DEVICE as CLUSTER_DEVICE on CLUSTER_DEVICE.MANAGED_ELEMENT_ID = VCS_CLUSTER_MEMBER.CLUSTER_ME_ID left join PORT_PROFILE_INTERFACE_MAP on PORT_PROFILE_INTERFACE_MAP.INTERFACE_ID = INTERFACE.INTERFACE_ID left join PORT_PROFILE on PORT_PROFILE.ID = PORT_PROFILE_INTERFACE_MAP.PROFILE_ID left join (select PORT_PROFILE_DOMAIN_MAP.PROFILE_ID, array_to_string(array_agg(PORT_PROFILE_DOMAIN.
I Views DEST_NODE.WWN as DEST_DEVICE_WWN, DEST_PORT.WWN as DEST_PORT_WWN, SOURCE_NODE.FABRIC_ID as SOURCE_FABRIC_ID, DEST_NODE.FABRIC_ID as DEST_FABRIC_ID, SOURCE_PORT.DOMAIN_ID as SOURCE_SWITCH_DOMAIN_ID, DEST_PORT.DOMAIN_ID as DEST_SWITCH_DOMAIN_ID, VM_VIRTUAL_MACHINE.HYPERVISOR_VM_ID, VM_VIRTUAL_MACHINE.NAME as VM_NAME from VM_PATH, VM_VIRTUAL_MACHINE, DEVICE_PORT as SOURCE_PORT, DEVICE_PORT as DEST_PORT, DEVICE_NODE as DEST_NODE, DEVICE_NODE as SOURCE_NODE, EE_MONITOR, EE_MONITOR_STATS where VM_PATH.
Views I VM_VIRTUAL_MACHINE.HOSTNAME as VM_HOSTNAME, VM_VIRTUAL_MACHINE.BOOT_TIME as VM_BOOT_TIME, VM_VIRTUAL_MACHINE.DATASTORE_NAME, VM_VIRTUAL_MACHINE.DATASTORE_LOCATION, VM_VIRTUAL_MACHINE.NODE_WWN as VM_NODE_WWN from VM_DATA_CENTER, VM_HOST left join VM_VIRTUAL_MACHINE on VM_HOST.DEVICE_ENCLOSURE_ID = VM_VIRTUAL_MACHINE.HOST_ID where VM_DATA_CENTER.ID = VM_HOST.VM_DATACENTER_ID; VM_LUN_INFO create or replace view VM_LUN_INFO as select VM_STORAGE.HOST_ID, VM_STORAGE.ID as LUN_ID, VM_STORAGE.
I Views DEVICE_PORT.DOMAIN_ID, DEVICE_ENCLOSURE.IP_ADDRESS as HYPERVISOR_HOST, VM_PATH.HBA_PORT as ADAPTER_PORT_WWN, VM_VIRTUAL_MACHINE.HYPERVISOR_VM_ID, VM_VIRTUAL_MACHINE.NAME as VM_NAME, CORE_SWITCH.IP_ADDRESS, CORE_SWITCH.NAME as CORE_NAME, FC_PORT_STATS.TX, FC_PORT_STATS.RX, FC_PORT_STATS.TX_UTILIZATION, FC_PORT_STATS.RX_UTILIZATION, FC_PORT_STATS.SYNCLOSSES, FC_PORT_STATS.SIGNALLOSSES, FC_PORT_STATS.SEQUENCEERRORS, FC_PORT_STATS.INVALIDTRANSMISSIONS, FC_PORT_STATS.CRCERRORS, FC_PORT_STATS.
I Views SWITCH_TE_PORT_STATS.RECEIVE_OK_PERCENT_UTIL, (-1) AS SYNCLOSSES, (-1) AS SIGNALLOSSES, (-1) AS SEQUENCEERRORS, (-1) AS INVALIDTRANSMISSIONS, (-1) AS CRCERRORS, SWITCH_TE_PORT_STATS.CREATION_TIME, VIRTUAL_SWITCH.NAME as VIRTUAL_NAME, SWITCH_PORT.STATUS as SWITCH_PORT_STATUS, SWITCH_PORT.PORT_ID, SWITCH_PORT.
I Views VR_CONN_DOMAIN_GROUP.NAME as DOMAIN_GROUP_NAME, VCEM_PROFILE.ID as VCEM_PROFILE_ID, VCEM_PROFILE.DISCOVERY_STATUS, VCEM_PROFILE.LAST_FAILURE_TIMESTAMP as VCEM_LAST_FAILED_TIME, VCEM_PROFILE.LAST_SUCCESSFUL_TIMESTAMP as VCEM_LAST_SUCCESSFUL_TIME, VIRTUAL_SWITCH.ID as VIRTUAL_SWITCH_ID, VIRTUAL_SWITCH.MANAGED_ELEMENT_ID as VIRTUAL_SWITCH_ME_ID, VIRTUAL_SWITCH.NAME, CORE_SWITCH.IP_ADDRESS, FABRIC_MEMBER.FABRIC_ID, FABRIC.
Views I FABRIC.MANAGED as FABRIC_MANAGED from VR_CONN_MODULE inner join VR_CONN_DOMAIN on VR_CONN_DOMAIN.ID = VR_CONN_MODULE.VR_CONN_DOMAIN_ID inner join VCEM_PROFILE on VCEM_PROFILE.ID = VR_CONN_DOMAIN.VCEM_PROFILE_ID left outer join VR_CONN_DOMAIN_GROUP on VR_CONN_DOMAIN_GROUP.ID = VR_CONN_DOMAIN.VR_CONN_DOMAIN_GROUP_ID left outer join VIRTUAL_SWITCH on VIRTUAL_SWITCH.WWN = VR_CONN_MODULE.WWN left outer join CORE_SWITCH on CORE_SWITCH.ID = VIRTUAL_SWITCH.
I Views left outer join VIRTUAL_SWITCH on VIRTUAL_SWITCH.WWN = VR_CONN_MODULE.WWN; VR_CONN_NPIV_INFO create or replace view VR_CONN_NPIV_INFO as select VR_CONN_WWN.ID, VR_CONN_WWN.VR_CONN_FC_CONNECTION_ID, VR_CONN_WWN.PORT_ADDRESS as PORT_WWN, VR_CONN_WWN.NODE_ADDRESS as NODE_WWN, VR_CONN_SERVER_PROFILE.NAME as SERVER_PROFILE_NAME, VR_CONN_SERVER_PROFILE.BAY_NAME, coalesce(VR_CONN_SERVER_PROFILE.BAY_NUMBER, VR_CONN_FC_CONNECTION.CONNECTION_BAY) as BAY_NUMBER, VR_CONN_SERVER_PROFILE.
Views I SWITCH_PORT.WWN = VR_CONN_MODULE_PORT.WWN left outer join DEVICE_PORT on DEVICE_PORT.WWN = VR_CONN_WWN.PORT_ADDRESS left outer join DEVICE_NODE on DEVICE_NODE.WWN = VR_CONN_WWN.NODE_ADDRESS left outer join USER_DEFINED_DEVICE_DETAIL on USER_DEFINED_DEVICE_DETAIL.WWN = VR_CONN_WWN.PORT_ADDRESS; VMM_DISCOVERED_MAC_INFO create or replace view VMM_DISCOVERED_MAC_INFO AS select VM_VIRTUAL_ETHERNET_ADAPTER.MAC_ADDRESS, VM_VIRTUAL_ETHERNET_ADAPTER.DISPLAY_LABEL, VM_VIRTUAL_ETHERNET_ADAPTER.
I Views where VM_PHYSICAL_NIC.VM_HOST_ID = VM_VCENTER_MEMBER.VM_HOST_ID AND VM_VCENTER_MEMBER.VM_VCENTER_ID = VM_VCENTER.ID; VM_VIRTUAL_ETHERNET_ADAPTER_INFO create or replace view VM_VIRTUAL_ETHERNET_ADAPTER_INFO as select VM_VIRTUAL_ETHERNET_ADAPTER.ID, VM_VIRTUAL_ETHERNET_ADAPTER.MAC_ADDRESS, VM_VIRTUAL_ETHERNET_ADAPTER.DISPLAY_LABEL, VM_VIRTUAL_ETHERNET_ADAPTER.PORT_GROUP_NAME, VM_VIRTUAL_MACHINE.NAME as VIRTUAL_MACHINE_NAME, VM_VCENTER_MEMBER.HOST_NAME, VM_VCENTER.
I Views ZONE_DB_REPORT_INFO CREATE OR REPLACE VIEW zone_db_report_info AS SELECT zone_db.id, zone_db.fabric_id, zone_db.offline, zone_db.name, zone_db.created, zone_db.created_by, zone_db.last_modified, zone_db.last_modified_by, zone_db.last_applied, zone_db.last_applied_by, zone_db.default_zone_status, zone_db.mcdata_default_zone, zone_db.mcdata_safe_zone, zone_db.zone_txn_supported, zone_db.zone_config_size, zone_db.txn_status, zone_db.zone_available_size, zone_db_config.id AS config_id, zone_db_config.
I Views SFLOW_MINUTE_VLAN_VIEW create or replace view SFLOW_MINUTE_VLAN_VIEW as select DEVICE_ID, TIME_IN_SECONDS, IN_VLAN, OUT_VLAN, FRAMES, BYTES from SFLOW_MINUTE_VLAN where SLNUM <= (select MAX_SLNUM from SFLOW_MINUTE_VLAN_SLNUM fetch first 1 rows only) union all select DEVICE_ID, TIME_IN_SECONDS, IN_VLAN, OUT_VLAN, FRAMES, BYTES from SFLOW_STAGING where SLNUM >= (select MIN_SLNUM from SFLOW_STAGING_SLNUM fetch first 1 rows only); PHYSICAL_DEVICE_INFO create or replace view PHYSICAL_DEVICE_INFO as se
Views I MANAGED_ELEMENT_INFO Common managed element data used by custom DTO methods to identify the managed element type, and provide a link to the details table for the managed element. Some common managed element fields are included in this view so Fault Management can use this view to identify the managed element ID for an event source. create or replace view MANAGED_ELEMENT_INFO as select MANAGED_ELEMENT.ID as MANAGED_ELEMENT_ID, DEVICE.DEVICE_ID as IP_DEVICE_ID, coalesce(CS_ME.ID, CS_VS.
I Views ( ( ( ( SELECT de.device_id, de.ip_address AS device_ip, se.target_type, de.device_id AS target_id, de.sys_name AS target_name, 1 AS collectible_type, se.expression_id AS collectible_id, se.collector_id, ( SELECT perf_collector.name AS collector_name FROM perf_collector WHERE perf_collector.collector_id = se.collector_id) AS collector_name, ( SELECT snmp_expression.name AS collectible_name FROM snmp_expression WHERE snmp_expression.expression_id = se.
Views I UNION ALL SELECT de.device_id, de.ip_address AS device_ip, se.target_type, ifs.interface_id AS target_id, ifs.if_name AS target_name, 1 AS collectible_type, se.expression_id AS collectible_id, se.collector_id, ( SELECT perf_collector.name AS collector_name FROM perf_collector WHERE perf_collector.collector_id = se.collector_id) AS collector_name, ( SELECT snmp_expression.name AS collectible_name FROM snmp_expression WHERE snmp_expression.expression_id = se.
I Views VM_VNETWORK_INFO This view provideds combine VM and device information to derive VM to the ingress switch port information. create or replace view VM_VNETWORK_INFO as select VM_HOST.HYPERVISOR_NAME as VHOST_NAME, VM_VIRTUAL_MACHINE.NAME as VM_NAME, VM_VIRTUAL_MACHINE.HYPERVISOR_VM_ID as VM_ID, VM_VIRTUAL_ETHERNET_ADAPTER.MAC_ADDRESS as VNIC_MAC, VM_DV_PORT_GROUP.NAME as PGRP_NAME, VM_DV_SWITCH.NAME as VSWITCH_NAME, VNIC_DV_PORT.NAME as DVPORT_NAME, VM_PHYSICAL_NIC.
Views I VM_PHYSICAL_NIC.DEVICE_NAME as PNIC_NAME, VM_PHYSICAL_NIC.MAC_ADDRESS as PNIC_MAC, DEVICE.SYS_NAME as SWITCH_NAME, DEVICE.IP_ADDRESS as SWITCH_IP, PHYSICAL_PORT.PORT_NUM as SWITCH_PORT, INTERFACE.PORT_STATUS as SWITCH_PORT_STATUS from VM_HOST left join VM_VIRTUAL_MACHINE on VM_HOST.DEVICE_ENCLOSURE_ID = VM_VIRTUAL_MACHINE.
I Views RESET_VCS_LICENSED CREATE OR REPLACE FUNCTION reset_vcs_licensed(no_of_licenses integer) RETURNS void AS $BODY$ begin UPDATE fabric set vcs_licensed = 0; UPDATE device set vcs_licensed = 0; UPDATE fabric set vcs_licensed = 1 WHERE fabric.id in (SELECT id FROM fabric ORDER BY creation_time LIMIT no_of_licenses); UPDATE device set vcs_licensed = 1 WHERE device.
Views I SELECT l2.device_id, l2.device_ip_address, l2.physical_device_id, l2.unit_number, l2.slot_id, l2.slot_num, l2.module_id, l2.physical_port_id, l2.port_num, l2.interface_id, l2.name, l2.if_name, l2.identifier, l2.speed_in_mb, l2.physical_address, l2.interface_id AS radioif_id, wireless.radio_type, wireless.is_enabled, wireless.is_auto_channel, wireless.tx_power, wireless.channel_number, wireless.max_data_rate, wireless.beacon_rate, wireless.dtim, wireless.rts_threshold, wireless.
I Views select L2.DEVICE_ID, L2.MANAGED_ELEMENT_ID, L2.DEVICE_IP_ADDRESS, L2.PHYSICAL_DEVICE_ID, L2.UNIT_NUMBER, L2.SLOT_ID, L2.SLOT_NUM, L2.MODULE_ID, L2.PHYSICAL_PORT_ID, L2.PORT_NUM, L2.INTERFACE_ID, L2.NAME, L2.IF_NAME, L2.IDENTIFIER, L2.TABLE_SUBTYPE, case when L2.TABLE_SUBTYPE like 'GBIT_ETHERNET_INTERFACE' then 'GIGABIT ETHERNET' when L2.TABLE_SUBTYPE like 'POS_INTERFACE' then 'POS' else L2.TABLE_SUBTYPE end as TABLE_SUBTYPE_TXT, L2.TAG_MODE, case when L2.TAG_MODE = 1 then 'TAGGED' when L2.
Views I INM_IP_INTERFACE.SUBNET_MASK from INM_IP_INTERFACE) L3 on L2.INTERFACE_ID = L3.IP_ID; CEE_PORT_INFO create or replace view CEE_PORT_INFO as CREATE VIEW cee_port_info AS select GIGE_PORT.ID, GIGE_PORT.SWITCH_PORT_ID, GIGE_PORT.PORT_NUMBER, CEE_PORT.ID AS CEE_PORT_ID, CEE_PORT.VIRTUAL_SWITCH_ID, CEE_PORT.IF_INDEX, CEE_PORT.IF_NAME, CEE_PORT.IF_MODE, CEE_PORT.L2_MODE, CEE_PORT.VLAN_ID, CEE_PORT.LAG_ID, CEE_PORT.IP_ADDRESS, CEE_PORT.MAC_ADDRESS, CEE_PORT.PORT_SPEED, CEE_PORT.ENABLED, CEE_PORT.
I 2608 Views Brocade Network Advisor SAN + IP User Manual 53-1003155-01
Index A access levels defined 2173 features 2173–2175, 2175–??, 2176–?? roles 2173 accessing FTP server folder 217 ACK emulation, device level 1254 activating Allow/Prohibit Matrix configuration 1312 LSAN zones 1197 zone configuration 1183 active session management, roles and access levels 2173 active sessions, viewing 10 adapter software using to manage driver files 772 adapters types of 764 types of fabric adapters 765 Adaptive Rate Limiting (ARL) 1224 add authentication card dialog box 980 Add Flow Defi
data 157 disabling 160 enabling 160 immediate 161 management server 157 reviewing events 162 roles and access levels 2174 starting 161 status, determining 480 switch configuration 636 viewing status 161 Backup Scheduler 1379, 1429, 1430 base switch, creating 964 blade processor links 989 blade processors configuring links 990 boot image repository and host adapters 774 backing up files 777 deleting image 776 downloading an image to a selected host 776 importing 775 boot images deleting from the Management a
zone databases 1205 concepts, FCIP 1216 configuration Allow/Prohibit Matrix activating 1312 deleting 1313 Allow/Prohibit Matrix , copying 1310, 1311 FICON CUP 1299 storage encryption privileges 977 storage port mapping 717 configuration backup scheduling 1379 configuration file searching 643 viewing 642 configuration files, saving 633, 635 configuration management roles and access levels 2173 configuration repository backup 636 saving status 1357 searching 1353 using to export the device configuration 1363
LSAN zone 1194 new members in LSAN zone LSAN zone creating new members 1196 storage array 718 threshold policies 1641 traffic isolation zone 1200 views 501 zone 1172 zone alias 1178 zone configuration 1181 zone databases 1187 zone members 1174 zone sets 1181 CSR exporting from properties 1148 submitting to a CA 996 CUP, FICON 1299 customized views, copying 504 customized views, deleting 504 customized views, editing 502 customizing the dashboard 261 customizing, product list columns 501, 502 D dashboard c
device tips configuring 174 device tips, turning on and off 177 device tips, viewing 177 diagnostics types of tests 767 dialog box iSCSI properties 2186 port properties 2188 storage properties 2184 directory structure overview, backing up 158 disabling bottleneck detection 1640 call home centers 563 default zone for fabrics 1177 fabric binding 1272 FCIP tunnels 1261, 1262 historical performance data collection 1615 login banner 187 port connectivity view filter 673 ports 672 traffic isolation zone 1202 traf
traffic isolation zone failover 1202 enabling backup 160 enabling connection utilization 1647 encryption certificate generation 990 configuration planning for the management application 988, 1045 configure dialog box 976 configuring in a multi-path environment 1099 gathering information before using the setup wizard 988, 1045 launching the encryption targets dialog box 1133 node initialization 990 preparation 1045 selecting mode for LUNs 1113 viewing and editing group properties 1149 encryption engine rebal
event filter assigning 567 assigning to a device 567 defining 566 overwriting 568 removing from device 569 searching for 569 event filtering, advanced 1911 event filters table removing event filters 569 event logs 1971 copying entries 1972 copying parts 1971 exporting entries 1972 viewing 1971 event management overview 1907 roles and access levels 2174 event notification configuring e-mail notification 1908 overview 1640 event notification, description 1908 event policies viewing events 1913 event types 790
advanced settings configuring 1250 connection properties viewing 1255 DSCP 1229 Ethernet connection troubleshooting 1267 Ethernet port properties viewing 1258 Fastwrite 1231 FC port properties viewing 1258 IPsec implementation 1227 L2CoS 1230 management roles and access levels 2175 performance graphs, Ethernet ports displaying 1263 performance graphs, FC ports displaying 1263 properties viewing 1256 QoS implementation 1229 services licensing 1216 Tape Pipelining 1231 tunneling 1216 tunnels configuring 1240
port connectivity view results 672 real time performance data 1610 finding assigned thresholds 1296 firmware activate for NOS 742, 1438 deleting files from repository 661 downloading 657 management, overview 656 overwriting 658 update for NOS 742, 1438 firmware management roles and access levels 2174 firmware repository deleting firmware files 661 displaying 659 importing into 660 first-time configurations 997 flyovers configuring 174 turning on and off 177 viewing 177 FSPF link cost calculation when ARL is
Help menu 2101, 2111, 2118 high availability deployment 999 high integrity fabric roles and access levels 2175 high integrity fabric configuration setttings 1315 high integrity fabrics (HIF), requirements 1299 historical performance data disabling collection 1615 enabling collection 1613 graphing 1615 overview 1612 saving graph configuration 1615 historical performance graph deleting 1620 host adapter discovery 767 host adapters adding a port configuration 778 and boot image repository 774 and connectivity
IP frames 1216 IP interfaces, configuring 1240 IP inventory reports detailed product report 2069, 2073 exporting and saving to a file 2066 information contained within 2066 IP address report 2079 IP subnet report 2079 layer 3 VLAN report 2078 MAC address report 2080 module report 2077 port VLAN report 2078 viewing 2066 IP routes, configuring 1240 IPsec FCIP 1227 IPSec policies configuring 1252 iSCSI devices, identifying inactive 678, 2188 iSCSI properties dialog box 2186 ISL protocol threshold 1282 adding 1
configuring 187 disabling 187 login security configuring 187 logon conflicts 1183 logs event 1971 LSAN zone creating 1194 LSAN zones activating 1197 LSAN zoning configuring 1193 overview 1192 roles and access levels 2175 LUN choosing to be added to an encryption target container 1113 M Main window master log 477 minimap 478 main window SAN tab 462 Management application server and client 3 management application main window 2, 462 user interface 1 Management application feature listing 30 Management applic
floating 479 resizing 479 modifying FCIP tunnels 1244 Monitor menu 2108, 2116 Monitoring requirements sFlow 1705 SNMP 1650 monitoring connection utilization 1646 end-to-end 1624 end-to-end, configuring 1625 end-to-end, displaying 1626 monitoring fabrics 51 monitoring pairs deleting 1628 refreshing 1627 monitoring statistics 767 MPLS Manager licenses 1466, 1500, 1504, 1515, 1516 MSTP adding an instance 1460 assigning an instance to a VLAN 1460 configuring on a product 1458 multi-path configuration for encryp
default background color, changing 509 displaying connections 507 group background color, changing 508 layout, changing 506 layout, overview 505 levels of detail 487 port display, changing 509 port label, changing 509 product label, changing 509 showing connected ports 674 viewing port types 674 viewing ports 674 zooming in 487 zooming out 487 port connection properties, viewing 675 port connectivity view disabling filter 673 enabling filter 673 filtering results 672 refreshing 671 resetting filter 673 view
Q QoS implementation in FCIP 1229 QoS priorities per FCIP circuit 1225 R Radius server configuring 590 RBAC user privileges 2151 RDR application considerations 1238 real time performance 1608 exporting data 1612, 1620 filtering data 1610 graph 1609 real time performance data thresholds 1640 real-time performance graph configure 1656 reassigning storage ports to storage array 719 redirection zones 1134 refreshing end-to-end monitoring pairs 1627 port optics view 681 zone databases 1188 refreshing the port c
switch configuration files 633, 635 zone databases to switch 1191 scheduling technical support information collection 2041 search names 184 WWN 185 searching configuration file 643 members in zones 1209 Potential Members list 1209 zones in zone configuration 1210 Zones list 1210 security configuring 185 roles and access levels 2174 security authentication configuring using the GUI 788 security tab encryption group properties security tab 1156 security tab on management application using to back up a master
modifying the definitions of registered traps 1925 registering 1924 reverting a trap to its default 1926 unregistering 1925 SNMP v3, adding and editing credentials 1921 software configuration 191 software configuration properties roles and access levels 2174 software files obtaining through the image repository 1425 software image management 1429 software images automatically retrieving from devices 1430 deleting from the Management application 1431 manually importing 1429 reverting to previously-archived 1
description 791 syslogs adding a recipient 1927 removing a recipient 1928 system collectors ediing 1663 editing 1663 system data collectors 1673 duplicating 1673 T tab Authentication (SMC) 591, 593, 596, 601, 602, 603 Services (SMC) 612 tab Ports (SMC) 589 tab Technical Support Information (SMC) 613 tab, Services (SMC) 586 table # Brocade events 2140 # CONSRV event 2139 # thermal event reason codes 2140 call home event 2146 features, user groups access levels 2173–2175, 2175–??, 2176–?? privileges and appl
threshold policies assigning 1644 copying 1644 creating 1641 deleting 1645 threshold prioities 1280 thresholds 1280 assigning 1291 editing 1292 finding specific 1296 overview 1640 removing 1297 viewing 1296 viewing on a specific device 1297 thresholds table removing thresholds 1298 TIN/TUP emulation 1254 tips, turning on and off 177 tips, viewing 177 TLS certificates 1008 tool tips, turning on and off 177 tool tips, viewing 177 toolbox 465, 474 tools adding 571 adding menu options 578 adding to device short
using from encryption group properties dialog 1132 V VDX 2740 embedded switch 743 VE_Ports 1240 VEX_Port 1240 view management 500 roles and access levels 2176 View menu 2101, 2103, 2112 view options, changing 486 View window product list 466 View window, toolbox 465, 474 viewing call home status 564 configuration file 642 disabling port connectivity filter 673 enabling port connectivity filter 673 event logs 1971 events 1913 FCIP connection properties 1255 FCIP Ethernet port properties 1258 FCIP FC port pr
Web Tools, launching 573 Windows authentication configuring 601 Windows installation ODBC driver installation 24 WWN searching by 185 Z zeroization setting 1132 zeroizing effects of using on encryption engine 1131 zone adding to comnfiguration 1182 alias 1178 creating 1172 creating LSAN 1194 database size 1170 merging 1170 removing 1182 traffic isolation, adding members 1200 traffic isolation, creating 1200 traffic isolation, disabling 1202 traffic isolation, disabling failover 1203 traffic isolation, enab
generating 2064 zoning set edit limits, roles and access levels 2175 zooming in 487 zooming out 487 2630 Brocade Network Advisor SAN + IP User Manual 53-1003155-01