
User Manual v12.3.0 Owner manual

Brocade Network Advisor SAN + IP User Manual 1613
53-1003155-01
SAN historical performance data
43
• Use the Round Robin Database (RRD) style aging scheme.
• Enable a granularity for data collection:
- 5 minute granularity for last 8 days
- 30 minutes granularity for last 14 days
- 2 hour granularity for last 30 days
- 1 day granularity for last 730 days
• Plot advanced monitoring service (AMS) violation events received during the chart time range
and Master Log events logged on the same product as the measure being plotted.
• Generate reports. For instructions on generating reports, refer to “Generating SAN
performance reports” on page 2063.
• Configure the graph display using right-click menu options. For more information refer to
“Configuring the graph display” on page 1617.
Enabling SAN-wide historical performance collection
To enable historical performance collection, select Monitor > Performance > Historical Data
Collection.
The Fabric Selector dialog box displays with Enable SAN Wide enabled by default. This enables
historical performance data collection for all fabrics in the SAN.
NOTE
After enabling historical data collection, information for switches, ports, and FCIP tunnels also
displays in the IP Historical Graph/Tables dialog box. If available, click the IP tab, then select Monitor
> Performance > Historical Graphs/Tables.
Enabling historical performance collection for selected
fabrics
To enable historical performance collection for selected fabrics, complete the following steps.
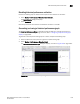
1. Select Monitor > Performance > Historical Data Collection.
The Fabric Selector dialog box displays.
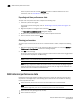
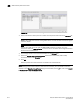
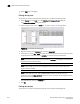
2. Select Enable Selected.
The Historical Data Collection dialog box displays, as shown in Figure 727 on page 1614.