
User Manual v12.3.0 Owner manual

1618 Brocade Network Advisor SAN + IP User Manual
53-1003155-01
SAN historical performance data
43
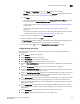
• Select Print to print the graph.
Filtering data by ports
To filter data for a historical performance graph by ports, complete the following steps.
1. Select Custom from the From list on the Historical Performance Graph dialog box.
The Custom Port Selector dialog box displays.
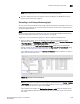
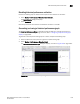
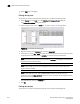
2. Select the type of ports from the Show list, as shown in Figure 729 on page 1618.
FIGURE 729 Custom Port Selector dialog box
3. Right-click a device in the Available list and select Expand All.
4. Select the ports (press Ctrl or Shift and then click to select multiple ports) from which you want
to gather performance data from the Available list and click the right arrow button.
NOTE
For E_Port trunks, the port node can be moved to the Selected list along with the occupied or
connected ports and attached ports.
NOTE
Devices with 10 GbE ports must be running Fabric OS 6.4.1 or later to obtain the correct
TE_Port statistics (TX/RX).
NOTE
Devices with 10GE ports must have the RMON MIB enabled on the switch. For more
information about the rmon collection command, refer to the Fabric OS Converged Enhanced
Ethernet Command Reference.
The selected ports move to the Selected list.
5. Click OK.
Filtering data by time
To filter data for a historical performance graph by time, complete the following steps.