
User Manual v12.3.0 Owner manual


Brocade Network Advisor SAN + IP User Manual 1619
53-1003155-01
SAN historical performance data
43
1. Click Monitor > Performance > Historical Graph.
The Historical Performance Graph dialog box displays.
2. Select Custom from the For list.
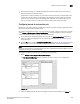
The Custom Time Frame dialog box displays as shown in Figure 730 on page 1619. Perform
one of the following steps:
• Select the Last option and enter the number of minutes, hours, or days that you want
to monitor.
• Select the From option and enter the start date and time (in MM DD YYYY HH MM
AM/PM format) that you want to monitor.
• Select the To option and enter the end date and time (in MM DD YYYY HH MM AM/PM
format) that you want to monitor.
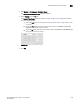
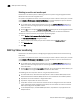
FIGURE 730 Custom Time Frame dialog box
3. Click OK.