
User Manual v12.3.0 Owner manual

Brocade Network Advisor SAN + IP User Manual 317
53-1003155-01
Inventory
7
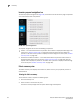
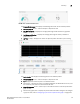
FIGURE 132 Product Performance area
The Product Performance area displays the following information for the selected product:
• Collapse/Expand button — Click to collapse or expand the view.
• Avg. CPU Utilization — Displays the average percentage of CPU utilization in graphical
format.
• Avg. Memory Utilization — Displays the average percentage of memory utilization in
graphical format.
• Up Time (in days) — Displays the number of days the product has been up and running.
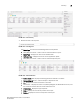
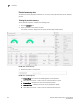
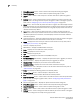
FIGURE 133 Port Details area
The Ports Details area displays the following data for the selected product:
• Collapse/Expand button — Click to collapse or expand the view.
• All — Displays the number of ports in the selected switch.
• Status icons — Displays the status icon (Healthy, Marginal, Not Reachable and so on) and
the number of ports with that status beneath the icon.
• Show Performance button — Select a port in the table and click to show the performance
graph or table.
• Performance graph/table — Displays the performance data when configured. To configure
a graph or table, refer to “Configuring a port measure performance graph” on page 321.