
User Manual v12.3.0 Owner manual


Brocade Network Advisor SAN + IP User Manual 319
53-1003155-01
Inventory
7
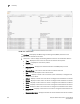
• Graph button — Click to show the performance data in a graph. The x-axis displays the time
scope you selected. The y-axis display depends on the flow measure you selected.
• Table button — Click to show the performance data in a table. The table includes the flow
measures you selected and the time the flow measure was collected.
• Unnamed check box — Select the check box for each flow you want to include in the graph.
Select the check box in the table header to select all flows in the table.
• Sub Flow Id — Displays the ID of the sub flow.
• Name — Displays the name of the flow defined in the flow definition.
• Frame Type — Displays the frame type defined in the flow definition.
• Ingress Port — Displays the ingress port defined in the flow definition.
• Egress Port — Displays the egress port defined in the flow definition.
• Source — Displays the port number defined in the flow definition. An * (asterisk) indicates
learned flows.
• Destination — Displays the port number defined in the flow definition. An * (asterisk)
indicates learned flows.
• Source Info — Displays the name of the source device defined in the flow definition. An *
(asterisk) indicates learned flows.
• Destination Info — Displays the name of the destination device defined in the flow
definition. An * (asterisk) indicates learned flows.
FIGURE 134 Violations table