
User Manual v12.3.0 Owner manual

Brocade Network Advisor SAN + IP User Manual 363
53-1003155-01
Chapter
8
Dashboard Management
In this chapter
•Dashboard overview . . . . . . . . . . . . . . . . . . . . . . . . . . . . . . . . . . . . . . . . . . . 363
•Default dashboards . . . . . . . . . . . . . . . . . . . . . . . . . . . . . . . . . . . . . . . . . . . . 380
•Status widgets . . . . . . . . . . . . . . . . . . . . . . . . . . . . . . . . . . . . . . . . . . . . . . . . 381
•Monitoring and Alerting Policy Suite/Fabric Watch widgets . . . . . . . . . . . . 397
•Performance monitors . . . . . . . . . . . . . . . . . . . . . . . . . . . . . . . . . . . . . . . . . 402
•User-defined performance monitors . . . . . . . . . . . . . . . . . . . . . . . . . . . . . . 432
•Traffic flow dashboard monitors. . . . . . . . . . . . . . . . . . . . . . . . . . . . . . . . . . 451
Dashboard overview
NOTE
Only devices in your area of responsibility (AOR) display in the dashboard.
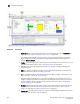
The Dashboard tab (Figure 154) displays the status widgets, performance monitors, and the
Master Log. You can also display additional status widgets and performance monitors, as needed.
The Management application has the following default dashboards: Product Status and Traffic,
SAN Port Health, and IP Port Health.
The dashboard provides a high-level overview of the network and the current states of managed
devices. This allows you to easily check the status of the devices on the network. The dashboard
also provides several features to help you quickly access reports, device configurations, and
system logs.
The dashboard updates regardless of the currently selected tab (SAN, IP, or Dashboard) or the SAN
or LAN size. However, data may become momentarily out of sync between the dashboard and other
areas of the application. For example, if you remove a product from the network while another user
navigates from the dashboard to a more detailed view of the product, the product may not appear
in the detailed view.