
User Manual v12.3.0 Owner manual


Brocade Network Advisor SAN + IP User Manual 413
53-1003155-01
Performance monitors
8
• RX Errors/sec — The number (error rate) of receive errors per second for the duration specified
in the monitor.
• RX Errors — The number (error count) of receive errors.
• TX Errors/sec — The number (error rate) of transmit errors for the duration specified in the
monitor.
• TX Errors — The number (error count) of transmit errors.
• Product — The product affected by this monitor per second.
• Type — The type of port (for example, U-Port).
• Identifier — The port identifier.
• Port Number — The port number.
• State — The port state (for example, Enabled).
• Status — The port status (for example, Up).
• Refreshed — The time of the last update for the monitor.
To customize the monitor to display data by a selected time frame as well as customize the display
options, refer to “Editing a preconfigured performance monitor” on page 431.
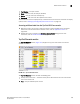
Accessing additional data from the Top Port Errors monitor
• Right-click a row in the monitor to access the shortcut menu available for the associated
device. For more information about shortcut menus, refer to “Application menus” on
page 2101.
• Double-click a row to navigate to the Historical Graphs/Tables dialog box. For more
information, refer to “Performance Data” on page 1601.
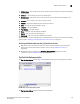
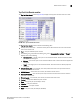
Top Port Link Failures monitor
The Top Port Link Failures monitor (Figure 180) displays the top ports with link failures in a table.
FIGURE 180 Top Port Link Failures monitor
The Top Port Link Failures monitor includes the following data: