
User Manual v12.3.0 Owner manual


Brocade Network Advisor SAN + IP User Manual 427
53-1003155-01
Performance monitors
8
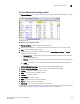
• Max — The maximum value of the measure in the specified time range.
• Fabric — The fabric to which the device belongs.
• Product Type — The type of product (for example, switch).
• State — The product state (for example, Offline).
• Status — The product status (for example, Reachable).
• Tag — The product tag.
• Serial # — The serial number of the product.
• Model — The product model.
• Port Count — The number of ports on the product.
• Firmware — The firmware level running on the product.
• Location — The location of the product.
• Contact — A contact name for the product.
• Refreshed — The time of the last update for the monitor.
To customize the monitor to display data by a selected time frame as well as customize the display
options, refer to “Editing a preconfigured performance monitor” on page 431.
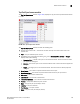
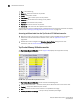
Accessing additional data from the Top Product Memory Utilization monitor
• Right-click a row in the monitor to access the shortcut menu available for the associated
device. For more information about shortcut menus, refer to “Application menus” on
page 2101.
• Double-click a row to navigate to the Historical Graphs/Tables dialog box. For more
information, refer to “Performance Data” on page 1601.
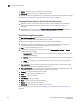
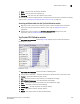
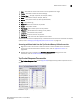
Top Product Response Time monitor
The Top Product Response Time monitor (Figure 189) displays the top product response time in a
table.
FIGURE 189 Top Product Response Time monitor