
User Manual v12.3.0 Owner manual


438 Brocade Network Advisor SAN + IP User Manual
53-1003155-01
User-defined performance monitors
8
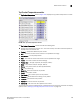
By default, ports display sorted by the Measure_Type value (Top ports sort from highest to
lowest and bottom ports sort lowest to highest). Click a column head to sort the columns by
that value.
• Product — The product affected by this monitor.
• Type — The type of port (for example, U-Port).
• Identifier — The port identifier.
• Port Number — The port number.
• State — The port state (for example, Enabled).
• Status — The port status (for example, Up).
• Refreshed — The time of the last update for the monitor.
To configure a port performance monitor, refer to “Configuring a user-defined port performance
monitor” on page 444.
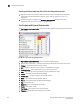
Accessing additional data from top or bottom port monitors
• (SAN ports) In a Top N or Bottom N monitor, double-click a row or right-click a row and select
Show Graph/Table to navigate to the Custom: Historical Performance Graph dialog box for the
selected measures. For more information, refer to “Generating and saving a historical
performance graph” on page 1615.
• (IP ports) In a Top N or Bottom N monitor, double-click a row or right-click a row and select
Show Graph/Table to navigate to the Historical Graphs/Tables dialog box for the selected
measures. For more information, refer to “Performance Data” on page 1601.
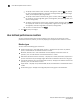
Distribution performance monitors
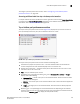
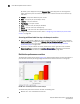
The distribution performance monitor (Figure 194) displays the distribution (number) of products or
ports for each of the five percentage ranges defined for the selected measure in a bar graph.
FIGURE 194 Distribution performance monitor example
The distribution performance monitor includes the following data:
• Monitor title — The user-defined monitor title.