
User Manual v12.3.0 Owner manual


454 Brocade Network Advisor SAN + IP User Manual
53-1003155-01
Traffic flow dashboard monitors
8
Traffic flow performance graph monitor
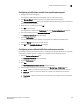
The traffic flow performance monitors display (Figure 196) the selected measures in a chart.
FIGURE 196 Traffic flow performance graph monitor example
The traffic flows performance monitor includes the following data:
• Monitor title — The user-defined monitor title.
• Value (y-axis) — The number of objects affected by the selected measure.
• Time (x-axis) — The time the monitor collected the data.
• Legend (below the x-axis) — The line color and the associated data that each line represents.
Accessing additional data from traffic flows performance graph monitors
• Place the cursor on a data point in graph line to view details.
• Right-click the graph to access the graph shortcut menu (refer to “Configuring the performance
graph” on page 1656).