
User Manual v12.3.0 Owner manual


Brocade Network Advisor SAN + IP User Manual 455
53-1003155-01
Traffic flow dashboard monitors
8
Top or bottom traffic flow performance monitor
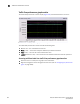
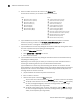
The top or bottom traffic flow performance monitors (Figure 197) top or bottom number of flows for
the selected measure in a table.
FIGURE 197 Top traffic flow monitor example
The top or bottom flow performance monitor includes the following data:
• Threshold icon/object count/monitor title — The color associated with the threshold and the
number of objects within that threshold are displayed next to the monitor title.
• Flow Name — The name of the flow.
• Sub Flow ID — The sub-flow identifier.
• Measure_Type — The percentage bar of the selected measure. For a list of selected measures,
refer to “Traffic flow measures” on page 452.
By default, flows display sorted by the Measure_Type value (top flows sort from highest to
lowest and bottom flows sort lowest to highest). Click a column head to sort the columns by
that value.
• Product — The device name.
• Source — The source device identifier.
• Destination — The destination device identifier.
• Feature — The active feature for the sub-flow definition. Valid values include: Generator,
Monitor, or Mirror.
• Rx Port — The receive (ingress) port.
• Tx Port — The transmit (egress) port.
• LUN — The LUN values defined in the flow.
• Bi-direction — Whether or not the flow is bi-directional. Valid values are Yes or No.
• Flow Definition Persistence — Whether or not to persist flow definition over device reboot.
• SCSI Commands — List of provisioned SCSI commands.
• Size — The size of the frame payload.
• Pattern — The pattern of the frame payload.