53-1003154-01 11 July 2014 Brocade Network Advisor SAN User Manual Supporting Network Advisor 12.3.
Copyright © 2010-2012 Brocade Communications Systems, Inc. All Rights Reserved. Brocade, Brocade Assurance, the B-wing symbol, DCX, Fabric OS, MLX, SAN Health, VCS, and VDX are registered trademarks, and AnyIO, Brocade One, CloudPlex, Effortless Networking, ICX, NET Health, OpenScript, and The Effortless Network are trademarks of Brocade Communications Systems, Inc., in the United States and/or in other countries.
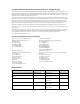
Title Summary of changes Date Brocade Network Advisor SAN User Manual 53-1002696-01 Updated for Network Advisor 12.0.0. December 2012 Brocade Network Advisor SAN User Manual 53-1002948-01 Updated for Network Advisor 12.1.0. July 2013 Brocade Network Advisor SAN User Manual 53-1003057-01 Updated for Network Advisor 12.2.0. January 2014 Brocade Network Advisor SAN User Manual 53-1003154-01 Updated for Network Advisor 12.3.0.
iv Brocade Network Advisor SAN User Manual 53-1003154-01
Contents About This Document How this document is organized . . . . . . . . . . . . . . . . . . . . . . . . . . . .xliii Supported hardware and software . . . . . . . . . . . . . . . . . . . . . . . . . . xlv What’s new in this document . . . . . . . . . . . . . . . . . . . . . . . . . . . . . .xlviii Document conventions . . . . . . . . . . . . . . . . . . . . . . . . . . . . . . . . . . . .xlix Text formatting . . . . . . . . . . . . . . . . . . . . . . . . . . . . . . . . . . . . . .
Connecting to the database using the ODBC client (Linux systems) . . . . . . . . . . . . . . . . . . . . . . . . . . . . . . . . . 23 Changing the database user password . . . . . . . . . . . . . . . . . . . 25 Supported open source software products. . . . . . . . . . . . . . . . . . . . 26 SAN feature-to-firmware requirements . . . . . . . . . . . . . . . . . . . . . . . 29 Chapter 2 Patches Installing a patch. . . . . . . . . . . . . . . . . . . . . . . . . . . . . . . . . . . . . . . . .
Troubleshooting host discovery. . . . . . . . . . . . . . . . . . . . . . . . . . 66 VM Manager discovery . . . . . . . . . . . . . . . . . . . . . . . . . . . . . . . . . . . . 67 VM Manager discovery requirements . . . . . . . . . . . . . . . . . . . . 67 Discovering a VM manager . . . . . . . . . . . . . . . . . . . . . . . . . . . . . 67 Editing a VM manager . . . . . . . . . . . . . . . . . . . . . . . . . . . . . . . . . 69 Excluding a host from VM manager discovery . . . . . . . . . . . . . .
Name settings . . . . . . . . . . . . . . . . . . . . . . . . . . . . . . . . . . . . . . . . . . . 94 Setting names to be unique . . . . . . . . . . . . . . . . . . . . . . . . . . . . 94 Setting names to be non-unique. . . . . . . . . . . . . . . . . . . . . . . . . 95 Fixing duplicate names . . . . . . . . . . . . . . . . . . . . . . . . . . . . . . . . 96 Viewing names . . . . . . . . . . . . . . . . . . . . . . . . . . . . . . . . . . . . . . . 97 Adding a name to an existing device . . . . . . . . . .
Chapter 5 User Account Management Users overview . . . . . . . . . . . . . . . . . . . . . . . . . . . . . . . . . . . . . . . . .139 Configuration requirements . . . . . . . . . . . . . . . . . . . . . . . . . . .139 Viewing configured users . . . . . . . . . . . . . . . . . . . . . . . . . . . . .139 User accounts . . . . . . . . . . . . . . . . . . . . . . . . . . . . . . . . . . . . . . . . . .143 Creating a new user account . . . . . . . . . . . . . . . . . . . . . . . . . .143 Editing a user account.
Chapter 6 Web Client Web client overview . . . . . . . . . . . . . . . . . . . . . . . . . . . . . . . . . . . . .165 License . . . . . . . . . . . . . . . . . . . . . . . . . . . . . . . . . . . . . . . . . . . .166 Dashboard . . . . . . . . . . . . . . . . . . . . . . . . . . . . . . . . . . . . . . . . . . . . .166 Dashboard expand navigation bar . . . . . . . . . . . . . . . . . . . . . .167 Dashboard toolbar . . . . . . . . . . . . . . . . . . . . . . . . . . . . . . . . . . .
Exporting the dashboard display . . . . . . . . . . . . . . . . . . . . . . .273 Printing the dashboard display . . . . . . . . . . . . . . . . . . . . . . . . .273 Attaching and detaching the Dashboard tab . . . . . . . . . . . . . .273 Customizing the dashboard scope . . . . . . . . . . . . . . . . . . . . . . 274 Setting the network scope. . . . . . . . . . . . . . . . . . . . . . . . . . . . . 274 Creating a customized network scope . . . . . . . . . . . . . . . . . . .
User-defined performance monitors . . . . . . . . . . . . . . . . . . . . . . . .324 Monitor types . . . . . . . . . . . . . . . . . . . . . . . . . . . . . . . . . . . . . .324 Measures . . . . . . . . . . . . . . . . . . . . . . . . . . . . . . . . . . . . . . . . . .324 Top or bottom product performance monitors. . . . . . . . . . . . .327 Top or bottom port performance monitors. . . . . . . . . . . . . . . .328 Distribution performance monitors . . . . . . . . . . . . . . . . . . . . .
Customizing the main window . . . . . . . . . . . . . . . . . . . . . . . . . . . . .368 Zooming in and out of the Connectivity Map . . . . . . . . . . . . .368 Showing levels of detail on the Connectivity Map . . . . . . . . . .369 Exporting the topology . . . . . . . . . . . . . . . . . . . . . . . . . . . . . . . .369 Customizing application tables . . . . . . . . . . . . . . . . . . . . . . . . .369 Product List customization . . . . . . . . . . . . . . . . . . . . . . . . . . . . . . . .
Testing the Call Home center connection . . . . . . . . . . . . . . . . . . . .403 Disabling a Call Home center . . . . . . . . . . . . . . . . . . . . . . . . . . . . . .403 Viewing Call Home status . . . . . . . . . . . . . . . . . . . . . . . . . . . . . . . . .404 Assigning a device to the Call Home center . . . . . . . . . . . . . . . . . .405 Removing a device from a Call Home center . . . . . . . . . . . . . . . . .405 Removing all devices and filters from a Call Home center. . . . . . .
Chapter 11 Server Management Console Server Management Console overview . . . . . . . . . . . . . . . . . . . . . .427 Launching the SMC on Windows . . . . . . . . . . . . . . . . . . . . . . .427 Launching the SMC on Linux . . . . . . . . . . . . . . . . . . . . . . . . . .428 Services tab. . . . . . . . . . . . . . . . . . . . . . . . . . . . . . . . . . . . . . . . . . . .428 Monitoring and managing Management application services . . . . . . . . . . . . . . . . . . . . . . . . . . . . . . . . .
Launching a remote SMIA configuration tool. . . . . . . . . . . . . .459 Service Location Protocol (SLP) support . . . . . . . . . . . . . . . . .459 Home tab . . . . . . . . . . . . . . . . . . . . . . . . . . . . . . . . . . . . . . . . . .463 Authentication tab . . . . . . . . . . . . . . . . . . . . . . . . . . . . . . . . . . .464 CIMOM tab . . . . . . . . . . . . . . . . . . . . . . . . . . . . . . . . . . . . . . . . .467 Certificate Management tab . . . . . . . . . . . . . . . . . . . . . . . . . .
Determining port status . . . . . . . . . . . . . . . . . . . . . . . . . . . . . .522 Viewing port optics. . . . . . . . . . . . . . . . . . . . . . . . . . . . . . . . . . .522 Port commissioning . . . . . . . . . . . . . . . . . . . . . . . . . . . . . . . . . . . . .524 Configuring port commissioning . . . . . . . . . . . . . . . . . . . . . . . .526 CIMOM servers. . . . . . . . . . . . . . . . . . . . . . . . . . . . . . . . . . . . . .526 Registering a CIMOM server . . . . . . . . . . . . . . . . . .
Chapter 14 Storage Port Mapping Storage port mapping overview . . . . . . . . . . . . . . . . . . . . . . . . . . . .561 Creating a storage array . . . . . . . . . . . . . . . . . . . . . . . . . . . . . . . . . .562 Adding storage ports to a storage array . . . . . . . . . . . . . . . . . . . . .562 Unassigning a storage port from a storage array . . . . . . . . . . . . . .563 Reassigning mapped storage ports . . . . . . . . . . . . . . . . . . . . . . . . .563 Editing storage array properties. . . . . .
Role-based access control . . . . . . . . . . . . . . . . . . . . . . . . . . . . . . . .593 Host adapter management privileges . . . . . . . . . . . . . . . . . . .593 Host adapter administrator privileges . . . . . . . . . . . . . . . . . . .593 Host performance management . . . . . . . . . . . . . . . . . . . . . . . . . . .594 Host security authentication . . . . . . . . . . . . . . . . . . . . . . . . . . . . . .595 Configuring security authentication using the Management application . . . . . . . . .
QoS configuration . . . . . . . . . . . . . . . . . . . . . . . . . . . . . . . . . . . . . . .620 Priority-based flow control . . . . . . . . . . . . . . . . . . . . . . . . . . . . .620 Creating a DCB map . . . . . . . . . . . . . . . . . . . . . . . . . . . . . . . . .621 Editing a DCB map . . . . . . . . . . . . . . . . . . . . . . . . . . . . . . . . . . .622 Deleting a DCB map. . . . . . . . . . . . . . . . . . . . . . . . . . . . . . . . . .
Chapter 17 Security Management Layer 2 access control list management. . . . . . . . . . . . . . . . . . . . .653 Fabric OS Layer 2 ACL configuration . . . . . . . . . . . . . . . . . . . .653 Creating a Layer 2 ACL from a saved configuration. . . . . . . . .660 Deleting a Layer 2 ACL configuration from the application. . .661 Deleting a Layer 2 ACL configuration from the switch. . . . . . .661 Security configuration deployment . . . . . . . . . . . . . . . . . . . . . . . . .
Deregistering an authentication card . . . . . . . . . . . . . . . . . . .700 Setting a quorum for authentication cards . . . . . . . . . . . . . . .700 Using system cards . . . . . . . . . . . . . . . . . . . . . . . . . . . . . . . . . .701 Enabling or disabling the system card requirement . . . . . . . .702 Registering system cards from a card reader . . . . . . . . . . . . .702 Deregistering system cards . . . . . . . . . . . . . . . . . . . . . . . . . . .703 Using smart cards . . . . . . . . . . . . .
Copying the local CA certificate for a clustered ESKM/SKM appliance . . . . . . . . . . . . . . . . . . . . . . . . . . . . . . . .730 Adding ESKM/SKM appliances to the cluster . . . . . . . . . . . . .730 Signing the encryption node KAC certificates . . . . . . . . . . . . .731 Importing a signed KAC certificate into a switch . . . . . . . . . . .732 ESKM/SKM key vault high availability deployment . . . . . . . . .732 Data Encryption Keys. . . . . . . . . . . . . . . . . . . . . . . . . . . . . . . . .
Configuring key vault settings for IBM Tivoli Key Lifetime Manager (TKLM) . . . . . . . . . . . . . . . . . . . . . . . . . . . . .789 Configuring key vault settings for Key Management Interoperability Protocol. . . . . . . . . . . . . . . . . . . . . . . . . . . . . . .794 Understanding configuration status results. . . . . . . . . . . . . . .800 Adding a switch to an encryption group. . . . . . . . . . . . . . . . . . . . . .801 Replacing an encryption engine in an encryption group . . . . . . . .
Creating a new master key . . . . . . . . . . . . . . . . . . . . . . . . . . . .849 Security settings . . . . . . . . . . . . . . . . . . . . . . . . . . . . . . . . . . . . . . . .850 Zeroizing an encryption engine . . . . . . . . . . . . . . . . . . . . . . . . . . . .850 Setting zeroization . . . . . . . . . . . . . . . . . . . . . . . . . . . . . . . . . . .851 Using the Encryption Targets dialog box . . . . . . . . . . . . . . . . . . . . .851 Redirection zones . . . . . . . . . . . . . . . . . . . .
Creating a member in a zone . . . . . . . . . . . . . . . . . . . . . . . . . .892 Removing a member from a zone. . . . . . . . . . . . . . . . . . . . . . .893 Renaming a zone . . . . . . . . . . . . . . . . . . . . . . . . . . . . . . . . . . . .893 Deleting a zone . . . . . . . . . . . . . . . . . . . . . . . . . . . . . . . . . . . . .894 Duplicating a zone . . . . . . . . . . . . . . . . . . . . . . . . . . . . . . . . . . .894 Customizing the zone member display. . . . . . . . . . . . . . . . . . .
Disabling failover on a Traffic Isolation zone . . . . . . . . . . . . . .920 Boot LUN zones . . . . . . . . . . . . . . . . . . . . . . . . . . . . . . . . . . . . . . . . .921 Creating a Boot LUN zone . . . . . . . . . . . . . . . . . . . . . . . . . . . . .921 Modifying a Boot LUN zone . . . . . . . . . . . . . . . . . . . . . . . . . . . .922 Deleting a Boot LUN zone . . . . . . . . . . . . . . . . . . . . . . . . . . . . .923 Zoning administration. . . . . . . . . . . . . . . . . . . . . . . . . . . .
FCIP Fastwrite and Tape Acceleration . . . . . . . . . . . . . . . . . . .948 FICON emulation features . . . . . . . . . . . . . . . . . . . . . . . . . . . . . . . .949 IBM z/OS Global Mirror (z Gm) emulation . . . . . . . . . . . . . . . .949 Tape write pipelining . . . . . . . . . . . . . . . . . . . . . . . . . . . . . . . . .950 Tape read pipelining . . . . . . . . . . . . . . . . . . . . . . . . . . . . . . . . .950 Teradata pipelining . . . . . . . . . . . . . . . . . . . . . . . . . . . . . . . . .
Chapter 23 Fabric Binding Fabric Binding overview . . . . . . . . . . . . . . . . . . . . . . . . . . . . . . . . . .985 Viewing fabric binding membership . . . . . . . . . . . . . . . . . . . . .985 Enabling fabric binding . . . . . . . . . . . . . . . . . . . . . . . . . . . . . . .987 Disabling fabric binding. . . . . . . . . . . . . . . . . . . . . . . . . . . . . . .988 Adding switches to the fabric binding membership list . . . . .989 Adding detached devices to the fabric binding membership list . .
Chapter 25 FICON Environments FICON configurations . . . . . . . . . . . . . . . . . . . . . . . . . . . . . . . . . . .1017 Configuring a switch for FICON operation . . . . . . . . . . . . . . . . . . .1018 Planning the configuration . . . . . . . . . . . . . . . . . . . . . . . . . . 1018 Configuring the switch . . . . . . . . . . . . . . . . . . . . . . . . . . . . . 1020 Configuring FICON display . . . . . . . . . . . . . . . . . . . . . . . . . . . . . . 1025 Configuring an Allow/Prohibit Matrix . . .
Chapter 27 Fibre Channel Troubleshooting FC troubleshooting . . . . . . . . . . . . . . . . . . . . . . . . . . . . . . . . . . . . 1053 Tracing FC routes . . . . . . . . . . . . . . . . . . . . . . . . . . . . . . . . . 1054 Troubleshooting device connectivity. . . . . . . . . . . . . . . . . . . 1056 Confirming Fabric Device Sharing. . . . . . . . . . . . . . . . . . . . . .1057 Troubleshooting port diagnostics . . . . . . . . . . . . . . . . . . . . . 1058 Configuring link traffic test parameters . . .
Limitations of bottleneck detection . . . . . . . . . . . . . . . . . . . 1102 Enabling bottleneck alerts and configuring alert parameters . . . . . . . . . . . . . . . . . . . . . . . . . . . . . . . . . . 1102 Inheriting alert parameters from a switch . . . . . . . . . . . . . . 1105 Copying alert parameters from one switch or port to another . . . . . . . . . . . . . . . . . . . . . . . . . . . . . . . . . . . . 1105 Displaying bottleneck statistics . . . . . . . . . . . . . . . . . . . . . .
XISL and backbone E_Port monitors . . . . . . . . . . . . . . . . . . . 1174 Flow Generator . . . . . . . . . . . . . . . . . . . . . . . . . . . . . . . . . . . . . . . .1177 Flow Generator setup . . . . . . . . . . . . . . . . . . . . . . . . . . . . . . .1177 Flow Generator limitations . . . . . . . . . . . . . . . . . . . . . . . . . . .1178 SIM-Ports . . . . . . . . . . . . . . . . . . . . . . . . . . . . . . . . . . . . . . . . .1179 Creating a Flow Generator flow definition . . . . . . . . . . . . .
Viewing configuration policy manager status . . . . . . . . . . . . . . . 1238 Viewing existing configuration policy managers . . . . . . . . . . . . . 1239 Adding a configuration policy manager . . . . . . . . . . . . . . . . . . . . 1240 Configuration policy manager scheduling . . . . . . . . . . . . . . . . . . 1246 Editing a configuration policy manager . . . . . . . . . . . . . . . . . . . . .1247 Deleting a configuration policy manager. . . . . . . . . . . . . . . . . . .
Configuring event actions for Snort messages . . . . . . . . . . 1293 Pseudo events . . . . . . . . . . . . . . . . . . . . . . . . . . . . . . . . . . . . . . . . Displaying pseudo event definitions . . . . . . . . . . . . . . . . . . Creating pseudo event definitions . . . . . . . . . . . . . . . . . . . . Setting pseudo event policies . . . . . . . . . . . . . . . . . . . . . . . . Filtering pseudo event traps . . . . . . . . . . . . . . . . . . . . . . . . .
Chapter 33 Monitoring and Alerting Policy Suite Monitoring and Alerting Policy Suite overview . . . . . . . . . . . . . . 1327 MAPS role-based access control. . . . . . . . . . . . . . . . . . . . . . 1328 Enabling MAPS on a device. . . . . . . . . . . . . . . . . . . . . . . . . . 1329 MAPS interoperability with other features. . . . . . . . . . . . . . . . . . 1330 Fabric Watch. . . . . . . . . . . . . . . . . . . . . . . . . . . . . . . . . . . . . . 1330 MAPS category, object, and measure hierarchy . .
MAPS violations. . . . . . . . . . . . . . . . . . . . . . . . . . . . . . . . . . . . . . . .1374 MAPS events . . . . . . . . . . . . . . . . . . . . . . . . . . . . . . . . . . . . . . . . . .1376 Viewing MAPS events. . . . . . . . . . . . . . . . . . . . . . . . . . . . . . . .1376 MAPS integration with other features . . . . . . . . . . . . . . . . . . . . . 1379 Chapter 34 Chapter 35 Technical Support Server and client support save . . . . . . . . . . . . . . . . . . . . . . . . . .
Appendix A Application menus Dashboard main menus . . . . . . . . . . . . . . . . . . . . . . . . . . . . . . . . .1411 SAN main menus. . . . . . . . . . . . . . . . . . . . . . . . . . . . . . . . . . . . . . .1412 SAN shortcut menus . . . . . . . . . . . . . . . . . . . . . . . . . . . . . . . . . . . 1422 Appendix B Call Home Event Tables Appendix C Event Categories Link incident events . . . . . . . . . . . . . . . . . . . . . . . . . . . . . . . . . . . 1443 Product status events . . . . . . . . .
Appendix F Regular Expressions Appendix G Troubleshooting Application Configuration Wizard troubleshooting . . . . . . . . . . . 1502 Browser troubleshooting. . . . . . . . . . . . . . . . . . . . . . . . . . . . . . . . 1502 Client browser troubleshooting . . . . . . . . . . . . . . . . . . . . . . . . . . 1503 Discovery troubleshooting . . . . . . . . . . . . . . . . . . . . . . . . . . . . . . 1504 Fabric tracking troubleshooting . . . . . . . . . . . . . . . . . . . . . . . . . .
EE_MONITOR_STATS_30MIN_INFO . . . . . . . . . . . . . . . . . . . .1766 EE_MONITOR_STATS_2HOUR_INFO . . . . . . . . . . . . . . . . . . . .1766 EE_MONITOR_STATS_1DAY_INFO . . . . . . . . . . . . . . . . . . . . . .1767 TE_PORT_STATS_5MIN_INFO . . . . . . . . . . . . . . . . . . . . . . . . .1767 TE_PORT_STATS_30MIN_INFO . . . . . . . . . . . . . . . . . . . . . . . .1768 TE_PORT_STATS_2HOUR_INFO. . . . . . . . . . . . . . . . . . . . . . . .1768 TE_PORT_STATS_1DAY_INFO . . . . . . . . . . . . . . . . . . .
ROLE_PRIVILEGE_INFO . . . . . . . . . . . . . . . . . . . . . . . . . . . . . 1818 PORT_PROFILE_INFO. . . . . . . . . . . . . . . . . . . . . . . . . . . . . . . 1819 PORT_PROFILE_INTERFACE_INFO . . . . . . . . . . . . . . . . . . . . 1819 PORT_PROFILE_MAC_INFO . . . . . . . . . . . . . . . . . . . . . . . . . . 1820 PORT_VLAN_INFO . . . . . . . . . . . . . . . . . . . . . . . . . . . . . . . . . 1820 PROTOCOL_VLAN_INFO . . . . . . . . . . . . . . . . . . . . . . . . . . . . . 1821 SFLOW. . . . . . . . . .
VCS_CLUSTER_MEMBER_INFO. . . . . . . . . . . . . . . . . . . . . . . RESET_VCS_LICENSED . . . . . . . . . . . . . . . . . . . . . . . . . . . . . TRILL_TRUNK_INFO . . . . . . . . . . . . . . . . . . . . . . . . . . . . . . . . WIRELESS_INTERFACE . . . . . . . . . . . . . . . . . . . . . . . . . . . . . WIRED_INTERFACE . . . . . . . . . . . . . . . . . . . . . . . . . . . . . . . . CEE_PORT_INFO . . . . . . . . . . . . . . . . . . . . . . . . . . . . . . . . . .
About This Document In this chapter • How this document is organized . . . . . . . . . . . . . . . . . . . . . . . . . . . . . . . . . xliii • Supported hardware and software. . . . . . . . . . . . . . . . . . . . . . . . . . . . . . . . . xlv • What’s new in this document . . . . . . . . . . . . . . . . . . . . . . . . . . . . . . . . . . . xlviii • Document conventions . . . . . . . . . . . . . . . . . . . . . . . . . . . . . . . . . . . . . . . . . xlix • Additional information . . . . . . . . . . . . .
• Chapter 14, “Storage Port Mapping,” provides instructions about how to create and assign properties to a storage device. • • • • Chapter 15, “Host Management,” provides information on how to configure an HBA. Chapter 16, “Fibre Channel over Ethernet,” provides information on how to configure FCoE. Chapter 17, “Security Management,” provides security configuration instructions. Chapter 18, “FC-FC Routing Service Management,” provides information on how to manage Fibre Channel Routing.
Supported hardware and software In those instances in which procedures or parts of procedures documented here apply to some devices but not to others, this guide identifies exactly which devices are supported and which are not. Although many different software and hardware configurations are tested and supported by Brocade Communications Systems, Inc. for Network Advisor 12.3.0, documenting all possible configurations and scenarios is beyond the scope of this document.
TABLE 1 Fabric OS-supported hardware (Continued) Device name Terminology used in documentation Firmware level required Brocade M6505 embedded switch 24-port, 16 Gbps embedded switch Fabric OS v7.2.0 or later Brocade 6510 switch 48-port, 16 Gbps switch Fabric OS v7.0.0 or later Brocade 6520 switch 96-port, 16 Gbps switch Fabric OS v7.1.0 or later Brocade 6547 embedded switch 48-port, 16 Gbps embedded switch Fabric OS v7.2.
TABLE 1 Fabric OS-supported hardware (Continued) Device name Terminology used in documentation Firmware level required Brocade DCX 1, 2 with FC10-6 Blades 8-slot Backbone Chassis with FC 10 - 6 ISL Blade Fabric OS v6.2.0 DCX 1, 2 with FS8-18 Blades 8-slot Backbone Chassis with Encryption Blade Fabric OS v6.1.1_enc or later 1, 2 with FX8-24 Blades 8-slot Backbone Chassis with 8 Gbps 12-FC port, 10 GbE ports, 2-10 GbE ports blade Fabric OS v6.3.
TABLE 1 Fabric OS-supported hardware (Continued) Device name Terminology used in documentation FX8-24 Blade 1, 2 8 Gbps Extension Blade Firmware level required 1 Professional can discover but not manage this device. Use the device’s Element Manager, which can be launched from the Connectivity Map, to manage the device. This device cannot be used as a Seed switch. 2 Professional Plus Trial and Licensed version can discover but not manage this device.
- Performance Data - Configuring a monitor from a performance graph IP real-time performance monitoring Traffic flow dashboard monitors VLAN Management VLAN Manager Port VLAN Information that was deleted: • - License support for Ethernet fabrics For further information about new features and documentation updates for this release, refer to the release notes. Document conventions This section describes text formatting conventions and important notice formats used in this document.
Key terms For definitions specific to Brocade and Fibre Channel, see the Brocade Glossary. For definitions of SAN-specific terms, visit the Storage Networking Industry Association online dictionary at: http://www.snia.org/education/dictionary Notice to the reader This document may contain references to the trademarks of the following corporations. These trademarks are the properties of their respective companies and corporations. These references are made for informational purposes only.
Other industry resources For additional resource information, visit the Technical Committee T11 website. This website provides interface standards for high-performance and mass storage applications for Fibre Channel, storage management, and other applications: http://www.t11.org For information about the Fibre Channel industry, visit the Fibre Channel Industry Association website: http://www.fibrechannel.
• Brocade 5000—On the switch ID pull-out tab located on the bottom of the port side of the switch • Brocade 7600—On the bottom of the chassis • Brocade 48000—Inside the chassis next to the power supply bays • Brocade DCX and DCX-4S—On the bottom right on the port side of the chassis 4. World Wide Name (WWN) Use the licenseIdShow command to display the WWN of the chassis.
Chapter Getting Started 1 In this chapter • User interface components . . . . . . . . . . . . . . . . . . . . . . . . . . . . . . . . . . . . . . . 1 • Management server and client. . . . . . . . . . . . . . . . . . . . . . . . . . . . . . . . . . . . . 3 • Accessibility features for the Management application . . . . . . . . . . . . . . . . 17 • PostgreSQL database . . . . . . . . . . . . . . . . . . . . . . . . . . . . . . . . . . . . . . . . . . . 21 • Supported open source software products . . . . .
1 User interface components 1 2 3 4 FIGURE 1 Main window 1. Menu bar — Lists commands you can perform on the Management application. The available commands vary depending on which tab (SAN or Dashboard) you select. For a list of available commands, refer to Appendix A, “Application menus”. 2. Toolbar — Provides buttons that enable quick access to dialog boxes and functions. The available buttons vary depending on which tab (SAN or Dashboard) you select.
Management server and client 1 Management server and client The Management application has two parts: the Server and the Client. The Server is installed on one machine and stores device-related information; it does not have a user interface. To view information through a user interface, you must log in to the Server through a Client. The Server and Clients may reside on the same machine, or on separate machines. If you are running Professional, the server and the client must be on the same machine.
1 Management server and client 5. Click OK on the Login Banner dialog box. The Management application displays. NOTE When you launch the Management application or navigate to a new view, the SAN tab displays with a gray screen over the Product List and Topology Map while data is loading. Launching a remote client NOTE For higher performance, use a 64-bit JRE. To launch a remote client, complete the following steps. 1.
Management server and client 7. 1 Click Login. 8. Click OK on the Login Banner dialog box. The Management application displays. NOTE When you launch the Management application or navigate to a new view, the SAN tab displays with a gray screen over the Product List and Topology Map while data is loading. Clearing previous versions of the remote client The remote client link in the Start menu does not automatically upgrade when you upgrade the Management application.
1 Management server and client FIGURE 3 Management application web client log in page 2. Enter your user name and password. NOTE Do not enter Domain\User_Name in the User ID field for LDAP server authentication. 3. Press Enter or click the log in arrow icon. 4. Click OK on the Login Banner. The Management application web client displays.
Management server and client 1 1. Choose one of the following options: • On Windows systems, select Start > Programs > Management_Application_Name 12.X.X > Management_Application_Name Configuration. • On UNIX systems, execute sh Install_Home/bin/configwizard on the terminal. 2. Click Next on the Welcome screen. 3. Click Yes on the confirmation message. 4. Complete the following steps on the FTP/SCP/SFTP Server screen. a.
1 Management server and client • • • • • Options dialog box (does not display all IP addresses) a. Select an address from the Server IP Configuration list. b. Select an address from the Switch - Server IP Configuration Preferred Address list.
Management server and client d. 1 Enter a port number in the Starting Port Number field (default is 24600). NOTE For Professional software, the server requires 15 consecutive free ports beginning with the starting port number. NOTE For Trial and Licensed software, the server requires 18 consecutive free ports beginning with the starting port number. e. Enter a port number in the Syslog Port Number field (default is 514).
1 Management server and client 11. Choose one of the following options: • If you configured authentication to CAC, enter your PIN in the CAC PIN field. • If you configured authentication to the local database, an external server (RADIUS, LDAP, or TACACS+) or a switch, enter your user name and password. The defaults are Administrator and password, respectively. NOTE Do not enter Domain\User_Name in the User ID field for LDAP server authentication. 12. Click Login. 13. Click OK on the Login Banner.
Management server and client 1 Disconnecting users To disconnect a user, complete the following steps. 1. Select Server > Active Sessions. The Active Sessions dialog box displays. 2. Select the user you want to disconnect and click Disconnect. 3. Click Yes on the confirmation message. The user you disconnected receives the following message: The Client has been disconnected by User_Name from IP_Address at Disconnected_Date_and_Time. 4. Click Close.
1 Management server and client TABLE 2 Server Properties Field/Component Description Java VM Vendor The Java Virtual Machine vendor. Java VM Version The Java Virtual Machine version running on the server. Server Name The server’s name. OS Architecture The operating system architecture on the server. OS Name The name of the operating system running on the server. OS Version The operating system version running on the server. Region The server’s geographical region.
Management server and client FIGURE 7 1 Port Status dialog box 2. Review the port status details: • Name — The Port name. Options include CIM Indication for Event Handling, CIM Indication for HCM Proxy, FTP, SCP/SFTP, SNMP Trap, Syslog, Web Server (HTTP), and Web Server (HTTPS). • Port # — The required port number. • Status — The status of the port. The status options are as follows: Success — The port is listening or bound to the server. Failed — The port fails to listen or bind to the server.
1 Management server and client • Communication Path — The “source” to “destination” vaules. Client and Server refer to the Management application client and server unless stated otherwise. Product refers to the Fabric OS, Network OS, or IronWare devices. • Open in Firewall — Whether the port needs to be open in the firewall.
Management server and client TABLE 3 1 Port usage and firewall requirements (Continued) Port Number Ports Transport Description Communication Path Open in Firewall 4431,2 HTTPS server TCP HTTPS (HTTP over SSL) server port if you use secure client server communication Client-Server Yes 4432 HTTPS (HTTP over SSL) server port if you use secure communication to the product Server–Product Yes 443 HTTPS (HTTP over SSL) server port if you use secure communication to the product and you do not u
1 Management server and client TABLE 3 Port usage and firewall requirements (Continued) Port Number Ports Transport Description Communication Path Open in Firewall 63432 sFlow UDP Receives sFlow data from products if you are monitoring with sFlow Product-Server Yes 246001,2 JBoss remoting connector port TCP Use for service location. Uses SSL for privacy. Client–Server Yes 246011,2 JBoss Transaction Services Recovery Manager port TCP Not used remotely.
Accessibility features for the Management application 1 Accessibility features for the Management application Accessibility features help users who have a disability, such as restricted mobility or limited vision, to use information technology products successfully. The following list includes the major accessibility features in the Management application: • Keyboard shortcuts • Look and Feel Keyboard shortcuts You can use the keystrokes shown in the table below to perform common functions.
1 Accessibility features for the Management application Look and feel customization You can configure the Management application to mimic your system settings as well as define the size of the font. ‘Look’ refers to the appearance of graphical user interface widgets and ‘feel’ refers to the way the widgets behave.
Product improvement 1 Changing the font size The Options dialog box enables you to change the font size for all components including the Connectivity map of the Management application interface. Font size changes proportionately in relation to the system resolution. For example, if the system resolution is 1024 x 768, the default font size would be 8 and large font size would be 10. 1. Select Server > Options. The Options dialog box displays. 2. Select Look and Feel in the Category list. 3.
1 Product improvement • Feature details - Feature name - Button identifier (such as OK, Help, or Cancel, and so on) Enabling product improvement data transfer To enable feature usage data transfer from the application, complete the following steps. 1. Select Server > Options. The Options dialog box displays. 2. Select Product Improvement in the Category list. 3. Select the Yes, I want to participate option. To view an example of the usage data, click View Example Data. 4.
PostgreSQL database 1 • Last transfer timestamp must be greater than 24 hours to avoid frequent data uploads. • Data must be available for transfer. Data availability is determined by the difference between the last data transfer and the current data. 8. The client requests a data transfer. If data is available, the server nominates the client to transfer data. Once nominated, any further upload requests are denied.
1 PostgreSQL database 5. Enter your username (default is dcmuser) in the Username field. 6. Enter your password (password) in the Password field. 7. Click OK on the New Server Registration dialog box. The pgAdmin III application displays. 8. To browse data in the database, complete the following steps. a. Expand the Tables tree in the Object browser pane. b. Right-click a table in the list and select View Data > View All Rows. 9.
PostgreSQL database 1 9. Click Finish. The PostgreSQL Unicode ODBC Driver (psqlODBC) Setup dialog box displays. 10. Enter a name for the data source in the Datasource field. 11. Enter the description of the database in the Description field. 12. Enter the name of the database in the Database field. 13. Select enable or disable from the SSL Mode list to specify whether or not to use SSL when connecting to the database. 14.
1 PostgreSQL database 3. Install the file to the usual location for your system’s application files (for example, /opt/PostgreSQL/psqlODBC) on the Installation Directory screen and click Next. NOTE If you select an invalid location, the ODBC driver is installed in a different location than where the ODBC executable drivers are located. 4. On the Ready to Install screen click Next. 5. On the Completing the psqlODBC Setup Wizard screen click Finish to complete the installation.
PostgreSQL database 1 4. On the Set up ODBC connection screen, complete the following steps. a. Click Browse. The datasource saved in the odbc.ini file is populated in the Datasource dialog box. b. Select the datasource and click OK on the Datasource dialog box. c. Click Next. 5. On the Set up user authentication screen, complete the following steps. a. Enter the database user name in the User name field. b. Select the Password required check box. c.
1 Supported open source software products If an error occurs and the password did not change, the following message displays: Error while updating password. Please try again. Press any key to continue. If the current password and new password are the same, the following message displays: Old and New passwords cannot be same. Use different password and try again. Press any key to continue.
Supported open source software products TABLE 7 1 Open source software third-party software products Open Source Software License Type ApacheCommonsIO 1.4 Apache License v2.0 ApacheCommonsJXPath 1.3 Apache License v2.0 ApacheCommonsLang 2.4 Apache License v2.0 ApacheCommonsLogging 0.4 Apache License v2.0 ApacheCommonsMath 2.0 Apache License v2.0 ApacheCommonsNet 2.0 Apache License v2.0 ApacheCommonsPool 1.5.4 Apache License v2.0 ApacheCommonsValidator 1.3.1 Apache License v2.
1 Supported open source software products TABLE 7 28 Open source software third-party software products Open Source Software License Type JavaTar2.5andTarTool1.4 public domain JaxenXpathLibrary 1.1.1 Jaxen License JbcParser 3.7 Math Parser License JBossApplicationServer 7.2.0 GA LGPL JBossWeb 2.1.9 GNU Lesser General Public License version 3 JCalendar 1.3.3 LGPL v2.1 JCommon 1.0.16 LGPL v2.1 JDOM 1.1.1 Apache Style JFreeChart 1.0.13 LGPL v2.1 JGoodiesForms 1.2.
SAN feature-to-firmware requirements TABLE 7 1 Open source software third-party software products Open Source Software License Type XML RPC 1.2-B1 Open Source YourKitJavaProfiler 9.5.1 YourKit License SAN feature-to-firmware requirements Use the following table to determine whether the Management application SAN features are only available with a specific version of the Fabric OS firmware as well as if there are specific licensing requirements.
1 SAN feature-to-firmware requirements TABLE 8 SAN feature to firmware requirements Feature Fabric OS Meta SAN Requires Fabric OS 5.2 or later for FC router and router domain ID configuration. Requires Fabric OS 6.0 or later in a mixed Fabric OS and M-EOS fabric. Requires Integrated Routing license. Performance Requires Fabric OS 5.0 or later for FC_ports, -end monitors, and marching ants. Requires Fabric OS 5.3 or later for GE_ports and FCIP tunnels. Requires Fabric OS 6.
Chapter 2 Patches In this chapter • Installing a patch . . . . . . . . . . . . . . . . . . . . . . . . . . . . . . . . . . . . . . . . . . . . . . . 31 • Uninstalling a patch. . . . . . . . . . . . . . . . . . . . . . . . . . . . . . . . . . . . . . . . . . . . . 32 Installing a patch The patch installer enables you to update the Management application between releases. Each patch installer includes the previous patches within a specific release. For example, patch F (11.X.
2 Uninstalling a patch 5. Click Upgrade. If the patch process is interrupted (for example, loss of power), you must restart the patch process. The patch installer performs the following functions: • Extracts patch files to the Install_Home folder. • Creates a back up (zip) of the original files to be updated and copies the zip file to the Install_Home\patch-backup directory (for example, Install_Home\patch-backup\na_11-3-0a.zip).
Uninstalling a patch 2 4. Open the restore.xml file from the extracted files. The artifacts (jar files, war files, and so on) you need to replace display as separate file tags in the restore.xml file. The location of each artifact in the extracted folder is detailed in the src value under each file tag. 5. Go to the location of the first artifact (as shown in the src value under the file tag). 6. Copy the artifact from the extracted folder to the source folder in the Install_Home/patch-backup directory.
2 34 Uninstalling a patch Brocade Network Advisor SAN User Manual 53-1003154-01
Chapter 3 Discovery In this chapter • SAN discovery overview. . . . . . . . . . . . . . . . . . . . . . . . . . . . . . . . . . . . . . . . . . • Viewing the fabric discovery state . . . . . . . . . . . . . . . . . . . . . . . . . . . . . . . . . • Troubleshooting fabric discovery . . . . . . . . . . . . . . . . . . . . . . . . . . . . . . . . . . • SAN Fabric monitoring. . . . . . . . . . . . . . . . . . . . . . . . . . . . . . . . . . . . . . . . . . . • SAN Seed switch . . . . . . . . . . . . . . . .
3 SAN discovery overview NOTE Professional Plus edition can discover up to 2,560 ports. NOTE Once a fabric is discovered an enclosure is formed for the Host having FDMI with symbolic name enabled.When FDMI name is same for the adapters (HBA and CNA) which are displayed through fabric discovery, auto enclosure will be displayed for the fabric/fabrics NOTE Professional Plus edition can discover, but not manage the Backbone chassis.
SAN discovery overview TABLE 9 3 Backbone Chassis discovery Device Professional Professional Plus Enterprise 4-slot Backbone Chassis as seed switch Yes Yes Yes 4-slot Backbone Chassis as member switch Yes Yes Yes 16 Gbps 8-slot Backbone Chassis as seed switch No No Yes 16 Gbps 8-slot Backbone Chassis as member switch Yes for discovery; however, it cannot be managed. Yes for discovery; however, it cannot be managed.
3 SAN discovery overview FIGURE 8 Discover Fabrics dialog box 2. Click Add to specify the IP addresses of the devices you want to discover. The Add Fabric Discovery dialog box displays. FIGURE 9 Add Fabric Discovery dialog box (IP Address tab) 3. Enter a name for the fabric in the Fabric Name field. 4. Enter an IP address (IPv4 or IPv6) for a device in the IP Address field.
SAN discovery overview 3 NOTE The Backbone Chassis cannot be used as seed switch to discover and manage edge fabrics. You must discover a seed switch from each edge fabric to discover and manage the edge fabric. NOTE The Backbone Chassis can only discover and manage the backbone fabric. NOTE Professional and Professional Plus editions cannot manage the Backbone Chassis. NOTE Professional edition can discover only 1 fabric. NOTE Professional Plus edition can discover up to 2,560 ports.
3 SAN discovery overview • Select the Manual option to configure SNMP and complete the following steps. a. Click the SNMP tab. FIGURE 10 Add Fabric Discovery dialog box (SNMP - v1 tab) b. Enter the duration (in seconds) after which the application times out in the Time-out (sec) field. c. Enter the number of times to retry the process in the Retries field. d. Select the SNMP version from the SNMP Version list. • If you selected v1, continue with step e.
SAN discovery overview j. Enter a user name in the User Name field. k. Enter a context name In the Context Name field. l. Select the authorization protocol in the Auth Protocol field. 3 m. Enter the authorization password in the Auth Password field. • If you selected Configure for 256-Port_Director_Name, go to step 7. • If you did not select Configure for 256-Port_Director_Name, continue with step n. 7. n. Select the privacy protocol in the Priv Protocol field. o.
3 SAN discovery overview 5. Enter the password for the switch in the Password field. 6. Click OK. on the Fabric_Name Edit Switches dialog box. The Credential Update Status dialog box displays. This dialog box displays the status of the change on the selected devices. If you selected a logical switch, the updated credentials will be applied to the other logical switches in the same chassis. • • • • • • • IP Address — The IP address of the device. WWN — The world wide name of the device.
SAN discovery overview 7. 3 Select the SNMP version from the SNMP Version list. • If you selected v1, continue with step 8. • If you select v3, the SNMP tab displays the v3 required parameters. Go to step 12. To discover a Virtual Fabric device, you must configure SNMPv3 and your SNMP v3 user account must be defined as a Fabric OS switch user. 8. Specify the Read option by selecting Default ‘public’ or Custom. 9. If you selected Custom, enter the community string in the Custom and Confirm Custom fields.
3 SAN discovery overview 4. Select the Automatic option. 5. Click OK on the Add Fabric Discovery dialog box. 6. Click Close on the Discover Fabrics dialog box. Rediscovering a fabric To refresh discovery of a fabric, complete the following steps. 1. Select Discover > Fabrics. The Discover Fabrics dialog box displays. 2. Select a fabric in the Discovered Fabrics table. 3. Click Rediscover. The application triggers all fabric and switch level collectors.
Viewing the fabric discovery state 3 4. Click OK on the confirmation message. The rediscovered fabric displays in the Discovered Fabrics table. 5. Click Close on the Discover Fabrics dialog box. Deleting a fabric To delete a fabric permanently from discovery, complete the following steps. 1. Select Discover > Fabrics. The Discover Fabrics dialog box displays. 2. Select one or more switches that you want to delete permanently from discovery in the Previously Discovered Addresses table. 3. Click Delete. 4.
3 Troubleshooting fabric discovery The Discovery Status field details the actual status message text, which varies depending on the situation. The following are samples of actual status messages: • Discovered: Seed Switch: Not registered for SNMP Traps • Discovered: Seed Switch: Not Manageable: Not registered for SNMP Traps • Discovered: Current seed switch is not recommended. Change Seed Switch.
Troubleshooting fabric discovery 3 Problem Resolution If you exceed your managed count limit, the Management application displays a “licensed exceeded” message on the topology. Perform one or more of the following actions to “Changing your network size” “Remove a device from active discovery” “Deleting a fabric” Changing your network size If you are at the maximum network size for your license, contact your preferred network provider. To change the size of your network, complete the following steps.
3 Troubleshooting fabric discovery Virtual Fabric discovery troubleshooting The following section state possible issues and the recommended solutions for Virtual Fabric discovery errors. Problem Resolution At the time of discovery, the seed switch is Virtual Fabric-enabled; however, the user does not have Chassis Admin role for the seed switch. At the time of discovery, the user does not have the Chassis Admin role for all other switches in the fabric.
SAN Fabric monitoring 3 SAN Fabric monitoring NOTE Monitoring is not supported on Hosts. The upper limit to the number of HBA and CNA ports that can be monitored at the same time is 32. The same upper limit applies if switch ports and HBA ports are combined. You can select switch ports and adapter ports from a maximum of ten devices. Fabric monitoring enables discovery of and data collection for the specified fabric and all associated devices.
3 SAN Fabric monitoring Stop monitoring of discovered fabrics NOTE Monitoring is not supported on Hosts. When you stop monitoring a fabric, the Management application performs the following actions: • • • • Stops all data collection for the fabric and all associated devices. Unregisters as SNMP trap recipient from the fabric and all associated devices. Unregisters as SYSLOG recipient from the fabric and all associated devices.
SAN Fabric monitoring 3 The following details the behavior that occurs when you unmonitor a switch: • If you unmonitor a switch, the switch does not display in the topology, but end devices connected to the switch continue to display in the product list and topology (with no connections). • If you segment an unmonitored switch, you cannot discover it separately until you accept changes in the original fabric.
3 SAN Fabric monitoring Resume monitoring of discovered fabrics NOTE Monitoring is not supported on Hosts. To monitor a fabric and all associated devices, complete the following steps. 1. Select Discovery > Fabrics. The Discover Fabrics dialog box displays. 2. Select the fabric you want to monitor from the Discovered Fabrics table. 3. Click Monitor. The Monitor Status dialog box displays with the status. NOTE If there is a unmonitored switch in the fabric, it stays unmonitored.
SAN Seed switch 3 SAN Seed switch The seed switch must be running a supported Fabric OS version and must be HTTP-reachable. Sometimes, the seed switch is auto-selected, such as when a fabric segments or when two fabrics merge. Other times, you are prompted (an event is triggered) to change the seed switch, such as in the following cases: • If, during fabric discovery, the Management application detects that the seed switch is not running a supported version, you are prompted to change the seed switch.
3 SAN Seed switch Seed switch requirements The seed switch must be running Fabric OS 5.0 or later. For a complete list of all supported Fabric OS hardware, refer to “Supported hardware and software” on page xlv. Seed switch failover The Management application collects fabric-wide data (such as, fabric membership, connectivity, name server information, zoning, and so on) using the seed switch.
Host discovery 3 3. Click Seed Switch. If the fabric contains other switches that are running the latest version and are also HTTP-reachable from the Management application, the Seed Switch dialog box appears. Otherwise, a message displays that you cannot change the seed switch. 4. Select a switch to be the new seed switch from the Seed Switch dialog box. You can select only one switch. Only switches that are running the latest Fabric OS version in the fabric are displayed.
3 Host discovery For Windows, the Emulex adapter discovery is based on Windows Management Instrumentation (WMI). Perform the following steps to configure HTTPS certificate validation. 1. Import the host certificate when the Enable Certificate Validation check box is selected. Discovery will occur successfully even without importing the certificate when the Enable Certificate Validation checkbox is not selected. 2.
Host discovery FIGURE 14 3 Add Host Adapters dialog box 3. (Optional) Enter a discovery request name (such as, Manual 06/12/2009) in the Discovery Request Name field. 4. Select Network Address from the list. 5. Enter the IP address (IPv4 or IPv6 formats) or host name in the Network Address field. 6. Click Add. The IP address or host name of the Host displays in the Host List. 7.
3 Host discovery 10. Enter your user name in the User ID field. The HCM agent default is admin. Leave this field blank for the CIM server. 11. Enter your password in the Password field. The HCM agent default is password. Leave this field blank for the CIM server. 12. Repeat step 5 through step 11 for each Host you want to discover. 13. Click OK on the Add Host Adapters dialog box. If an error occurs, a message displays. Click OK to close the error message and fix the problem.
Host discovery 3 5. Browse to the CSV file location. The CSV file must meet the following requirements: • Comma-separated IP addresses or host names • No commas within the values • No escaping supported For example, XX.XX.XXX.XXX, XX.XX.X.XXX, computername.company.com 6. Click Open. The CSV file is imported to the Add Host Adapters dialog box. During import, duplicate values are automatically dropped. When import is complete, the imported values display in the Host List.
3 Host discovery Importing Hosts from a fabric To discover a Host from a discovered fabric, complete the following steps. 1. Select Discover > Host Adapters. The Discover Host Adapters dialog box displays. 2. Click Add. The Add Host Adapters dialog box displays. FIGURE 16 Add Host Adapters dialog box 3. Enter a discovery request name (such as MyFabric) in the Discovery Request Name field. 4. Select Hosts in Fabrics from the list. 5. Select All fabrics or an individual fabric from the host list. 6.
Host discovery 3 8. Configure discovery authentication by choosing one of the following options: • To configure discovery with authentication, select the HTTPS option in Protocol • To configure discovery without authentication, select the HTTP option in Protocol. 9. Enter the port number in the Port field. The HCM agent default is 34568. The CIM server HTTPS default is 5989. The CIM server HTTP default is 5988. The WMI HTTPS default is 5986. The WMI HTTP default is 5985. 10.
3 Host discovery 3. Enter a discovery request name (such as MyVMManager) in the Discovery Request Name field. 4. Select Hosts from VM Manager from the list. 5. Select All VM or an individual VM from the list. 6. Click Add. All hosts that are part of a discovered VM Manager and have a registered host name display in the list. If no host with a registered host name exists, an error message displays. Click OK to close the error message. 7.
Host discovery FIGURE 18 3 Edit Host Adapters dialog box 3. Configure Host credentials by choosing one of the following options: • To configure HCM agent credentials, select the HCM agent option. Go to step 5. • To configure CIM server credentials, select the CIM server (ESXi only) option. Continue with step 4. • To configure WMI server credentials, select the Windows Management Instrumentation (WMI) option. Continue with step 4. If you do not need to configure Host credentials, skip to step 8. 4.
3 Host discovery Removing a host from active discovery If you decide you no longer want the Management application to discover and monitor a specific host, you can delete it from active discovery. Deleting a host also deletes the host data on the server (both system-collected and user-defined data) except for user-assigned names for the device port, device node, and device enclosure information. To delete a host from active discovery, complete the following steps. 1. Select Discover > Host Adapters.
Host discovery 3 Deleting a host from discovery To delete a host permanently from discovery, complete the following steps. 1. Select Discover > Host Adapters. The Discover Host Adapters dialog box displays. 2. Select the host you want to delete permanently from discovery in the Previously Discovered Addresses table. 3. Click Delete. 4. Click OK on the confirmation message. 5. Click Close on the Discover Host Adapters dialog box.
3 Host discovery • • • • • • HCM Agent unknown failure • • • • • • Discovered WMI authentication failed WMI connection failed WMI Unknown Error Discovery ignored. One or more adapters in the host are already a part of Host group {} Discovery ignored. One or more adapters in the host are already a part of auto/manual enclosure {}. Please delete the enclosure and try again. Discovering.... Rediscovering... Deleting....
VM Manager discovery 3 VM Manager discovery The Management application enables you to discover VM managers. VM Manager discovery requires vCenter Server 4.0 or later. NOTE vCenter discovery time is dynamically determined based on the number of hosts being managed by the vCenter. For every 50 hosts managed, the vCenter collection period increases 30 minutes. For 0-50 hosts managed, the collection duration is 30 minutes; for 50-100 hosts managed, the collection duration is one hour, and so on.
3 VM Manager discovery FIGURE 19 Discover VM Managers dialog box 2. Click Add. The Add VM Manager dialog box displays. FIGURE 20 Add VM Manager dialog box 3. Enter the IP address or host name in the Network Address field. 4. Enter the VM manager port number in the Port field. 5. Enter the VM manager username in the User ID field. 6. Enter the VM manager password Password field. 7.
VM Manager discovery 3 8. Select the Forward event to vCenter check box to enable event forwarding from the Management application to vCenter. Clear to disable event forwarding. 9. Click OK on the Add VM Manager dialog box. If an error occurs, a message displays. Click OK to close the error message and fix the problem. A VM manager displays in Discovered VM Managers table with pending status. To update the status from pending you must close and reopen the Discover VM Managers dialog box. 10.
3 VM Manager discovery 9. Refresh the Discover VM Managers list by clicking Refresh. 10. Click Close on the Discover VM Managers dialog box. Excluding a host from VM manager discovery To exclude host from VM manager discovery complete the following steps. 1. Select Discover > VM Managers. The Discover VM Managers dialog box displays. 2. Select the Host you want to exclude in the Discovered VM Managers list and click Exclude. 3. Click Close on the Discover VM Managers dialog box.
VM Manager discovery 3 Rediscovering a previously discovered VM manager To return a VM manager to active discovery, complete the following steps. 1. Select Discover > VM Managers. The Discover VM Managers dialog box displays. 2. Select the VM manager you want to return to active discovery in the Previously Discovered Addresses table. 3. Click Discover. 4. Click OK on the confirmation message. The rediscovered VM manager displays in the Discovered VM Managers table. 5.
3 VM Manager discovery The following are samples of actual ESX host status messages: • • • • Active Discovery pending, Excluded, Conflict – Existing Host 3. Refresh the Discover VM Managers list by clicking Refresh. 4. Click Close on the Discover VM Managers dialog box. Troubleshooting VM manager discovery If you encounter discovery problems, complete the following checklist to ensure that discovery was set up correctly. Verify IP connectivity by issuing a ping command to the switch. 1.
Chapter Application Configuration 4 In this chapter • Server Data backup. . . . . . . . . . . . . . . . . . . . . . . . . . . . . . . . . . . . . . . . . . . . . 75 • Server Data restore . . . . . . . . . . . . . . . . . . . . . . . . . . . . . . . . . . . . . . . . . . . . . 81 • SAN data collection . . . . . . . . . . . . . . . . . . . . . . . . . . . . . . . . . . . . . . . . . . . . . 82 • SAN display settings . . . . . . . . . . . . . . . . . . . . . . . . . . . . . . . . . . . . . . . . . . . .
4 Configurable preferences • SAN End Node Display — Use to display (or turn off display of) end nodes on the Connectivity map for newly discovered fabrics. Disabling end node display limits the Connectivity map to switch members only. For more information, refer to “SAN End node display” on page 88. • SAN Ethernet Loss Events — Use to enable events for a loss of ethernet connection to SAN switches. For more information, refer to “SAN Ethernet loss events” on page 89.
Server Data backup 4 Server Data backup The Management application helps you to protect your data by backing it up automatically. Backup is a service process that periodically copies and stores application files to an output directory. The output directory is relative to the server and must use a network share format to support backup to the network. The data can then be restored, as necessary. NOTE Backing up data takes some time.
4 Server Data backup Backup directory structure overview The Management server backs up data to two alternate folders. For example, if the backup directory location is D:\Backup, the backup service alternates between two backup directories, D:\Backup\Backup and D:\Backup\BackupAlt. The current backup is always D:\Backup and contains a complete backup of the system. The older backup is always D:\BackupAlt. If a backup cycle fails, the cause is usually a full CD-RW.
Server Data backup 4 • Select the Include Technical Support directory check box, if necessary. Only available if the Include FTP Root directory check box is clear. • Select the Include Upload Failure Data Capture directory check box, if necessary. Only available if the Include FTP Root directory check box is clear. 5. Enter the time (using a 24-hour clock) you want the backup process to begin in the Next Backup Start Time Hours and Minutes fields. 6.
4 Server Data backup 9. Backup data to a CD by completing the following steps. NOTE This is not recommended on a permanent basis. CDs have a limited life, and may only last a month. An error message occurs if your Management application can no longer backup to the disc. a. Verify that the CD backup directory is correct (default directory is D:\Backup). It is assumed that drive D is a CD-RW drive. You can change the directory or use the Browse button to select another directory. b.
Server Data backup 4 3. Clear the Enable Backup check box. 4. Click Apply or OK. Viewing the backup status The Management application enables you to view the backup status at a glance by providing a backup status icon on the Status Bar. The following table illustrates and describes the icons that indicate the current status of the backup function. TABLE 14 Backup status Icon Description Backup in Progress — displays the following tooltip: “Backup started at hh:mm:ss, in progress...
4 Server Data backup Starting immediate backup NOTE You must have backup privileges to use the Backup Now function. For more information about privileges, refer to “User Privileges” on page 1451. To start the backup process immediately, complete one of the following procedures: Using the Backup Icon, right-click the Backup icon and select Backup Now. The backup process begins immediately. OR 1. Select Server > Options. The Options dialog box displays. 2. Select Server Backup in the Category list. 3.
Server Data restore 4 Server Data restore NOTE You cannot restore data from a previous version of the Management application. NOTE You cannot restore data from a higher or lower configuration (Trial or Licensed version) of the Management application. NOTE You cannot restore data from a different package of the Management application. The Management application helps you to protect your data by backing it up automatically. The data can then be restored, as necessary.
4 SAN data collection 6. Click Restore. Upon completion, a message displays the status of the restore operation. Click OK to close the message and the Server Management Console. For the restored data to take effect, re-launch the Configuration Wizard using the instructions in “Launching the Configuration Wizard” on page 6.
SAN data collection 4 events is the lazy polling interval plus the short tick interval. To increase polling efficiency, you can configure both the short tick interval (Check for state change every option) and the lazy polling interval (If no state change, poll switch every option) on the Options dialog box. For step-by-step instructions, refer to “Configuring asset polling” on page 122. There are two types of collectors, fabric-level collectors and switch-level collectors.
4 Product communication protocols • MetaSANCollector – Collects data about the IFLs (Inter Fabric Links) on the switch. • FlowCollector – Collects data about the flow definitions on the switch. Also collects the subflows for each flow definition. This collector requires the Fabric Insight license on the switch. • VPWwnInfoCollector – Collects data about the VPWWN (Virtual Port World Wide Name) on the switch. The Management application collects performance monitoring data via SNMP.
SAN display settings TABLE 15 4 Product communication protocols Protocol Description Management application use Communicates with device type FTP File Transfer Protocol (FTP) is a standard network protocol used to transfer files from one host to another host over a TCP-based network Used for firmware download. For Fabric OS devices, used to collect technical support information. For more information, refer to “FTP/SCP/SFTP server settings” on page 125.
4 SAN display settings FIGURE 23 Options dialog box (SAN Display pane) 3. Click Set Up FICON Display. Any table that contains end device descriptions move the following nine columns to the beginning of the table: Attached Port #, FC Address, Serial #, Tag, Device Type, Model, Vendor, Port Type, and WWN. 4. Click Apply or OK to save your work. Resetting your display You can reset your system to display the default display settings for all fabrics.
SAN display settings 4 Importing the OUI file To import the OUI file, complete the following steps. 1. Select Server > Options. The Options dialog box displays. 2. Select SAN Display in the Category list. The SAN Display pane displays. 3. Click Import OUI . 4. Select the folder where you want the OUI file to be uploaded. NOTE If you select the correct OUI file and new OUI files are found, the Product Type Mapping dialog box is displayed.
4 SAN End node display FIGURE 24 Product Type Mapping dialog box NOTE You can search for an OUI by using a search string in the Search list or with the Organization drop down. 4. Select the product type for a particular OUI file and change to Target, Initiator, or Default. 5. Click OK. SAN End node display The connectivity map can be configured to display or not display end nodes. This option enables you to set the end node display for all newly discovered fabrics.
SAN Ethernet loss events FIGURE 25 4 Options dialog box (SAN End Node Display pane) 2. Select SAN End Node Display in the Category list. 3. Select the Show connected end nodes when new fabric is discovered check box to display end nodes on your system. NOTE Before changes can take effect, the topology must be rediscovered. 4. Click Apply or OK to save your work. SAN Ethernet loss events An Ethernet event occurs when the Ethernet link between the Management Server and the managed SAN device is lost.
4 Event storage settings Disabling SAN Ethernet loss events To disable Ethernet loss events, complete the following steps. 1. Select Server > Options. The Options dialog box displays. 2. Select SAN Ethernet Loss Events in the Category list. 3. Clear the Enable events for ethernet loss check box. 4. Click Apply or OK to save your work.
Flyover settings 4 4. Enter then number of days (1 through 365) you want to store events in the Maximum Days field. The events are purged at midnight on the last day of the retention period regardless of the number of maximum events. 5. Choose one of the following options: • Select the Yes option to store all historical events from the repository to a file while purging occurs. • Select the No option to purge historical events from the repository without storing them as a file. 6. Click OK.
4 Flyover settings FIGURE 28 Options dialog box (Flyovers pane, Product tab) a. Select the protocol type from the Type list, if necessary. b. Select each property you want to display in the product flyover from the Available Properties table.
Flyover settings 7. 4 Add connection properties you want to display on flyover by selecting the Connection tab (Figure 29) and completing the following steps. FIGURE 29 a. Options dialog box (Flyovers pane, Connection tab) Select the protocol type from the Type list, if necessary. Depending on which protocol you select, some properties may not be available for all protocols. b. Select each property you want to display in the connection flyover from the Available Properties table.
4 Name settings • • • Name Node WWN MAC • • • Port# Port Type FCoE Index # c. Click the right arrow to move the selected properties to the Selected Properties table. d. Use the Move Up and Move Down buttons to reorder the properties in the Selected Properties table. The properties displayed in the Selected Properties table appear in the flyover display. 8.
Name settings 4 To edit duplicate names, complete the following steps. 1. Select Server > Options. The Options dialog box displays. 2. Select SAN Names in the Category list. The SAN Names pane displays (Figure 30). FIGURE 30 Options dialog box (SAN Names pane) 3. Select Set names to be unique to require that names be unique on your system. 4. Click OK on the Options dialog box. 5. Click OK on the “duplicate names may exist” message. To fix duplicated names, refer to “Fixing duplicate names” on page 96.
4 Name settings Fixing duplicate names To fix duplicated names, complete the following steps. 1. Select Configure > Names. The Configure Names dialog box displays. 2. Click Fix Duplicates. The Duplicated Names dialog box displays (Figure 31). FIGURE 31 Duplicated Names dialog box The Duplicated Names dialog box contains the following information: • Description — A description of the device. • Duplicate Names table — Every instance of duplicate names. 96 Fabric — The fabric name.
Name settings 4 3. Select one of the following options. • If you select Append Incremental numbers for all repetitive names, the names are edited automatically using incremental numbering. • If you select I will fix them myself, edit the name in the Name field. 4. Click OK on the Duplicated Names dialog box. 5. Click OK to close the Configure Names dialog box. 6. Click OK on the confirmation message. Viewing names To view names associated with devices, complete the following steps. 1.
4 Name settings • Display table — This table displays the following information: Description–A description of the device. Name–The name of the device. Enter a name for the device. Operational Status–The operational status of the device (discovered, operational, and unknown). Type–The type of device (port, node, Fabric Assigned WWN, and unknown). WWN–The world wide node (WWN) of the device. Enter a WWN for the device. Click a column head to sort the list.
Name settings 4 If you set names to be unique on the Options dialog box and the name you entered already exists, the entry is not accepted. To search for the device already using the name, refer to “Searching for a device by name” on page 101 or “Searching for a device by WWN” on page 102 in the Configure Names dialog box or “Searching for a device” on page 375 in the connectivity map. NOTE If you segment a fabric, the Fabric’s name follows the assigned principal switch. 5.
4 Name settings Removing a name from a device 1. Select Configure > Names. The Configure Names dialog box displays. 2. In the Display table, select the name you want to remove. 3. Click Remove. An application message displays asking if you are sure you want clear the selected name. 4. Click Yes. 5. Click OK to close the Configure Names dialog box. 6. Click OK on the confirmation message. Editing names To edit the name associated with a device, complete the following steps. 1. Select Configure > Names.
Name settings 4 Importing Names If the name length exceeds the limitations detailed in the following table, you must edit the name (in the CSV file) before import. Names that exceed these limits will not be imported. If you migrated from a previous version, the .properties file is located in the Install_Home\migration\data folder. TABLE 16 Name length limitations Device Character limit Fabric OS switch 6.2 or later 30 (24 character limit when in FICON mode) Fabric OS switch 6.1.
4 Miscellaneous security settings 5. Click Search. All devices with the specified name (or partial name) are highlighted in the Display table. You may need to scroll to see all highlighted names. If the search finds no devices, a ‘no item found’ message displays. 6. Click OK to close the Configure Names dialog box. Searching for a device by WWN You can search for objects (switch, fabric, product, ports, or N Ports) by WWN (world wide name).
Miscellaneous security settings 4 Configuring the server name To configure the server name, complete the following steps. 1. Select Server > Options. The Options dialog box displays. 2. Select Security Misc in the Category list. The Security Misc pane displays (Figure 33). FIGURE 33 Options dialog box (Security Misc pane) 3. Enter the server name in the Server Name field. The Server Name field cannot be empty. 4. Click OK on the confirmation message. 5. Click Apply or OK to save your work.
4 Miscellaneous security settings Enforcing MD5 file during import NOTE The MD5 checksum file is required when you load Fabric OS firmware into the Management application version 12.0 or later. You can configure the Management application to enforce the MD5 checksum file import during the import of the Fabric OS image into the firmware repository. The MD5 checksum file can be obtained from the Fabric OS product download site in the same location as the firmware file.
Syslog Registration settings 4 4. Enter the message you want to display every time a user logs into this server in the Banner Message field. This field contains a maximum of 2048 characters. 5. Click Apply or OK to save your work. Disabling the login banner To disable the login banner display, complete the following steps. 1. Select Server > Options. The Options dialog box displays. 2. Select Security Misc in the Category list. 3. Clear the Display login banner upon client login check box.
4 SNMP Trap Registration settings Configuring the Syslog listing port number 1. Select Server > Options. The Options dialog box displays. 2. Select Syslog Registration in the Category pane. The Syslog Registration pane displays (Figure 34). 3. Enter the Syslog listening port number of the Server in the Syslog Listening Port (Server) field, if necessary. The default Syslog listening port number is 514 and is automatically populated.
SNMP Trap forwarding credential settings 4 3. Enter the SNMP listening port number of the Server in the SNMP Listening Port (Server) field, if necessary. The default SNMP listening port number is 162 and is automatically populated. 4. Click Apply or OK to save your work. SNMP Trap forwarding credential settings You can configure SNMP credentials for the traps forwarded by the server. Configuring SNMP v1 and v2c credentials To configure a SNMP v1 or v2c credentials, complete the following steps. 1.
4 Software Configuration Configuring SNMP v3 credentials To configure a SNMP v1 or v2c credentials, complete the following steps. 1. Select Server > Options. The Options dialog box displays. 2. Select Trap Forwarding Credentials in the Category pane. The Trap Forwarding Credentials pane displays (Figure 36). 3. Enter the SNMP v3 name (case sensitive, 1 to 16 characters) to identify the credentials in the User Name field. Allows all printable ASCII characters. 4.
Software Configuration 4 Certificates Certificate management allows you to enable certificate validation between the Management application server and products when HTTPS is enabled and between server and client when SSL is enabled on server. For more information about product communication, refer to “Product communication settings” on page 124. Certificate management also allows you to manage the Management application server truststore as well as the Management application client truststore.
4 Software Configuration The Certificates pane contains the following fields and components: • Enable certificate validation check box — Select to enable certificate validation. Clear to disable certificate validation • Keystore Certificates drop-down list — Select one of the following options: View — Click to view the keystore certificate details. For more information, refer to “Viewing a truststore certificate” on page 110. Export — Click to export a keystore certificate.
Software Configuration FIGURE 38 4 Details - Certificate Name dialog box The Details - Certificate Name dialog box contains the following fields: • Left-side text box — Name of the Issuer. • Right-side table — Displays the following certificate details: Version — Version of the certificate. Serial Number — Serial number of the certificate. Signature Algorithm — Signature algorithm used to sign the certificate. The signature algorithm is derived from the algorithm of the underlying private key.
4 Software Configuration 5. Enter a unique alias for the certificate in the Alias Name field. 6. Click OK. 7. Click Apply or OK to save your work. Deleting a truststore certificate 1. Select Server > Options. The Options dialog box displays. 2. Select Certificates to in the Category list. The Certificates pane displays. 3. Select the truststore you want to delete in the Truststore Certificates table. 4. Click Delete. 5. Click Yes on the confirmation message.
Software Configuration 4 Viewing a keystore certificate 1. Select Server > Options. The Options dialog box displays. 2. Select Certificates to in the Category list. The Certificates pane displays. 3. Select View from the Keystore Certificate list. The Details - Certificate Name dialog box displays with the following fields: • Left-side text box — Name of the Issuer. • Right-side table — Displays the following certificate details: Version — Version of the certificate.
4 Software Configuration Replacing a keystore certificate NOTE Changes to this option take effect after an application restart. 1. Select Server > Options. The Options dialog box displays. 2. Select Certificates to in the Category list. The Certificates pane displays. 3. Select Replace from the Keystore Certificate list. The Replace Keystore Certificate dialog box displays. 4. To replace the current certificate with a new self-signed certificate, select the A new self signed certificate option. 5.
Software Configuration 4 Enabling and disabling certificate validation The Management application server only validates the certifying authority and the date in the certificate. Certificate validation requires HTTPS connections between the server and the switches. To configure product communication to HTTPS, refer to “Product communication settings” on page 124. 1. Select Server > Options. The Options dialog box displays. 2. Select Certificates to in the Category list. The Certificates pane displays. 3.
4 Software Configuration 4. Click Apply or OK to save your work. NOTE Changes to this option take effect after a client restart. 5. Click OK on the “changes take effect after client restart” message. Client/Server IP You can configure connections between the client or switches and the Management application server. Configuring the server IP address If your Operating System is IPv4-enabled or IPv6-enabled (running in dual mode), the server binds using an IPv4 address.
Software Configuration FIGURE 40 4 Options dialog box (Client/Server IP option) 3. Choose one of the following options in the Server IP Configuration list. • Select All. Go to step 4. • Select a specific IP address. Continue with step 5. • Select localhost. Continue with step 5. When Server IP Configuration is set to All, you can select any available IP address as the Return Address. If you select a specific IP address, the Return Address list shows the same IP address and you cannot change it. 4.
4 Software Configuration Configuring an explicit server IP address If you selected a specific IP address from the Server IP Configuration screen during installation and the selected IP address changes, you will not be able to connect to the server. To connect to the new IP address, you must manually update the IP address information. To change the IP address, complete the following steps. 1. Choose one of the following options: • On Windows systems, select Start > Programs > Management_Application 12.X.
Software Configuration 4 8. Verify the IP address on the Server Configuration Summary screen and click Next. 9. Click Finish on the Start Server screen. 10. Click Yes on the restart server confirmation message. 11. Choose one of the following options: • If you configured authentication to CAC, enter your PIN in the CAC PIN field. • If you configured authentication to the local database, an external server (RADIUS, LDAP, or TACACS+), or a switch, enter your user name and password.
4 Software Configuration 3. Choose one of the following options in the Server IP Configuration list. • Select All. Go to step 4. • Select a specific IP address. Continue with step 5. • Select localhost. Continue with step 5. 4. Select the return IP address in the Client - Server IP Configuration Return Address list. When Server IP Configuration is set to All, you can select any available IP address as the Return Address.
Software Configuration 4 • Medium SAN — 90 products, 5,000 ports • Large SAN — 200 products, 15,000 ports NOTE For full performance management and dashboard functionality, the Large option of the SAN Enterprise edition only supports 5000 switch ports on a 32-bit system. Memory and asset polling values change to the new default values when you change the SAN Network size. You may increase these values. For default values, refer to step 4 and step 5. b. Click OK on the confirmation message. 4.
4 Software Configuration • Small: 768 MB • Medium: 1024 MB • Large: 1024 MB For all 64-bit servers, the default minimum server heap size for all network sizes is 2048 MB. NOTE There is no restriction on the maximum value for server heap size in a 64-Bit server. The correct server heap size value must be given according to the RAM present in the server. 6. Click Apply or OK to save your work. NOTE Changes to this option take effect after an application restart.
Software Configuration 4 • Medium/2000–5000 ports: 900 seconds • Large/5000 or more ports: 1800 seconds 5. Click Apply or OK to save your work. NOTE Changes to this option take effect after an application restart. NOTE You can only restart the server using the Server Management Console (Start > Programs > Management_Application_Name 12.X.X > Server Management Console). 6. Click OK on the “changes take effect after application restart” message.
4 Software Configuration Product communication settings You can configure HTTP or HTTPS connections between the products and the Management application server. Configuring SAN communication To configure connections between the SAN devices and the Management application server, complete the following steps. 1. Select Server > Options. The Options dialog box displays. 2. Select Product Communication from the Software Configurations list in the Category pane.
Software Configuration 4 4. To connect using HTTPS (HTTP over SSL), complete the following steps. a. Select the Connect using HTTPS (HTTP over SSL) only option. b. Enter the connection port number in the Port # field. Continue with step 6. The default HTTPS port number is 443. 5. To connect using HTTPS then HTTP, complete the following steps. a. Select the Connect using HTTPS then HTTP option. b. Enter the connection port number in the Current Port # field. Continue with step 6.
4 Software Configuration Secure Copy (SCP) is a means of securely transferring computer files between a local and a remote host or between two remote hosts, using the Secure Shell (SSH) protocol. You must configure SCP on your machine to support Technical Support and firmware download. NOTE SCP is supported on Fabric OS devices running 5.3 and later. SSH File Transfer Protocol (SFTP) is a network protocol used to transfer data from one computer to another over a secure channel.
Software Configuration 4 4. Select the Built-in FTP Server check box. 5. Change your password by entering a new password in the Password and Confirm Password fields. The default password is passw0rd (where 0 is a zero). 6. Click Test to test the FTP server. An “FTP Server running successfully” or an error message displays.
4 Software Configuration 7. Click Test to test the server. An “SCP/SFTP Server running successfully” or an error message displays. If you receive an error message, make sure your credentials are correct, the SCP/SFTP server is stopped, the remote directory path exists, and you have the correct access permission; then try again. 8. Click Apply or OK to save your work.
Software Configuration c. Enter a user name in the Remote Host User Name field. d. Enter the path to the remote host in the Remote Directory Path field. 4 Use a slash (/) or period (.) to denote the root directory. e. Enter the password in the Password Required for FTP field. 5. To configure an external SCP server, complete the following steps. a. Select the SCP Server check box to configure the external SCP server. All fields are mandatory. b.
4 Software Configuration • If you are using the internal FTP server, select the Use built-in FTP/SCP/SFTP Server option. For step-by-step instructions about configuring the built-in server, refer to “Configuring an internal FTP server” on page 126. • If you are using the external FTP server, select the Use external FTP/SCP/SFTP Server option. For step-by-step instructions about configuring the built-in server, refer to “Configuring an external FTP, SCP, or SFTP server” on page 128. 4. Click Test.
Software Configuration 4 4. Enable HTTP redirection to HTTPS by selecting the Redirect HTTP Requests to HTTPS check box. When you enable HTTP redirection, the server uses port 80 to redirect HTTP requests to HTTPS. Make sure that port 80 is available before you enable HTTP redirection. 5. Enter a port number in the Starting Port # field. The default is 24600. For Professional, the server requires 15 consecutive free ports beginning with the starting port number.
4 Software Configuration 4. Select the Log server support data - Log Level list, and select the type of log data you want to configure. Log level options include: All, Fatal, Error, Warn, Info, Debug, Trace, and Off. Default is Info. 5. Click Apply or OK to save your work. NOTE Changes to the server log levels reset to the default (INFO) after a server restart. NOTE Changes to the Log client support data log level is persisted on all clients launched from the same machine for the same server. client.
FIPS Support 4 3. Select the maximum number of days to retain the server log file in the Log Purging Limit field. Valid values are 1 through 90. Default is 14. The log files are purged at 1:00 AM on the day after the retention period ends. 4. Click Apply or OK to save your work.
4 Fabric tracking • Do not show me this again check box — Select if you do not want to see this dialog box again when you enable or disable fabric tracking or accept changes for a switch or fabric. • Switches — This table shows a brief summary of the switches including status (whether the device port will be added ( ) or removed ( ) from the fabric), name, fabric name, IP address, WWN, and domain ID. This table includes unmonitored switches which becomes segmented from the fabric.
Fabric tracking 4 Accepting changes for a fabric 1. Accept the changes to a fabric by choosing one of the following options: • Select a fabric on the Product List or Connectivity Map and select Monitor > Accept Changes. • Right-click a fabric on the Product List or Connectivity Map and select Accept Changes. The accept changes summary message displays (Figure 48).
4 Fabric tracking Accepting changes for all fabrics 1. Accept the changes to all fabrics by choosing one of the following options: • Click in the white space on the Connectivity Map and select Monitor > Accept All Changes. • Right-click in the white space on the Connectivity Map and select Accept All Changes. The accept changes summary message displays (Figure 49).
Fabric tracking 4 Accepting changes for a switch, access gateway, or phantom domain 1. Accept the changes to a switch, access gateway, or phantom domain by choosing one of the following options: • Select the switch, access gateway, or phantom domain on the Product List or Connectivity Map and select Monitor > Accept Changes. • Right-click the switch, access gateway, or phantom domain on the Product List or Connectivity Map and select Accept Change. The accept changes summary message displays.
4 138 Fabric tracking Brocade Network Advisor SAN User Manual 53-1003154-01
Chapter 5 User Account Management In this chapter • Users overview. . . . . . . . . . . . . . . . . . . . . . . . . . . . . . . . . . . . . . . . . . . . . . . . • User accounts . . . . . . . . . . . . . . . . . . . . . . . . . . . . . . . . . . . . . . . . . . . . . . . . • Roles. . . . . . . . . . . . . . . . . . . . . . . . . . . . . . . . . . . . . . . . . . . . . . . . . . . . . . . . • Areas of responsibility . . . . . . . . . . . . . . . . . . . . . . . . . . . . . . . . . . . . . . . . . .
5 Users overview FIGURE 50 Users dialog box - Users tab The Users dialog box contains the following fields and components: • Authentication-Primary — The primary authentication server type configured through the Server Management Console. • Secondary — The secondary authentication server type configured through Server Management Console. • Authorization — The authorization source configured through the Server Management Console.
Users overview 5 • Users table — The configured users. User ID — The unique name used to identity a user. Full Name — The user’s full name. Roles — List of roles the user belongs to separated by commas. Area Of Responsibility — List of Area Of Responsibility (AORs) the user belongs to separated by commas. E-mail Notification — Whether e-mail notification is enabled for the user. Account Enabled — Whether the user account status is enabled.
5 Users overview • Roles table — Lists the default system roles and any user-defined roles. Name — The unique name of the role. Default system roles for SAN only environments include: - SAN System Administrator Network Administrator Security Administrator Zone Administrator Operator Security Officer Host Administrator Description — A description of the role. Add button — Click to add a new role (refer to “Creating a new role” on page 149).
User accounts 5 User accounts NOTE You must have User Management Read and Write privileges to add new accounts, set passwords for accounts, and apply roles to the accounts. For a list of privileges, refer to “User Privileges” on page 1451. Management application user accounts contain the identification of the Management application user, as well as privileges, roles, and AORs assigned to the user. Privileges provide access to the features in Management application.
5 User accounts 4. Enter a password for the user in the Password and Confirm Password fields. Passwords displays as dots (.). For password policy details, refer to “Viewing your password policy” on page 162. 5. Select the Account Status - Enable check box to enable the account of the user. Account Status is enabled by default. 6. (Optional) Enter the full name of the user in the Full Name field. 7. (Optional) Enter a description for the user in the Description field. 8.
User accounts 5 Editing a user account To make changes to an existing user account, complete the following steps. 1. Select Server > Users. The Users dialog box displays. 2. Select the user account you want to edit and click Edit under the Users table. The Edit User dialog box displays. 3. Complete step 3 through step 13 in “Creating a new user account” on page 143. 4. Click OK to save the user account and close the Edit User dialog box.
5 User accounts Copying and pasting user preferences You can copy user preference settings, such as window and dialog box sizes, table column and sort order, as well as other customizations, and all the user-defined views (including fabrics and hosts) from the selected user account to one or more other user accounts. If the fabric and hosts from the original user account are not included in the other user's AOR, then the copied fabrics and hosts do not display in the other user's views.
User accounts 5 5. Click Save.The file is saved to the location you selected. If the export is successful, the following message displays: User profile data exported successfully to -UserProfile-
5 User accounts Removing roles and areas of responsibility from a user account To remove roles and AORs from an existing user account, complete the following steps. 1. Select Server > Users. The Users dialog box displays. 2. Select the user account you want to edit and click Edit under the Users table. The Edit User dialog box displays. 3.
Roles 5 Deleting a user account NOTE You cannot delete the default "Administrator" user account. To permanently delete a user account from the server, complete the following steps. 1. Select Server > Users. The Users dialog box displays. 2. Select the user you want to delete in the Users table and click Delete. 3. Click Yes on the confirmation message. If currently accessing the server, the user will be logged out once the user account is deleted. 4. Click Close to close the Users dialog box.
5 Roles 2. Click Add under the Roles table. The Add Role dialog box displays. FIGURE 52 Add Role dialog box 3. Enter a name of the role in the Name field. 4. (Optional) Enter a short description for the role in the Description field. 5. Add or remove privileges as needed. For step-by-step instructions, refer to “Adding privileges to a role” on page 151 or “Removing privileges from a role” on page 152. 6. Click OK to save the new role and close the Add Role dialog box.
Roles 5 4. Click OK to save the role and close the Edit Role dialog box. If you make changes to the user’s role or AOR while the user is logged in, a confirmation message displays. When you click OK on the confirmation message, the user is logged out and must log back in to see the changes. 5. Click Close to close the Users dialog box. Copying a role You can create a new role by copying an existing one. When you copy a role, you copy the selected privileges in that role.
5 Roles 2. Click Add, Edit, or Duplicate under the Roles table. The Add Roles, Edit Roles, or Duplicate Roles dialog box displays. 3. Add read and write access by selecting the features to which you want to allow read and write access in the Available Privileges list and click the right arrow button to move the features to the Read & Write Privileges list. Select multiple features by holding down the CTRL key and clicking more than one privilege. The features are moved to the Read & Write Privileges list.
Areas of responsibility 5 Areas of responsibility NOTE You must have User Management Read and Write privileges to view, add, modify, or delete operational areas of responsibility. An area of responsibility (AOR) allows you to place Fabricsand Hosts into management groups that can be assigned to an Management application user. Users can manage only the Fabricsand Hosts in the AOR assigned to them, because only devices their AOR display in the Product List and Topology Map. For example, devices 10.10.10.
5 Areas of responsibility FIGURE 53 Users dialog box - Users tab 3. Enter a name of the AOR in the Name field. 4. (Optional) Enter a short description for the AOR in the Description field. 5. Assign or remove products as needed. For step-by-step instructions, refer to “Assigning products to an AOR” on page 155 or “Removing products from an AOR” on page 156. 6. Click OK to save the new AOR and close the Add AOR dialog box. The new AOR displays in the AOR list of the Users dialog box. 7.
Areas of responsibility 5 4. Click OK to save the AOR and close the Edit AOR dialog box. If you make changes to the user’s role or AOR while the user is logged in, a confirmation message displays. When you click Yes on the confirmation message, the user is logged out and must log back in to see the changes. 5. Click Close to close the Users dialog box. Copying an AOR NOTE You cannot duplicate system AORs. To create a new AOR by copying an existing one, complete the following steps. 1.
5 Areas of responsibility 2. Click Add, Edit, or Duplicate under the AOR table. The Add AOR, Edit AOR, or Duplicate AOR dialog box displays. 3. Click the Fabrics tab. 4. Select the fabrics you want to assign to the AOR in the Available Fabrics table and click the right arrow button to move the products to the Selected Products table. Select multiple fabrics by holding down the CTRL key and clicking more than one fabric. 5. Click the Hosts tab. 6.
Password policies 5 Password policies NOTE You must have User Management Read and Write privileges to configure password policy. Passwords are an important aspect of computer security. They are the front line of protection for user accounts. The purpose of the password policy is to establish a standard for the creation of strong passwords, the protection of those passwords, and the frequency of change.
5 Password policies d. Enter the minimum number of lowercase characters required in the Lower Case Characters field. Only enabled when the Empty Password - Allow check box is clear. Valid values are 0 through 127. The default is 0. e. Enter the minimum number of digits required in the Number of Digits field. Only enabled when the Empty Password - Allow check box is clear. Valid values are 0 through 127. The default is 0. f.
User profiles 5 10. Click Yes on the confirmation message. 11. Click Close to close the Users dialog box. Viewing password policy violators To view password policy violators, complete the following steps. 1. Select Server > Users. The Users dialog box displays. 2. Click the Policy tab. 3. Click View Policy Violators. The View Policy Violators dialog box displays. 4. Review the password policy violator details.
5 User profiles Viewing your user profile To view your user profile, complete the following steps. To edit your user profile, refer to “Editing your user profile” on page 160. 1. Select Server > User Profile. The User Profile dialog box displays the following information: • User ID — Displays your user identifier. • Full Name — Displays the name if entered while adding a user; otherwise, this field is blank. • Password — Displays your password as dots (.).
User profiles 5 3. Change your password in the Password and Confirm Password fields. Passwords display as dots (.). 4. Change your user profile description in the Description field. 5. Change your phone number in the Phone Number field. 6. Select the E-mail Notification Enable check box to enable e-mail notification. Clear the E-mail Notification Enable check box to disable e-mail notification. 7. Click Filter to set up basic event filters.
5 User profiles Viewing your password policy To view your password policy, complete the following steps. 1. Select Server > User Profile. The User Profile dialog box displays. 2. Click Password Policy - View to display your password policy. The View Password Policy dialog box displays. • Password History Count — The number of unique passwords you must use before you can reuse a password. • Empty Password — Whether or not to allow empty passwords.
User profiles 5 Configuring e-mail notification To configure and enable e-mail notification, complete the following steps. 1. Select Server > User Profile. The User Profile dialog box displays. 2. Select the E-mail Notification - Enable check box to enable e-mail notification. 3. Click Filter to set up basic event filter. For step-by-step instructions about setting up basic event filters, refer to “Setting up basic event filtering” on page 1258. 4.
5 164 User profiles Brocade Network Advisor SAN User Manual 53-1003154-01
Chapterpage 6 Web Client In this chapter • Web client overview. . . . . . . . . . . . . . . . . . . . . . . . . . . . . . . . . . . . . . . . . . . . • Dashboard . . . . . . . . . . . . . . . . . . . . . . . . . . . . . . . . . . . . . . . . . . . . . . . . . . . • Inventory. . . . . . . . . . . . . . . . . . . . . . . . . . . . . . . . . . . . . . . . . . . . . . . . . . . . . • Events. . . . . . . . . . . . . . . . . . . . . . . . . . . . . . . . . . . . . . . . . . . . . . . . . . . . . . . • Reports.
6 Dashboard • “Inventory expand navigation bar” on page 211 • “Reports expand navigation bar” on page 234 3. Right pane — Displays the detail for the feature selected in the left pane. For more information, refer to: • • • • “Dashboard” on page 166 “Inventory” on page 210 “Events” on page 231 “Reports” on page 233 License License keys are encoded form of supported configuration or features.
Dashboard 6 The dashboard refreshes every ten seconds regardless of the size of your network. Note that data may become momentarily out of sync between the dashboard and other areas of the application. For example, if you remove a product from the network while another user navigates from the dashboard to a more detailed view of the product, the product may not appear in the detailed view.
6 Dashboard Dashboard toolbar The dashboard toolbar (Figure 56) is located above the status widgets or performance monitors and provides a information about the selected dashboard as well as buttons to perform various functions. FIGURE 56 Dashboard toolbar The dashboard toolbar contains the following fields and components: 1. Collapse/Expand buttons — Click the Expand button to hide the expand navigation bar. Click the Collapse button to display the expand navigation bar. 2.
Dashboard customization 6 Accessing a dashboard NOTE If you change the dashboard in the Java client, change is reflected in the web client and vice versa. To access a specific dashboard, complete the following steps. 1. Click the Dashboard icon. The Dashboard expand navigation bar displays. 2. Select the dashboard you want to view from the Dashboards list. Options include: • Default Dashboards — Displays the three preconfigured dashboards.
6 Dashboard customization FIGURE 57 Scope dialog box 2. Select a network from the Network Scope list. The default network scope is All. The available network scopes include the following options: • All products and fabrics • Any SAN fabric If you select a fabric scope, dashboard widgets displays data for all products and ports in the fabric. If you select a product scope, dashboard widgets displays data for the selected products and the ports that belong to the selected products.
Dashboard customization 6 Setting the time interval Setting the global time interval in the dashboard toolbar configures the data display time range for all the applicable widgets. Time interval in the Scope list allows you to select a specific time range for which you want to display data in the dashboard. NOTE Time Interval does not affect the Status and Inventory widgets. 1. Click the Scope arrow. 2. Select a duration from the Time Scope list. The default time scope is 30 minutes.
6 Dashboard customization Default dashboards The Management application provides preconfigured dashboards which provide high-level overview of the network, the current states of managed devices, and performance of devices, ports, and traffic on the network.
Dashboard customization 6 Shared Dashboards The Shared Dashboards list includes all user-defined dashboards that have been shared with other users in the Java Client. Shared dashboards display in the following format: dashboard_name (user_name). The Shared Dashboards list does not display until a dashboard is shared with other users in the Java Client.
6 Dashboard customization • Type — The port type. • Identifier — The port identifier, such as port name, number, address, WWN, user port number, or zone alias. • Port Number — The port number. • State — Whether the port is online or offline. • Status — Whether the port is online or offline. Customizing the Bottlenecked Ports widget You can customize the widget to display data for a specific fabric and duration.
Dashboard customization TABLE 18 6 Event severity color codes Color Severity Grey ( ) Notice Blue ( ) Info The Events widget only includes events from products that are in your AOR. Double-click a bar in the graph to navigate to the Events page with only the selected event type (Emergency, Alert, and so on) displaying. For example, double-click the Error event bar. The Events page displays with only Error events in the table.
6 Dashboard customization • Bar chart — Displays each group as a separate bar on the graph. Displays the current state of all Host products discovered for a group in various colors on each bar. Tooltips showing the number of devices in that state are shown when you pause on the bar. Double-click a bar in the graph to navigate to the Host Inventory Detailed View page.
Dashboard customization 6 SAN Inventory widget The SAN Inventory widget (Figure 59) displays the SAN products inventory as stacked bar graphs. FIGURE 59 SAN Inventory widget The SAN Inventory widget includes the following data: • Widget title — The name of the widget. • Show Legend icon — Click to display the color legend for the widget below the bar chart. • Widget summary — The product count for each status (worst to best order) with the associated icon displays underneath the widget title.
6 Dashboard customization Customizing the SAN Inventory widget You can customize the SAN Inventory widget to display the product inventory for a specific group. The group type and number of devices in the group displays to the left of the associated bar; for example, v7.0.0 [3], where v7.0.0 is the firmware number and [3] is the number of devices running that firmware level.
Dashboard customization 6 SAN Status widget The SAN Status widget displays the device status as a pie chart. If you discover a DCB switch from the SAN tab, the switch status displays in both the SAN Status and IP Status widgets. However, if you discover a DCB switch from the IP tab, the switch status only displays in the IP Status widget. FIGURE 60 SAN Status widget The SAN Status widget includes the following data: • Widget title — The name of the widget.
6 Dashboard customization Status widget The Status widget (Figure 61) displays the number of products managed and the number of events within the selected event time range FIGURE 61 Status widget The Status widget displays the following items for each product license: • • • • • Time Scope — The time scope. Fibre Channel Fabrics — The number of managed fabrics. SAN Switches — The number of managed SAN switches. SAN Physical Switches — The number of discovered physical SAN switches.
Dashboard customization 6 Monitoring and Alerting Policy Suite widgets NOTE MAPS is only supported on a licensed version of the Management application with SAN management. NOTE MAPS is only supported on FC devices running Fabric OS 7.2.0 or later with the Fabric Vision license. NOTE MAPS is not supported on DCB devices.
6 Dashboard customization The Out of Range Violations widget includes the following fields and components: • Widget title — The widget title. • Widget summary — The color of the worst severity and the number of products with that severity displays below the widget title. • Refresh time — The time of the last update for the widget. • Name — A list of the MAPS and Fabric Watch dashboard categories with an out of range violation. Click to access additional details for the violations.
Dashboard customization 6 • Product — The product affected by this monitor. Click to launch the Product page for this device (refer to “Product summary view” on page 216). When you launch the Product page, the detailed view closes. • Object Name (MAPS and Fabric Watch support) — The object name (such as switch name, port name, FRU name, and so on). • Fabric Name — The fabric associated with the product. • Rule Name (MAPS only support) — The rule name.
6 Dashboard customization • State changes — The state of the port has changed for one of the following reasons: - The port has gone offline. - The port has come online. - The port is faulty. • SFP Current — The amount of supplied current to the SFP transceiver. • SFP Receive Power — The amount of incoming laser, in µwatts, to help determine if the SFP transceiver is in good working condition. • SFP Transmit Power — The amount of outgoing laser, in µwatts.
Dashboard customization TABLE 19 6 Preconfigure performance monitors Monitor title Description Data collectors Top Port Encode Error Out Table view of the encode error out measure. There are four versions of this monitor based on the type of port: All ports, initiator ports, ISL ports, and Target ports. All SAN FC port collector Top Port Link Failures Table view of the top port link failures.
6 Dashboard customization Top Port Alignment Errors monitor The Top Port Alignment Errors performance monitor displays the top ports with alignment errors in a table. The Top Port Alignment Errors performance monitor includes the following data: • Widget title — The name of the widget. • View Details icon — Click to launch the Detailed View page. • Widget summary — The product count for each status (worst to best) displays underneath the widget title. • Top value — The highest value in the table.
Dashboard customization 6 Top Port C3 Discards monitor The Top Port C3 Discards monitor displays the top ports with Class 3 frames discarded in a table. There are four port widgets: All, ISL, Initiator, and Target. The Top Port C3 Discards monitor includes the following data: • Widget title — The name of the widget. • View Details icon — Click to launch the Detailed View page. • Widget summary — The product count for each status (worst to best) displays underneath the widget title.
6 Dashboard customization Top Port C3 Discards RX TO monitor The Top Port C3 Discards RX TO monitor displays the top ports with receive Class 3 frames received at this port and discarded at the transmission port due to timeout in a table. The Top Port C3 Discards RX TO monitor includes the following data: • Widget title — The name of the widget. • View Details icon — Click to launch the Detailed View page.
Dashboard customization 6 Top Port CRC Errors monitor The Top Port CRC Errors monitor displays the top ports with frames that contain cyclic redundancy check (CRC) errors in a table. The Top Port CRC Errors monitor includes the following data: • Widget title — The name of the widget. • Widget summary — The product count for each status (worst to best) displays underneath the widget title. • View Details icon — Click to launch the Detailed View page. • Top value — The highest value in the table.
6 Dashboard customization Top Port Encode Error Out monitor The Top Port Encode Error Out monitor displays the top ports with encoding errors outside of frames in a table. The Top Port Encode Error Out monitor includes the following data: • Widget title — The name of the widget. • View Details icon — Click to launch the Detailed View page. • Widget summary — The product count for each status (worst to best) displays underneath the widget title. • Top value — The highest value in the table.
Dashboard customization 6 Top Port Link Failures monitor The Top Port Link Failures monitor displays the top ports with link failures in a table. The Top Port Link Failures monitor includes the following data: • Widget title — The name of the widget. • View Details icon — Click to launch the Detailed View page. • Widget summary — The product count for each status (worst to best) displays underneath the widget title. • Top value — The highest value in the table.
6 Dashboard customization Top Port Link Resets monitor The Top Port Link Resets monitor displays the top ports with link resets in a table. The Top Port Link Resets monitor includes the following data: • Widget title — The name of the widget. • View Details icon — Click to launch the Detailed View page. • Widget summary — The product count for each status (worst to best) displays underneath the widget title. • Top value — The highest value in the table. • Port — The port affected by this monitor.
Dashboard customization 6 Top Port Overflow Errors monitor The Top Port Overflow Errors performance monitor displays the top ports with overflow errors in a table. The Top Port Overflow Errors performance monitor includes the following data: • Widget title — The name of the widget. • View Details icon — Click to launch the Detailed View page. • Widget summary — The product count for each status (worst to best) displays underneath the widget title. • Top value — The highest value in the table.
6 Dashboard customization Top Port Receive EOF monitor The Top Port Receive EOF performance monitor displays the top ports with received end-of-frames in a table. The Top Port Receive EOF performance monitor includes the following data: • Widget title — The name of the widget. • View Details icon — Click to launch the Detailed View page. • Widget summary — The product count for each status (worst to best) displays underneath the widget title. • Top value — The highest value in the table.
Dashboard customization 6 Top Port Runtime Errors monitor The Top Port Runtime Errors performance monitor displays the top ports with runtime errors in a table. The Top Port Runtime Errors performance monitor includes the following data: • Widget title — The name of the widget. • View Details icon — Click to launch the Detailed View page. • Widget summary — The product count for each status (worst to best) displays underneath the widget title. • Top value — The highest value in the table.
6 Dashboard customization Top Port Sync Losses monitor The Top Port Sync Losses monitor displays the top ports with synchronization failures in a table. The Top Port Sync Losses monitor includes the following data: • Widget title — The name of the widget. • View Details icon — Click to launch the Detailed View page. • Widget summary — The product count for each status (worst to best) displays underneath the widget title. • Top value — The highest value in the table.
Dashboard customization 6 Top Port Too Long Errors monitor The Top Port Too Long Errors performance monitor displays the top ports with frames longer than the maximum frame size allowed errors in a table. The Top Port Too Long Errors performance monitor includes the following data: • Widget title — The name of the widget. • View Details icon — Click to launch the Detailed View page. • Widget summary — The product count for each status (worst to best) displays underneath the widget title.
6 Dashboard customization Top Port Traffic monitor The Top Port Traffic monitor (Figure 63) displays the top ports with receive and transmit traffic in a table. FIGURE 63 Top Port Traffic monitor The Top Port Traffic monitor includes the following data: • Widget title — The name of the widget. • View Details icon — Click to launch the Detailed View page. • Widget summary — The product count for each status (worst to best) displays underneath the widget title.
Dashboard customization 6 • Port Number — The port number. • State — The port state (for example, Enabled). • Status — The port status (for example, Up). 2. Click the close (X) button. Top Port Underflow Errors monitor The Top Port Underflow Errors performance monitor displays the top ports with underflow errors in a table. The Top Port Underflow Errors performance monitor includes the following data: • Widget title — The name of the widget. • View Details icon — Click to launch the Detailed View page.
6 Dashboard customization 2. Click the close (X) button. Top Port Utilization Percentage monitor The Top Port Utilization monitor (Figure 64) displays the top port utilization percentages in a table. FIGURE 64 Top Port Utilization monitor The Top Port Utilization monitor includes the following data: • Widget title — The name of the widget. • View Details icon — Click to launch the Detailed View page.
Dashboard customization 6 A more detailed widget displays which includes the following data: • Scope — The scope configured for the dashboard. • Port — The port affected by this monitor. Click to launch the Port Page (refer to “Port summary view” on page 225). When you launch the Port page, the detailed view closes.
6 Dashboard customization Viewing additional details for the Bottom Port Utilization Percentage monitor 1. Click the View Details icon. FIGURE 67 Bottom Port Utilization Detailed View A more detailed widget displays which includes the following data: • Scope — The scope configured for the dashboard. • Port — The port affected by this monitor. Click to launch the Port Page (refer to “Port summary view” on page 225). When you launch the Port page, the detailed view closes.
Dashboard customization 6 Top Product CPU Utilization monitor The Top Product CPU Utilization monitor (Figure 68) displays the top product CPU utilization percentages in a table. FIGURE 68 Top Product CPU Utilization monitor The Top Product CPU Utilization monitor includes the following data: • Widget title — The name of the widget. • View Details icon — Click to launch the Detailed View page. • Widget summary — The product count for each status (worst to best) displays underneath the widget title.
6 Dashboard customization • Product — The product affected by this monitor. Click to launch the Product page for this device (refer to “Product summary view” on page 216). When you launch the Port page, the detailed view closes. • • • • • • • • • • • • • • Min — The minimum value of the measure in the specified time range. CPU Utilization Percentage — The CPU utilization percentages. Max — The maximum value of the measure in the specified time range. Fabric — The fabric to which the device belongs.
Dashboard customization 6 • Memory Utilization Percentage — The top memory utilization percentages. Pause on a rown to display the minimum, current, and maximum vaules for the selected row. This field also displays minimum (black) and maximum (red) pointers. Viewing additional details for the Top Product Memory Utilization monitor 1. Click the View Details icon.
6 Dashboard customization Top Product Response Time monitor The Top Product Response Time monitor (Figure 72) displays the top product response time in a table. FIGURE 72 Top Product Response Time monitor The Top Product Response Time monitor includes the following data: • Widget title — The name of the widget. • View Details icon — Click to launch the Detailed View page. • Widget summary — The product count for each status (worst to best) displays underneath the widget title.
Dashboard customization 6 • Product — The product affected by this monitor. Click to launch the Product page for this device (refer to “Product summary view” on page 216). When you launch the Product page, the detailed view closes. • • • • • • • • • • • • • • Min — The minimum value of the measure in the specified time range. Response Time (ms) — The top response time in milliseconds. Max — The maximum value of the measure in the specified time range. Fabric — The fabric to which the device belongs.
6 Dashboard customization • Temperature — The top temperatures. Pause on a rown to display the minimum, current, and maximum vaules for the selected row. This field also displays minimum (black) and maximum (red) pointers. • Fabric — The fabric to which the device belongs. Viewing additional details for the Top Product Temperature monitor 1. Click the View Details icon.
Dashboard customization 6 Top Products with Unused Ports monitor The Top Products with Unused Ports monitor (Figure 68) displays the top products with ports not in use in a table. FIGURE 76 Top Product CPU Utilization monitor The Top Products with Unused Ports monitor includes the following data: • Widget title — The name of the widget. • View Details icon — Click to launch the Detailed View page.
6 Inventory • • • • • • • • • • Product Type — The type of product (for example, switch). State — The product state (for example, Offline). Status — The product status (for example, Reachable). Tag — The product tag. Serial # — The serial number of the product. Model — The product model. Port Count — The number of ports on the product. Firmware — The firmware level running on the product. Location — The location of the product. Contact — A contact name for the product. 2. Click the close (X) button.
Inventory 6 Inventory expand navigation bar The Inventory expand navigation bar (Figure 55) is located on the left side of the page and provides a list of discovered fabric and products. FIGURE 78 Expand navigation bar The expand navigation bar contains a list of discovered fabrics and products. Click a fabric to display the Fabric Page in the center pane (“Fabric summary view” on page 211). Click the expand arrow to display the products in the fabric.
6 Inventory • Fabric Page — Displays the name of the selected fabric. • Refreshed time — Displays the time of the last application update. • Show/Hide pane arrow — Click to show or hide the Properties pane. FIGURE 81 Switch Details table The Switch Details table displays the following details for switches in the fabric: • Collapse/Expand button — Click to collapse or expand the view. • All — Displays the number of switches in the fabric.
Inventory • • • • Connected Switch — Displays the name of the switch connected to the port. • • • • Host IP — Displays the IP address of the host. 6 Symbolic Name — Displays the symbolic name (nickname) for the HBA port. Port Type — Displays the port type; for example, N_Port. Host Name — Displays the name of the host. The first three digits indicate the host’s operating system; for example, WIN or LIN. HBA Port Name — Displays the port name of the host.
6 Inventory The Events table displays the following details for events triggered in the fabric: • Collapse/Expand button — Click to collapse or expand the view. • All — Displays the total number of events triggered. • Emergency icon — Displays the total number of Emergency events triggered. Click to only display Emergency events in the table. • Alert icon — Displays the total number of Alert events triggered. Click to only display Alert events in the table.
Inventory 6 Viewing fabric properties To view fabric properties, complete the following steps. 1. Click the Inventory icon. 2. Select a fabric in the Product List pane. The fabric summary displays with two panes: Fabric Page and Properties. The fabric properties displays on the right side of the page. FIGURE 85 Fabric Properties pane The fabric properties pane contains the following fields: • Highlights area - Name — Displays the name of the selected fabric.
6 Inventory Product summary view The Product summary displays the Product List, summary, and properties panes for the selected product. Viewing the product summary To view product properties, complete the following steps. 1. Click the Inventory icon. 2. Select a product in the Product List pane. The product summary displays with two panes: Product Page and Properties. FIGURE 86 Product summary 3. Review the product summary data.
Inventory FIGURE 88 6 Product Performance area The Product Performance area displays the following information for the selected product: • Collapse/Expand button — Click to collapse or expand the view. • Avg. CPU Utilization — Displays the average percentage of CPU utilization in graphical format. • Avg. Memory Utilization — Displays the average percentage of memory utilization in graphical format. • Up Time (in days) — Displays the number of days the product has been up and running.
6 Inventory • Show/Hide Legend button — Click to show or hide the performance graph legend. • Close Performance button — Click to close the performance graph or table. • Update button — Select or clear the ports in the table and click to update the graph or table. • Settings button — Click to change the port measure selection you want to include in the graph or table or to change the time scope for the graph or table.
Inventory 6 • Table button — Click to show the performance data in a table. The table includes the flow measures you selected and the time the flow measure was collected. • Unnamed check box — Select the check box for each flow you want to include in the graph. Select the check box in the table header to select all flows in the table. • • • • • • Sub Flow Id — Displays the ID of the sub flow. Name — Displays the name of the flow defined in the flow definition.
6 Inventory • • • • Time — Displays the time on the server when the violation was reported. Rule Condition — Displays the conditions defined in the MAPS policy that was triggered. Product — Displays the name of the product. Object Name — Displays the object (such as switch name, port name, FRU name, and so on) on which the violation occurred. • Fabric Name — Displays the Fabric name to which the object belongs.
Inventory 6 • Severity — Displays the severity icon for the event. When the same event (Warning or Error) occurs repeatedly, the Management application automatically eliminates the additional occurrences. • • • • Time — Displays the time and date the event last occurred on the server. Description — Displays a description of the event. Source Name — Displays the product on which the event occurred. Source Address — Displays the IP address (IPv4 or IPv6 format) of the product on which the event occurred.
6 Inventory FIGURE 92 Settings dialog box 5.
Inventory 6 • 3 Days — Displays data for 3 days. • 1 Week — Displays data for 1 week. • 1 Month — Displays data for 30 days. 7. Click Apply. The port performance graph displays in the Port Details area. 8. Add ports to the graph by selecting the check box for each port you want to include in the graph. Select the check box in the table header to select all ports in the table. Remove ports from the graph by clearing the check box. 9. Click Update.
6 Inventory 7. Click Apply. The Flows performance graph displays in the Flows area. 8. Add flows to the graph by selecting the check box for each flow you want to include in the graph. Select the check box in the table header to select all flows in the table. Remove flows from the graph by clearing the check box. 9. Click Update. Viewing product properties To view product properties, complete the following steps. 1. Click the Inventory icon. 2. Select a product in the Product List pane.
Inventory • • • • • • • • • • • 6 Name — Displays the name of the product. Fabric — Displays the fabric name in which the product is located. IP Address — Displays the IP address of the product. WWN — Displays the WWN of the product. Product Type — Displays the type of product. Model — Displays the model number of the product. Serial # — Displays the serial number of the product. Factory Serial # — Displays the factory serial number of the product. Status — Displays the status of the product.
6 Inventory FIGURE 94 Port summary 4. Review the port summary data. The Ports Details area displays the following data for the selected product: • Collapse/Expand button — Click to collapse or expand the view. • Performance graph/table — Displays the performance data when configured. To configure a graph or table, refer to “Configuring a port measure performance graph” on page 221. • Show/Hide Legend button — Click to show or hide the performance graph legend.
Inventory • • • • • 6 Performance graph/table — Displays the performance data when configured. Show/Hide Legend button — Click to show or hide the performance graph legend. Close Performance button — Click to close the performance graph or table. Update button — Select or clear a flow and click to update the graph or table. Settings button — Click to change the measure selection you want to include in the graph or table or to change the time scope for the graph or table.
6 Inventory FIGURE 95 Violations table The Violations table displays the Monitoring and Alerting Suite (MAPS) violations for the product over the selected time duration. • show arrow — Click to display the following additional detail for the associated violation: - Time — Displays the time on the server when the violation was reported. - Product — Displays the name of the product. - Object Name - Rule Condition — Displays the conditions defined in the MAPS policy that was triggered.
Inventory • • • • 6 - Fabric Name — Displays the Fabric name to which the object belongs. - Rule Name — Displays the name of the rule. A rule associates a condition with actions that need to be triggered when the specified condition is evaluated to be true. Category — Displays the MAPS category (such as Port, Switch Status, Fabric, FRU, Security, Resource, FCIP, and Traffic/Flows). Time — Displays the time on the server when the violation was reported.
6 Inventory FIGURE 96 Port Properties pane 4. Review the port properties data. The port Properties pane displays on the right side of the page. For FC and GigE port properties, the Highlights area displays the following data for the selected port. • • • • • • • • • Fabric — Displays the IP address of the fabric. Switch — Displays the name of the switch. Name — Displays the port name. Slot/Port# — Displays the slot and port number. User Port# — Displays the number of the user port.
Events • • • • Port Type — Displays the type of port, for example, U_port. • • • • • • • • Forward Error Correction(FEC) — Displays whether FEC is enabled or disabled. 6 Port WWN — Displays the port’s world wide name. Protocol — Displays the network protocol, for example, Fibre Channel. Long Distance Settings — Displays whether the connection is considered to be normal or longer distance. Encryption — Displays whether encryption is enabled or disabled.
6 Events • All — Displays the total number of events triggered. • Emergency icon — Displays the total number of Emergency events triggered. Click to only display Emergency events in the table. • Alert icon — Displays the total number of Alert events triggered. Click to only display Alert events in the table. • Critical icon — Displays the total number of Critical events triggered. Click to only display Critical events in the table. • Error icon — Displays the total number of Error events triggered.
Reports Icon 6 Description Previous page — Click to return to the previous page in the report. Unavailable when you are on the first page of the report. Next page — Click to move to the next page in the report. Unavailable when you are on the last page of the report. Last page — Click to move to the last page in the report. Unavailable when you are on the last page of the report. Reports Reports are available from the Reports page.
6 Reports Reports expand navigation bar The Reports expand navigation bar (Figure 55) is located on the left side of the page and provides a list of reports. When you select a report group or report in the Reports expand navigation bar, the the Reports, Schedules, and Templates tabs refresh to include the selected subset of reports. FIGURE 99 Expand navigation bar The expand navigation bar contains the following components: 1. All Templates — Select to access the Templates tab. 2.
Reports Icon 6 Description Next page — Click to move to the next page. Unavailable when you are on the last page. Last page — Click to move to the last page. Unavailable when you are on the last page. Generating a report You can generate a report from the Generated Reports tab in the Reports page. 1. Select a report in the Reports expand navigation bar. 2. Click Generate New Report. Depending on the report you select, the Select Fabric or Select Switch dialog box displays.
6 Reports FIGURE 101 Select Switch dialog box 3. Double-click the fabric or switch in the Available list to move it to the Selected list. You can only select one fabric or switch on which you want to run a report. Remove the fabric or switch from the Selected list by double-clicking the fabric or switch. 4. Click OK. When report generation is complete, the report displays in a new browser tab and a new entry displays in the Generated Reports tab.
Reports 6 Viewing generated reports 1. Click the Reports icon. 2. Click the Generated Reports tab. A list of generated reports display in the right pane. The Reports tab contains the following information in table format: • Name — The name of the generated report. The generated report name uses the following format: __. • Date — The date and time the report was generated.
6 Reports Deleting reports, schedules, or templates You can delete generated reports, schedules, and report templates from the respective tab. You can only delete items that you create or generate. You cannot delete default templates. 1. Select the appropriate tab. 2. Select one or more items that you want to remove from the list and click Delete. 3. Click OK on the confirmation message.
Reports 6 Configuring a new schedule You can schedule one or more reports to generate at a specific frequency. 1. Click the Reports icon. 2. Click the Schedules tab. A list of scheduled reports display. FIGURE 104 Schedules tab The Schedules tab contains the following information in table format: • check box — Click to select a schedule. • unnamed column — Displays whether the schedule is activated (no icon) or suspended (Suspend icon). • Name — The name of the schedule.
6 Reports FIGURE 105 Add Schedule dialog box - General tab 4. Enter a unique name for the schedule in the Name field. The name can be up to 128 characters. 5. Select the report templates that you want to include in the schedule from the Available Templates list. 6. Click Add. 7. Select a report in the Selected Templates and Criteria list. Depending on the reports you selected, you may need to enter parameters.
Reports 6 FIGURE 106 Add Schedule dialog box - Schedule Settings tab 10. Select the frequency (Hourly, Daily (default), Weekly, Monthly, and Yearly) from the Frequency list. Depending on the frequency you select, different date and time fields display. 11. Enter the time (hour and minutes) that you want to generate the report in the Time field. 12. Enter the date that you want to generate the report in the Date field. 13. Select the format (PDF, XLS, or CSV) for the report from the Format list.
6 Reports FIGURE 107 Select Fabric dialog box 3. Double-click the fabric that you want to include in the report. 4. Click Ok on the Select Fabric dialog box. Selecting switches The Switch Report requires that you select a switch from a list of discovered switches. 1. Select one of the Switch reports in the Selected Templates and Criteria list. 2. Click Choose Switch. The Select Switch dialog box displays.
Reports 6 3. Double-click the switch that you want to include in the report. 4. Click Ok on the Select Switch dialog box. Viewing reports from a schedule 1. Click the Reports icon. 2. Click the Schedule tab. 3. Click the date and time of the reports in the Last Used column. The Last Run Reports for Schedule dialog box displays. 4. Click the name of the report you want to view from the list of reports in the schedule. The report launches in a new browser tab.
6 Reports Editing a schedule You can edit existing schedules or create a new schedule from an existing schedule. 1. Click the Reports icon. 2. Click the Schedules tab. A list of scheduled reports display. 3. Select the schedule you want to edit and click Edit. The Edit Schedule dialog box displays with the current configuration of the selected schedule. 4. Configure a new schedule from an existing schedule by entering a unique name for the schedule in the Name field. The name can be up to 128 characters.
Reports 6 Activating a schedule To activate a schedule, complete the following steps. 1. Click the Reports icon. 2. Click the Schedules tab. A list of scheduled reports display. 3. Select the schedule you want to activate and click Activate. Deactivating a schedule To deactivate a schedule, complete the following steps. 1. Click the Reports icon. 2. Click the Schedules tab. A list of scheduled reports display. 3. Select the schedule you want to deactivate and click Deactivate.
6 Reports Viewing report templates You can import external report design (.rptdesign) files into the Management application. The report title must be unique. 1. Click the Reports icon. The Reports page displays with two panes: Templates list and Reports tabs. 2. Click All Templates in the Templates list. 3. Click the Templates tab. A list of existing report templates display. The Templates tab includes the following fields and components: • Templates table — Displays a list of all reports.
Reports 6 • “Zone Summary reports” on page 257 • “Host Adapter Inventory reports” on page 259 • “Host Adapter with Unsupported and Faulty SFP reports” on page 260 Exporting report templates You can only export a non-default report template that you previously imported. You can only export one report template at a time. 1. Click the Reports icon. 2. Click the Templates tab. A list of existing report templates display. 3. Select a report and click Export. The Save dialog box displays.
6 Reports Removing a report from the shared templates You can only stop sharing reports that you create. 1. Click the Reports icon. 2. Click the Templates tab. A list of existing report templates display. 3. Select one or more reports that you want to remove from the shared templates and click Un-Share. Default reports The Management application web client provides default reports for both SAN and IP products. Presenting and archiving data about a network is equally as important as gathering the data.
Reports 6 Fabric Summary report The Fabric Summary report provides a summary of the discovered fabrics, switches and Access Gateway (AG) devices associated with the fabric as well as ISL and trunk details. Table 20 describes the fields and components of the Fabric Summary Report. For general report content and table functions, refer to “Report content and functions” on page 261.
6 Reports TABLE 20 Fabric Summary report fields and components (Continued) Field/Component Description State The state for the switch. For example, online or offline. Operational Status The operational status of the switch. For example, healthy, operational, degraded, marginal, down, failed, unknown, or unreachable. Previous Operational Status The previous operational status of the switch. Unreachable Time The date and time the switch became unreachable.
Reports TABLE 20 6 Fabric Summary report fields and components (Continued) Field/Component Description Switch Name The name of the switch. Click to launch the Switch report. Switch WWN The world wide name of the virtual switch. Switch IP Address The IP address of the physical switch. Click to launch the Switch report. Port Name The port name. Port WWN The world wide name of the port. FC Address The FC address of the port. Domain ID The domain ID of the switch.
6 Reports TABLE 20 Fabric Summary report fields and components (Continued) Field/Component Description Port Speed (Gbps) The switch port speed. Port Status The switch port status. Port Type The switch port type. Physical/Logical Port Whether the port is Physical or Logical. Zone Alias The zone alias to which the switch port belongs. Bottleneck Port Status The current bottleneck port status. N to F Port Details 252 IP Address The switch IP address of the access gateway (AG).
Reports 6 Fabric Ports report The Fabric Ports Report provides a summary of the discovered ports including used and unused ports. Port data for each fabric is divided into three parts: Fabric-wide port details, Switch-wide port details, and individual port details. Table 21 describes the fields and components of the Fabric Ports report. For general report content and table functions, refer to “Report content and functions” on page 261.
6 Reports TABLE 21 Fabric Ports report fields and components (Continued) Field/Component Description Domain ID /Port # The domain ID of the switch. Device Name The name of the connected device. Device Vendor The vendor of the connected device. Role The role of the connected device. Connected Device/Switch WWN The world wide name of the connected device. Port Name The switch port name. Port Speed(Gbps) The switch port speed. Port Status The switch port status.
Reports TABLE 21 6 Fabric Ports report fields and components (Continued) Field/Component Description Port Status The status of the port to which the AG is connected. Port State The state of the port to which the AG is connected. Port Type The type of port the AG is connected to. Should typically be E-Port Physical/Logical Port Whether the port connected to the AG is Physical or Logical. Switch Report The Switch Report provides a information about the selected switch and ports.
6 Reports TABLE 22 Switch Report fields and components (Continued) Field/Component Description IP Address The IP address (IPv4 or IPv6 format) of the switch port. Switch Name The name of the switch. Domain ID/Port # The domain ID for the switch and port number. Connected Device details The information about the device connected to this port. Device Name The name of the connected device. Device Vendor The vendor name of the connected device.
Reports TABLE 22 6 Switch Report fields and components (Continued) Field/Component Description Port Speed(Gbps) The port speed for the F_port. Port Status The switch port status. Port State The switch port state. Port Type The AG port type. Physical/Logical Port Whether the AG port is Physical or Logical. Device Name The name of the connected device. Device Vendor The vendor of the connected device. Role The role of the connected device. Node WWN The node WWN of the connected device.
6 Reports TABLE 23 Zoning Summary report fields and components (Continued) Field/Component Active Status Description Whether the zone is active or not. Zone Alias Details area Alias Name The name of the zone alias. Member Count The number of members in the zone alias. Logged-In Count The number of members logged into the zone alias. Active Status Whether the zone alias is active or not.
Reports 6 Host Adapter Inventory reports The Host Adapter Inventory Report provides a information about the selected Host. For general report content and table functions, refer to “Report content and functions” on page 261. Table 22 describes the fields and components of the Host Adapter Inventory Report. TABLE 24 Host Adapter Inventory Report fields and components Field/Component Description Host Details table Host Name The name of the Host. Host IP The IP address of the host.
6 Reports TABLE 24 Host Adapter Inventory Report fields and components (Continued) Field/Component Description Switch IP Address The IP address for the connected switch. Fabric Assigned Address The state (enabled or disabled) of the fabric-assigned address for the adapter. WWN Source The source of the world wide name. Options include: • Fabric — The WWN is assigned from the fabric. The fabric assigned address must be enabled. • Factory — The WWN is assigned at the factory.
Reports TABLE 25 6 Adapters Faulty SFP report fields and components (Continued) Field/Component Description Length Cu The length of the copper cable (for distances greater than 1 meter, where optimum performance is required). Vendor Name The vendor of the extended link. Vendor OUI The vendor’s organizational unique identifier (OUI). Vendor Part The part number of the extended link. Revision The revision level of the extended link.
6 Reports Icon Description First page — Click to return to the first page in the report. Unavailable when you are on the first page of the report. Previous page — Click to return to the previous page in the report. Unavailable when you are on the first page of the report. Next page — Click to move to the next page in the report. Unavailable when you are on the last page of the report. Last page — Click to move to the last page in the report. Unavailable when you are on the last page of the report.
Chapter 7 Dashboard Management In this chapter • Dashboard overview . . . . . . . . . . . . . . . . . . . . . . . . . . . . . . . . . . . . . . . . . . . • Default dashboards . . . . . . . . . . . . . . . . . . . . . . . . . . . . . . . . . . . . . . . . . . . . • Status widgets . . . . . . . . . . . . . . . . . . . . . . . . . . . . . . . . . . . . . . . . . . . . . . . . • Monitoring and Alerting Policy Suite widgets. . . . . . . . . . . . . . . . . . . . . . . . • Performance monitors . . . . . . . .
7 Dashboard overview FIGURE 110 Dashboard tab 1. Menu bar — Lists commands you can perform on the dashboard. For a list of Dashboard tab menu commands, refer to “Dashboard main menus” on page 1411. The dashboard also provides a shortcut menu to reset the dashboard back to the defaults. Reset the dashboard back to the default settings by right-clicking in the white space and selected Reset to Default. 2. Toolbar — Provides buttons that enable quick access to dialog boxes and functions.
Dashboard overview 7 8. Status bar — Displays the connection, port, product, fabric, special event, Call Home, and backup status, as well as Server and User data. For more information about the status bar, refer to “Status bar” on page 362. Dashboard toolbar The toolbar (Figure 111) is located beneath the menu bar and provides icons and buttons to perform various functions. FIGURE 111 Toolbar The toolbar contains the following icons and buttons: 1.
7 Dashboard overview Dashboard messages The dashboard message bar (Figure 112) only displays when Scope (Network Scope and Time Scope) has changed in other clients. You can also view all dashboard messages and clear them. FIGURE 112 Dashboard message bar The toolbar contains the following fields and components: 1. Details button — Use to view dashboard messages. 2. Close button — Use to close the dashboard message bar.
Dashboard overview 7 6. Options button — Use to share, unshare, export, and import a user-defined dashboard. For more information, refer to “Sharing a user-defined dashboard definition” on page 270, “Unsharing a user-defined dashboard definition” on page 270, “Exporting a user-defined dashboard definition” on page 270, and “Importing a user-defined dashboard definition” on page 271.
7 Dashboard overview Accessing a dashboard From the Dashboards expand navigation bar, double-click the dashboard you want to view. Options include: • IP Port Health — Displays preconfigured IP performance monitors. You can display additional status widgets and performance monitors in this dashboard. • Product Status and Traffic — Displays preconfigured status widgets and performance monitors. You can display additional widgets and monitors in this dashboard.
Dashboard overview 7. 7 Press Enter. The filter results display in the Dashboards expand navigation bar. To stop the filter, click the stop filter (X) icon in the Filter text box. Creating a user-defined dashboard You can create a dashboard and customize it with the status widgets and performance monitors you need to monitor your network. 1. Click the Dashboards expand navigation bar. 2. Click Add. The Add Custom Dashboard dialog box displays. 3. Enter a name and description for the dashboard.
7 Dashboard overview Sharing a user-defined dashboard definition You can share the user-defined dashboard with other users. The changes made in the shared dashboard will reflect to all the shared users. When the owner deletes a shared dashboard, it is unshared from all the shared users and removed from the Shared Dashboard list. 1. Click the Dashboards expand navigation bar. 2. Select a user-defined dashboard you want to share under My Dashboard, click Options and then select Share.
Dashboard overview 7 4. Click OK. The user-defined dashboard definition details are saved in a .zip file in a location that you specify. NOTE You cannot export an empty dashboard and published widgets. Importing a user-defined dashboard definition You can import a user-defined dashboard definition from the file system to the Management application. 1. Click the Dashboards expand navigation bar. 2. Select a user-defined dashboard you want to share under Dashboard, click Options, and then select Import.
7 Dashboard overview • Title — The name of the status widget. For more information, refer to “Status widgets” on page 281. • Description — A general description of the status widget. 4. Click the Performance tab (Figure 114). The preconfigured performance monitors display. You can create up to 100 performance monitors; however, you can only display up to 30 performance monitors. For more information about performance monitors, refer to “Performance monitors” on page 297.
Dashboard overview 7 Exporting the dashboard display You can export the current dashboard display (all widgets and monitors) or a selected widget or monitor in a .png format. 1. Select one of the following options from the Export list: • Dashboard — Exports the current dashboard. • Name — Exports the selected widget (where Name is the name of the widget or monitor on the dashboard). The Export Dashboard to PNG File or Export Name to PNG File dialog box displays. 2.
7 Dashboard overview Customizing the dashboard scope You can customize the dashboard display by setting the network scope and time scope in the Scope list (Figure 115). . FIGURE 115 Scope list Setting the network scope You can configure the dashboard to display all objects in your area of responsibility (AOR) or a subset of objects (fabrics, devices, or groups) using the network scope selection. Default network scopes are visible to all users.
Dashboard overview 7 • Any system-defined group • Any user-defined group (IP product and port group) • Any user-defined customized network If you select a fabric scope, dashboard widgets display data for all products and ports in the fabric. If you select a product scope, dashboard widgets display data for the selected products and the ports that belong to the selected products. If you select a port scope, dashboard widgets display data for the specified ports and the products to which the ports belong.
7 Dashboard overview FIGURE 116 Edit Scopes dialog box 4. Click Add. A new network scope displays in the Network Scopes list. 5. Enter a name for the scope in the Name field. 6. Select one of the following options: • Fabrics — Select to create your network from one or more fabrics. • Products — Select to create your network from one or more products or product groups. • Ports — Select to create your network from one or more ports or port groups. 7.
Dashboard overview 7 5. To add objects, select one or more the objects you want to include in the network from the Available Targets list and click the right arrow button. The objects display in the Selected Targets list. 6. To remove an object from the Selected Targets list, select it and click the left arrow button. 7. Click OK to save your changes and close the Edit Scopes dialog box. Deleting a user-defined network scope You can delete any user-defined network scope. 1. Click the Scope list. 2.
7 Dashboard overview • Historical — Displays data for a specific date and time based on the selected network scope and duration. The Historical option displays a calender with a 30-day timeline. The end date in the calendar is the current date and the calendar will show the last 30 days from the current date. You select a specific date in the last 30 days from current date, for which you want to display data. When you select the Historical option, a message bar (Figure 117) displays.
Dashboard overview 7 Dashboard playback You can use dashboard control buttons (Pause, Rewind, and Forward) to view the available data of the dashboard and widgets in playback mode. Auto-refresh of data will not occur in playback mode. • Pause button — Use the Pause button to pause function in playback mode. • Rewind or Forward button — Use the Rewind or Forward button in playback mode to show the data automatically for every 20 seconds based on the selected time scope.
7 Default dashboards Default dashboards The Management application provides preconfigured dashboards which provide high-level overview of the network, the current states of managed devices, and performance of devices, ports, and traffic on the network.
Status widgets 7 Status widgets The Management application provides the following preconfigured status widgets: • Bottlenecked Ports widget — Table view of bottlenecked ports and number of violations for each bottlenecked port in the SAN. There are four versions of this monitor based on the type of port: All ports, initiator ports, ISL ports, and Target ports.
7 Status widgets • Port — The port identifier, such as port name, number, address, WWN, user port number, or zone alias. • Connected_Port_Link (where Connected_Port_Link is Connected Port, Initiator, or Target) — Displays one of the following: - Connected Port — The ISL or IFL port on the connected device. Click to launch the switch port properties dialog box. - Initiator — The initiator port on the connected device. Click to launch the device properties dialog box.
Status widgets 7 Bottleneck Graph dialog box The Bottleneck Graph dialog box (Figure 119) displays the statistics for the selected ports based on the time period. FIGURE 119 Bottleneck Graph dialog box The Bottleneck Graph dialog box displays event information for a specific duration by selecting one of the following from the time period: • If the dashboard time period is 30 minutes, then the Display Range is 30 minutes and the Display Interval is 60 seconds.
7 Status widgets Events widget The Events widget (Figure 120) displays the number of events by severity level for a specified network scope, specified time scope, and duration as a stacked bar graph. FIGURE 120 Events widget The Events widget includes the following data: • Severity icon/widget title/event count — The color of the worst severity followed by the event count with that severity displays before the widget title.
Status widgets 7 The x-axis represents the number of occurrences of a particular event severity during the selected time period. If you pause on a bar, a tooltip shows the number of events with that severity level during the selected time period. Also, for each severity, the cumulative number of traps, application events, and security events is reported next to the horizontal bar. If Syslog messages are included, then they are included in the count.
7 Status widgets • Severity icon/Host product count/widget title — The color of the worst severity and the Host product count with that severity displays before the widget title. • Group By list — Use to customize this widget to display a specific grouping. Options include: Model (default), Location, Driver, BIOS, and OS Type. • Bar chart — Displays each group as a separate bar on the graph. Displays the current state of all Host products discovered for a group in various colors on each bar.
Status widgets 7 SAN Inventory widget The SAN Inventory widget (Figure 122) displays the SAN products inventory as stacked bar graphs. FIGURE 122 SAN Inventory widget The SAN Inventory widget includes the following data: • Severity icon/product count/widget title — The color of the worst severity followed by the number of products with that severity displays before the widget title. • Group By list — Use to customize this widget to display a specific group of products.
7 Status widgets Customizing the SAN Inventory widget You can customize the SAN Inventory widget to display the product inventory for a specific group. The group type and number of devices in the group displays to the left of the associated bar; for example, v7.0.0 [3], where v7.0.0 is the firmware number and [3] is the number of devices running that firmware level. • Change the grouping by selecting one of the following from the Group By list: - Firmware — The product inventory by firmware release.
Status widgets 7 SAN Status widget The SAN Status widget (Figure 123) displays the device status as a pie chart. FIGURE 123 SAN Status widget The SAN Status widget includes the following data: • Severity icon/product count/widget title — The color of the worst status followed by the number of products with that status displays before the widget title. • Pie chart — The device status as a percentage of the total number of devices. The pie chart displays the percentage in various colors on each slice.
7 Status widgets Viewing additional SAN product data 1. Double-click a section in the SAN Status widget. The SAN Products - Status dialog box (where Status is the section of the widget you selected) displays with the following fields and components: • • • • • • • • • • • • Product — The product name. Fabric — The fabric associated with the product. Product Type — The type of product. State — The state for the product and the port. Status — The status for the product and the port.
Status widgets • • • • • 7 Fibre Channel Fabrics — The number of managed fabrics. SAN Switches — The number of managed SAN switches. SAN Physical Switches — The number of discovered physical SAN switches. Hosts — The number of managed hosts. Time Scope — The time scope. VM Alarms widget NOTE Enabling the VM Alarms widget requires discovery of vCenters. The VM Alarms widget displays the vCenter alarms for the specified fabric and time range in a table.
7 Monitoring and Alerting Policy Suite widgets Monitoring and Alerting Policy Suite widgets NOTE MAPS is only supported on a licensed version of the Management application with SAN management. NOTE MAPS is only supported on FC devices running Fabric OS 7.2.0 or later with the Fabric Vision license. NOTE MAPS is not supported on DCB devices.
Monitoring and Alerting Policy Suite widgets 7 Out of Range Violations widget The Out of Range Violations widget (Figure 125) displays the number of violations for each MAPS category, Fabric Watch category, and the number of network objects (such as ports, trunks, switches, and circuits) for SAN devices with the MAPS violation and Fabric Watch violation based on the selected fabric and a specified time range. By default, this widget refreshes every minute.
7 Monitoring and Alerting Policy Suite widgets • Network Object Count — The number and network object type (such as switch, virtual machine, port, trunk, and so on) with a MAPS and Fabric Watch violation for each category. Always displays whether or not there is a violation. NOTE For FCIP Health, the Network Object Count is based on the number of VE_port and circuit combinations with a MAPS violation.
Monitoring and Alerting Policy Suite widgets 7 Port Health Violations widget The Port Health Violations widget (Figure 126) displays the number of violations for each product based on the selected fabric and a specified time range. There are four port health violation widgets: All, ISL, Initiator, and Target.
7 Monitoring and Alerting Policy Suite widgets • Protocol Errors — The number of times a protocol error occurs on a port. • Link Reset — The ports on which the number of link resets exceed the specified threshold value. • C3TXTO — The number of Class 3 discards frames because of timeouts. • State changes — The state of the port has changed for one of the following reasons: - The port has gone offline. - The port has come online. - The port is faulty.
Performance monitors 7 Performance monitors The performance monitors provide a high-level overview of the performance on the network. This allows you to easily check the performance of devices, ports, and traffic on the network. The performance monitors also provide several features to help you quickly access performance metrics and reports. The dashboards update every ten minutes regardless of the currently selected tab (SANor Dashboard) or the SAN size.
7 Performance monitors TABLE 27 Preconfigure performance monitors Monitor title Description Data collectors Top Port Sync Losses Table view of the top port synchronization losses. There are four versions of this monitor based on the type of port: All ports, initiator ports, ISL ports, and Target ports.
Performance monitors 7 Top Port Alignment Errors monitor The Top Port Alignment Errors performance monitor displays the top ports with alignment errors in a table. The Top Port Alignment Errors performance monitor includes the following data: • Threshold icon/object count/monitor title — The color associated with the threshold and number of objects within that threshold displays next to the monitor title. • Port — The port affected by this monitor.
7 Performance monitors Top Port C3 Discards monitor The Top Port C3 Discards monitor (Figure 127) displays the top ports with Class 3 frames discarded in a table. There are four port widgets: All, ISL, Initiator, and Target. FIGURE 127 Top Port C3 Discards monitor The Top Port C3 Discards monitor includes the following data: • Severity icon/monitor title — The worst severity of the data based on the error count shown next to the monitor title. • Port — The port affected by this monitor.
Performance monitors 7 • Refreshed — The time of the last update for the monitor. To customize the monitor to display data by a selected time frame as well as customize the display options, refer to “Editing a preconfigured performance monitor” on page 323. Accessing additional data from the Top Port C3 Discards monitor • Right-click a row in the monitor to access the shortcut menu available for the associated device. For more information about shortcut menus, refer to “SAN shortcut menus” on page 1422.
7 Performance monitors • C3 Discards RX TO/sec — The number (error rate) of Class 3 frames received at this port and discarded at the transmission port due to timeout errors per second for the duration specified in the monitor. • C3 Discards RX TO — The number (error count) of Class 3 frames received at this port and discarded at the transmission port due to timeout errors for the duration specified in the monitor. • • • • • • • • C3 Discards — The number of Class 3 frames discarded.
Performance monitors 7 Top Port CRC Errors monitor The Top Port CRC Errors monitor (Figure 129) displays the top ports with frames that contain cyclic redundancy check (CRC) errors in a table. FIGURE 129 Top Port CRC Errors monitor The Top Port CRC Errors monitor includes the following data: • Severity icon/monitor title — The worst severity of the data based on the error count shown next to the monitor title. • Port — The port affected by this monitor.
7 Performance monitors • • • • Port Number — The port number. State — The port state (for example, Enabled). Status — The port status (for example, Up). Refreshed — The time of the last update for the monitor. To customize the monitor to display data by a selected time frame as well as customize the display options, refer to “Editing a preconfigured performance monitor” on page 323.
Performance monitors 7 • Connected_Port_Link (where Connected_Port_Link is Connected Port, Initiator, or Target) — Displays one of the following: - Connected Port — The ISL or IFL port on the connected device. Click to launch the switch port properties dialog box. - Initiator — The initiator port on the connected device. Click to launch the device properties dialog box. - Target — The target port on the connected device. Click to launch the device properties dialog box.
7 Performance monitors Top Port Link Failures monitor The Top Port Link Failures monitor (Figure 131) displays the top ports with link failures in a table. FIGURE 131 Top Port Link Failures monitor The Top Port Link Failures monitor includes the following data: • Severity icon/monitor title — The worst severity of the data based on the error count shown next to the monitor title. • Port — The port affected by this monitor.
Performance monitors 7 To customize the monitor to display data by a selected time frame as well as customize the display options, refer to “Editing a preconfigured performance monitor” on page 323. Accessing additional data from the Top Port Link Failures monitor • Right-click a row in the monitor to access the shortcut menu available for the associated device. For more information about shortcut menus, refer to “Application menus” on page 1411.
7 Performance monitors • TX Link Resets/sec — The number (error rate) of transmit link reset errors for the duration specified in the monitor. • • • • • • • • TX Link Resets — The number (error count) of transmit link reset errors. Product — The product affected by this monitor. Type — The type of port (for example, U-Port). Identifier — The port identifier. Port Number — The port number. State — The port state (for example, Enabled). Status — The port status (for example, Up).
Performance monitors 7 • Connected_Port_Link (where Connected_Port_Link is Connected Port, Initiator, or Target) — Displays one of the following: - Connected Port — The ISL or IFL port on the connected device. Click to launch the switch port properties dialog box. - Initiator — The initiator port on the connected device. Click to launch the device properties dialog box. - Target — The target port on the connected device. Click to launch the device properties dialog box.
7 Performance monitors • • • • • Identifier — The port identifier. Port Number — The port number. State — The port state (for example, Enabled). Status — The port status (for example, Up). Refreshed — The time of the last update for the monitor. To edit a port performance monitor, refer to “Editing a preconfigured performance monitor” on page 323. Top Port Runtime Errors monitor The Top Port Runtime Errors performance monitor displays the top ports with runtime errors in a table.
Performance monitors 7 Top Port Sync Losses monitor The Top Port Sync Losses monitor (Figure 134) displays the top ports with synchronization failures in a table. FIGURE 134 Top Port Sync Losses monitor The Top Port Sync Losses monitor includes the following data: • Severity icon/monitor title — The color of the worst severity of the data shown next to the monitor title. • Port — The port affected by this monitor.
7 Performance monitors • Status — The port status (for example, In_Sync, No_Sync). • Refreshed — The time of the last update for the monitor. To customize the monitor to display data by a selected time frame as well as customize the display options, refer to “Editing a preconfigured performance monitor” on page 323. Accessing additional data from the Top Port Link Resets monitor • Right-click a row in the monitor to access the shortcut menu available for the associated device.
Performance monitors 7 Top Port Traffic monitor The Top Port Traffic monitor (Figure 135) displays the top ports with receive and transmit traffic in a table. FIGURE 135 Top Port Traffic monitor The Top Port Traffic monitor includes the following data: • Severity icon/monitor title — Displays the worst severity of the data shown next to the monitor title. NOTE The Top Port Traffic widget displays the threshold colors based on the port speed.
7 Performance monitors • Status — The port status (for example, Up). • Refreshed — The time of the last update for the monitor. To customize the monitor to display data by a selected time frame as well as customize the display options, refer to “Editing a preconfigured performance monitor” on page 323. Accessing additional data from the Top Port Traffic monitor • Right-click a row in the monitor to access the shortcut menu available for the associated device.
Performance monitors 7 Top Port Utilization Percentage monitor The Top Port Utilization monitor (Figure 136) displays the top port utilization percentages in a table. FIGURE 136 Top Port Utilization monitor The Top Port Utilization monitor includes the following data: • Severity icon/monitor title — The worst severity of the data shown next to the monitor title. • Port — The port affected by this monitor.
7 Performance monitors Accessing additional data from the Top Port Utilization monitor • Right-click a row in the monitor to access the shortcut menu available for the associated device. For more information about shortcut menus, refer to “Application menus” on page 1411. • Double-click a row to navigate to the Historical Graphs/Tables dialog box. For more information, refer to “Performance Data” on page 1067.
Performance monitors 7 • State — The port state (for example, Enabled). • Status — The port status (for example, Up). • Refreshed — The time of the last update for the monitor. To customize the monitor to display data by a selected time frame as well as customize the display options, refer to “Editing a preconfigured performance monitor” on page 323.
7 Performance monitors • • • • • • • • Tag — The product tag. Serial # — The serial number of the product. Model — The product model. Port Count — The number of ports on the product. Firmware — The firmware level running on the product. Location — The location of the product. Contact — A contact name for the product. Refreshed — The time of the last update for the monitor.
Performance monitors • • • • • • • • • • • • • 7 Max — The maximum value of the measure in the specified time range. Fabric — The fabric to which the device belongs. Product Type — The type of product (for example, switch). State — The product state (for example, Offline). Status — The product status (for example, Reachable). Tag — The product tag. Serial # — The serial number of the product. Model — The product model. Port Count — The number of ports on the product.
7 Performance monitors The Top Product Response Time monitor includes the following data: • Severity icon/response time/monitor title — The worst severity of the data and the response time displays next to the monitor title. • • • • • • • • • • • • • • • • Product — The product affected by this monitor. Min — The minimum value of the measure in the specified time range. Response Time (ms) — The top response time in milliseconds. Max — The maximum value of the measure in the specified time range.
Performance monitors 7 Top Product Temperature monitor The Top Product Temperature monitor (Figure 141) displays the top product temperature in a table. FIGURE 141 Top Product Temperature monitor The Top Product Temperature monitor includes the following data: • Severity icon/temperature/monitor title — The worst severity of the data and the temperature displays next to the monitor title. • • • • • • • • • • • • • • • • Product — The product affected by this monitor.
7 Performance monitors Accessing additional data from the Top Product Temperature monitor • Right-click a row in the monitor to access the shortcut menu available for the associated device. For more information about shortcut menus, refer to “Application menus” on page 1411. • Double-click a row to navigate to the Historical Graphs/Tables dialog box. For more information, refer to “Performance Data” on page 1067.
Performance monitors 7 • Location — The location of the product. • Contact — A contact name for the product. • Refreshed — The time of the last update for the monitor. To customize the monitor to display data by a selected time frame as well as customize the display options, refer to “Editing a preconfigured performance monitor” on page 323.
7 User-defined performance monitors • To specify a color based on hue, saturation, and lightness, click the HSL tab. Specify the hue (0 through 360 degrees), saturation (0 through 100%), lightness (0 through 100%), and transparency (0 through 100%). • To specify a color based on values of red, green, and blue, click the RGB tab. Specify the values for red (0 through 255), green (0 through 255), blue (0 through 255), and alpha (0 through 255).
User-defined performance monitors - 7 Ping Packet Loss Percentage — The ping packet loss percentage for the product. AP Client Count — The number of AP clients for the product. • Port - Common - FC - Port Utilization Percentage — The memory utilization percentage. Traffic — The traffic in mbps. CRC Errors — The number of CRC errors. Link Resets — The number of link resets. Signal Losses — The number of signal failures.
7 User-defined performance monitors - Slow Start Status — The number of slow starts. Current Compression Ratio — The current compression ratio for the FCIP tunnel. IP Errors — The number of errors. Discards — The number of discarded frames. Receive EOF — The number of end-of-frames received. Underflow Errors — The number of underflow errors. Overflow Errors — The number of overflow errors. Alignment Errors — The number of alignment errors.
User-defined performance monitors 7 Receive Word Count (bytes) — The received word count in bytes as reported in the last data point received for the flow. Transmit Throughput (Mbps) — The transmit throughput in megabytes per second as reported by the last data point. Receive Throughput (Mbps) — The received throughput in megabytes per second as reported by the last data point.
7 User-defined performance monitors • • • • • • • • • • • • • Max — The maximum value of the measure in the specified time range. Fabric — The fabric to which the device belongs. Product Type — The type of product (for example, switch). State — The product state (for example, Offline). Status — The product status (for example, Reachable). Tag — The product tag. Serial # — The serial number of the product. Model — The product model. Port Count — The number of ports on the product.
User-defined performance monitors 7 The top or bottom port performance monitor includes the following data: • Threshold icon/object count/monitor title — The color associated with the threshold and number of objects within that threshold displays next to the monitor title. • Severity icon/monitor title — The worst severity of the data based on the error count or error rate shown next to the monitor title. • Port — The port affected by this monitor.
7 User-defined performance monitors Distribution performance monitors The distribution performance monitor (Figure 145) displays the distribution (number) of products or ports for each of the five percentage ranges defined for the selected measure in a bar graph. FIGURE 145 Distribution performance monitor example The distribution performance monitor includes the following data: • Monitor title — The user-defined monitor title.
User-defined performance monitors TABLE 29 7 Port measures types Common • Port Utilization Percentage • Traffic • CRC Errors FC • Link Resets • Signal Losses • Sync Losses • Link Failures • Sequence Errors • Invalid Transmissions • C3 Discards • C3 Discards TX TO • C3 Discards RX TO • C3 Discards Unreachable • C3 Discards Other • Encode Error Out • SFP Power • SFP Voltage • SFP Current • SFP Temperature • Invalid Ordered Sets • BB Credit Zero • Truncated Frames FCIP • • • • • • • • • • • Cumulative C
7 User-defined performance monitors Time series performance monitors The time series performance monitors (Figure 146) display the selected measures in a chart. FIGURE 146 Time series performance monitor example The time series performance monitor includes the following data: • • • • • Monitor title — The user-defined monitor title. Value (y-axis) — The number of objects affected by this monitor. Time (x-axis) — The date and time the monitor collected the data.
User-defined performance monitors 7 Configuring a user-defined product performance monitor For creating a user-defined dashboard, refer to “Creating a user-defined dashboard” on page 269 and perform the following steps to configure a user-defined product performance monitor. 1. Click the Customize Dashboard icon. The Customize Dashboard dialog box displays. 2. Click the Performance tab. 3. Click Add. The Add Performance Dashboard Monitor dialog box displays. 4. Enter a unique title for the monitor.
7 User-defined performance monitors 9. (Top N, Bottom N, and Distribution monitors only) Configure threshold numbers and associated colors by completing the following steps. Depending on the monitor type you select, you can define up to four threshold numbers in increasing or decreasing order and up to five associated threshold colors.
User-defined performance monitors 7 Accessing additional data from user-defined product performance monitors • In a Distribution monitor, double-click a percentage range to navigate to the Measure_Type Distribution Data Details dialog box. For more information, refer to “Viewing product distribution data details” on page 339 or “Viewing port distribution data details” on page 340.
7 User-defined performance monitors 15. Click OK on the Customize Dashboard dialog box. The performance monitors display at the bottom of the dashboard. Configuring a user-defined port performance monitor For creating a user-defined dashboard, refer to “Creating a user-defined dashboard” on page 269 and perform the following steps to configure a user-defined port performance monitor. 1. Click the Customize Dashboard icon. The Customize Dashboard dialog box displays. 2. Click the Performance tab. 3.
User-defined performance monitors Common • Port Utilization Percentage • Traffic • CRC Errors FC • Link Resets • Signal Losses • Sync Losses • Link Failures • Sequence Errors • Invalid Transmissions • C3 Discards • C3 Discards TX TO • C3 Discards RX TO • C3 Discards Unreachable • C3 Discards Other • Encode Error Out • SFP Power • SFP Voltage • SFP Current • SFP Temperature • Invalid Ordered Sets • BB Credit Zero • Trucated Frames 7 FCIP • • • • • • • • • • • Cumulative Compression Ratio Latency Dropped
7 User-defined performance monitors (Distribution monitors only) The increasing order defaults are as follows: 0 through 20 displays green, 21 through 40 displays blue, 41 through 60 displays yellow, 61 through 80 displays orange, and 81 through 100 displays red. a. (Top N and Bottom N monitors only) Select the check box. b. Enter a number in the field. c. Click the color square to launch the Color dialog box. • To pick a color from a swatch, select the Swatches tab. Select a color from the display.
User-defined performance monitors 7 Viewing product distribution data details Each bar on the product distribution graph maps directly to one of the five percentage ranges defined for the distribution performance monitor (refer to “Distribution performance monitors” on page 330). 1. Double-click a bar in the graph. The Monitor_Title Data Details dialog box displays. 2. Review the data.
7 User-defined performance monitors Viewing port distribution data details Each bar on the port distribution graph maps directly to one of the five percentage ranges defined for the distribution monitor (refer to “Distribution performance monitors” on page 330). 1. Double-click a bar in the graph. The Monitor_Title Data Details dialog box displays. 2. Review the data. The port distribution data details include the following fields and components: • Port — The port affected by the selected measure.
User-defined performance monitors FCIP - Cumulative Compression Ratio — The cumulative compression ratio for the FCIP tunnel. Dropped Packets — The number of dropped packets. Link Retransmits — The number of retransmitted links. Timeout Retransmits — The number of retransmits due to timeout. Fast Retransmits — The number of fast retransmits triggered. Duplicate Ack Received — The number of duplicate acknowledgements received. Window Size RTT — The window size round trip time.
7 Traffic flow dashboard monitors Traffic flow dashboard monitors NOTE Traffic flow monitors are only supported on devices running Fabric OS 7.2 and later with the Fabric Vision license. You can use the dashboard to monitor traffic flows. To monitor a flow, you must first create and activate the flow in Flow Vision (refer to //link to flow vision//.
Traffic flow dashboard monitors 7 • Frame - Transmit Frame Count (frames) — The transmit frame count as reported in the last data point received for the flow. - Receive Frame Count (frames) — The received frame count as reported in the last data point received for the flow. - Transmit Frame Rate (f/s) — The transmit frame rate per second as reported in the last data point received for the flow.
7 Traffic flow dashboard monitors Traffic flow performance graph monitor The traffic flow performance monitors display (Figure 147) the selected measures in a chart. FIGURE 147 Traffic flow performance graph monitor example The traffic flows performance monitor includes the following data: • • • • Monitor title — The user-defined monitor title. Value (y-axis) — The number of objects affected by the selected measure. Time (x-axis) — The time the monitor collected the data.
Traffic flow dashboard monitors 7 Top or bottom traffic flow performance monitor The top or bottom traffic flow performance monitors (Figure 148) top or bottom number of flows for the selected measure in a table. FIGURE 148 Top traffic flow monitor example The top or bottom flow performance monitor includes the following data: • Threshold icon/object count/monitor title — The color associated with the threshold and the number of objects within that threshold are displayed next to the monitor title.
7 Traffic flow dashboard monitors Accessing additional data from traffic flow performance monitors • Right-click a row in the table to access the shortcut menu and select one of the following options: - Show Graph/Table — Launches the Flow Graphing dialog box with the selected measures (sub-flows) to be plotted. - Locate — Move the focus to the SAN tab with the associated switch highlighted. Monitor — Launches the Monitor - Flow Vision dialog box with the selected sub-flows in the Active Flows list.
Traffic flow dashboard monitors 7 Configuring a traffic flows monitor from a performance graph 1. Configure the performance graph. To configure a traffic flows performance graph, refer to //link to flow vision//. 2. Click Save As Widget to create a monitor of the graph data for the dashboard. The Historical Chart Monitor - Date_Time dialog box displays (where Date_Time is the date and time the monitor was created). 3. Modify the title, if necessary, and click OK. 4. Click OK on the message.
7 Traffic flow dashboard monitors 5. Select the traffic measure for the monitor in the Measure area: For Time Series monitors, you can select more than one measure.
Traffic flow dashboard monitors 7 • To specify a color based on values of red, green, and blue, click the RGB tab. Specify the values for red (0 through 255), green (0 through 255), blue (0 through 255), and alpha (0 through 255). • To specify a color based on values of cyan, magenta, yellow, and black, click the CMYK tab. Specify the values for cyan (0 through 255), magenta (0 through 255), yellow (0 through 255), black (0 through 255), and alpha (0 through 255).
7 Traffic flow dashboard monitors • LUN — The LUN values defined in the flow. • Bi-direction — Whether or not the flow is bi-directional. Valid values are Yes or No. 8. Select the flow targets from the Available Flow list and click the right arrow button to move the targets to the Selected Flow list. Remove targets from the monitor by selecting one or more targets in the Selected Flow list and clicking the left arrow button. 9. Click OK on the Performance Dashboard Monitor Targets dialog box.
Chapter 8 View Management In this chapter • SAN tab overview. . . . . . . . . . . . . . . . . . . . . . . . . . . . . . . . . . . . . . . . . . . . . . • Master Log . . . . . . . . . . . . . . . . . . . . . . . . . . . . . . . . . . . . . . . . . . . . . . . . . . . • Minimap . . . . . . . . . . . . . . . . . . . . . . . . . . . . . . . . . . . . . . . . . . . . . . . . . . . . . • Status bar. . . . . . . . . . . . . . . . . . . . . . . . . . . . . . . . . . . . . . . . . . . . . . . . . . . .
8 SAN tab overview SAN tab overview The SAN tab (Figure 150) displays the Product List, Topology Map, Master Log, Utilization Legend, and Minimap. NOTE When you launch the Management application or navigate to a new view, the SAN tab displays with a gray screen over the Product List and Topology Map while data is loading. You can change the default size of the display by placing the cursor on the divider until a double arrow displays. Click and drag the adjoining divider to resize the window.
SAN tab overview 8 6. Port Display buttons — Provides buttons that enable quick access to configuring how ports display. Not enabled until you discover a fabric or host. For more information, refer to “Port Display buttons” on page 355. 7. Connectivity Map toolbar — Provides tools for viewing the Connectivity Map as well as exporting the Connectivity Map as an image. Does not display until you discover a fabric. For more information, refer to “Connectivity Map toolbar” on page 355. 8.
8 SAN tab overview 9. Flow Vision — Displays the Flow Vision dialog box. Use to configure Flow Vision. 10. MAPS — Displays the MAPS dialog box. Use to configure MAPS. 11. Domain ID/Port # — Use to set the domain ID or port number to display as decimal or hex in the Product List. 12. Product Label — Use to set the product label for the devices in the Connectivity Map and Product List. 13. Port Label — Use to set the port label for the devices in the Connectivity Map and Product List. 14.
SAN tab overview 8 Port Display buttons The Port Display buttons are located at the top right of the Product List and enable you to configure how ports display. You have the option of viewing connected (or occupied) product ports, unoccupied product ports, or attached ports. Not enabled until you discover a fabric or host. NOTE Occupied/connected ports are those that originate from a device, such as a switch. Attached ports are ports of the target devices that are connected to the originating device.
8 SAN tab overview Product List The Product List, located on the SAN tab, displays an inventory of all discovered devices and ports. The Product List is a quick way to look up product and port information, including serial numbers and IP addresses. To display the Product List, select View > Show Panels > Product List or press F9. Note that the Product List can only display up to 9000 ports at a time.
SAN tab overview • • • • • • • • • • • 8 Protocol — Displays the protocol for the port. Serial # — Displays the serial number of the product. Speed Configured (Gbps) — Displays the actual speed of the port in Gigabits per second. State — Displays the state for the product and the port. Status — Displays the status for the product and the port. Symbolic Name — Displays the symbolic name for the port. TAG — Displays the tag number of the product. Vendor — Displays the name of the product’s vendor.
8 SAN tab overview FIGURE 154 Connectivity Map The Management application displays all discovered fabrics in the Connectivity Map by default. To display a discovered Host in the Connectivity Map, you must select the Host in the Product List. You can only view one Host and physical and logical connections at a time. Connectivity Map functions • Two-way selection — When you select an icon on the Topology Map, that device is highlighted in the Product List and vice versa.
Master Log 8 FIGURE 155 Utilization Legend The colors and their meanings are outlined in the following table. TABLE 30 Line Color Utilization Defaults Red line 80% to 100% utilization Yellow line 40% to 80% utilization Blue line 1% to 40% utilization Gray line 0% to 1% utilization Black line Utilization disabled For more information about the utilization legend, refer to “SAN connection utilization” on page 1112.
8 Master Log • Acknowledged — Whether the event is acknowledged or not. Select the check box to acknowledge the event. • Source Name — The product on which the event occurred. • Source Address — The IP address (IPv4 or IPv6 format) of the product on which the event occurred. 360 • • • • • • • • • • • • Origin — The event source type (for example trap, pseudo event, application, or syslog). • • • • • • First Event Product Time — The time and date the event first occurred on the product.
Minimap 8 Minimap The Minimap, which displays in the lower right corner of the main window, is useful for getting a bird’s-eye view of the topology, or to quickly jump to a specific place on the topology. To jump to a specific location on the topology, click that area on the Minimap. A close-up view of the selected location displays on the topology. Use the Minimap to view the entire topology and to navigate more detailed map views. This feature is especially useful if you have a large topology.
8 Status bar Status bar The status bar displays at the bottom of the main window. The status bar provides a variety of information about the SAN and the application. The icons on the status bar change to reflect different information, such as the current status of products, fabrics, and backup. FIGURE 157 Status Bar The icons on your status bar will vary based on the licensed features on your system. 1. Connection Status — Displays the Server-Client connection status.
Icon legend 8 8. Policy Monitor Status — Displays whether or not a policy monitor has failed or partially failed. Click to launch the Policy Monitor dialog box. For more information about policy monitors, refer to “Viewing configuration policy manager status” on page 1238. 9. Special Events — Displays whether or not a special event has been triggered. Click to launch the Special Events dialog box. For more information about special events, refer to “Creating an event action definition” on page 1280. 10.
8 Icon legend TABLE 31 Icon Description Icon Description VC module Multi-fabric VC module iSCSI Target iSCSI Initiator Host product icons The following table lists the manageable Host product icons that display on the topology. Fabric OS manageable devices display with blue icons. Unmanageable devices display with gray icons. Some of the icons shown only display when certain features are licensed.
Icon legend 8 SAN group icons The following table lists the manageable SAN product group icons that display on the topology. TABLE 33 Icon Description Icon Description Switch Group Host Group Storage Group Unknown Fabric Group Unmanaged Fabric Group Chassis Group Host group icons The following table lists the manageable Host product group icons that display on the topology.
8 Icon legend SAN port icons The following table lists the SAN port icons that display in the Product List. TABLE 35 Icon Description Occupied FC Port Unoccupied FC Port Attached FC Port Trunk (port group) IP and 10 GE Port Attached IP and 10 GE Port Attached-to-Cloud 10 GE Port Virtual Port Virtual FCoE Port Attached FCoE Port Pre-boot Virtual Port Virtual Attached Port Mirror Port Bottleneck Port SAN product status icons The following table lists the product status icons that display on the topology.
Icon legend 8 TABLE 36 Icon Status Unknown/Link Down Unreachable Event icons The following table lists the event icons that display on the topology and Master Log. For more information about events, refer to “Fault Management” on page 1255.
8 Customizing the main window Customizing the main window You can customize the main window to display only the data you need by displaying different levels of detail on the Connectivity Map (topology) or Product List. Zooming in and out of the Connectivity Map You can zoom in or out of the Connectivity Map to see products and ports. Zooming in To zoom in on the Connectivity Map, use one of the following methods: • Click the zoom-in icon ( ) on the Connectivity Map toolbar.
Customizing the main window 8 Showing levels of detail on the Connectivity Map You can configure different levels of detail on the Connectivity Map, making device management easier. Viewing fabrics To view only fabrics, without seeing groups, products, or ports, select View > Show> Fabrics Only. Viewing groups To view only groups and fabrics, without seeing products, or ports, select View > Show> Groups Only. Viewing products To view products, groups, and fabrics, select View > Show> All Products.
8 Customizing the main window • • • • Export information from the table Search for information Expand the table to view all information Collapse the table Displaying columns To only display specific columns, complete the following steps. 1. Right-click anywhere in the table and select Customize or Table > Customize. The Customize Columns dialog box displays. FIGURE 159 Customize Columns dialog box 2. Choose from the following options: • Select the check box to display a column.
Customizing the main window 8 Changing the order of columns To change the order in which columns display, choose from one of the following options. Rearrange columns in a table by dragging and dropping the column to a new location. OR 1. Right-click anywhere in the table and select Customize or Table > Customize. The Customize Columns dialog box displays. 2. Select the name of the column you want to move and use the Move Up button and Move Down button to move it to a new location. 3. Click OK.
8 Customizing the main window Exporting table information You can export the entire table or a specific row to a text file. 1. Choose from one of the following options: • Right-click anywhere in the table and select Table > Export Table. • Select the table row that you want to export and select Table > Export Row. The Save table to a tab delimited file dialog box displays. 2. Browse to the location where you want to save the file. 3. Enter the file name in the File Name field. 4. Click Save.
Product List customization 8 Product List customization NOTE Properties customization requires read and write permissions to the Properties - Add / Delete Columns privilege. You can customize the Product List by creating user-defined fabric, product, and port property labels. You can also edit or delete user-defined property labels, as needed. You can create up to three user-defined property labels from the Product List for each of the following object types: fabric, product, and port properties.
8 Search Editing a property label You can only edit labels that you create on the Product List. To edit a user-defined property label (column heading), complete the following steps. 1. Right-click the column heading on the Product List for the property you want to edit and select Edit Column. The Edit Property dialog box displays. 2. Change the label and description for the property, as needed. The label must be unique and can be up to 30 characters. The description can be up to 126 characters.
Search 8 The Search features contains a number of components. The following graphic illustrates the various areas, and descriptions of them are listed below. 1 2 3 4 1. Text field — Enter the text or unicode regular expression for which you want to search. 2. Search list — Select one of the following options: • Text option — Select this option if you entered a text string in the text field.
8 Search Restricting a search by node When a device is assigned to a product group, it may be listed in the Product node, as well as Product Groups node. Therefore the search results include the device under both the Product node and the Product Group node. NOTE Search does not search automatically collapsed fabrics. You must expand the fabric (right-click and select Expand) and repeat the search. NOTE To search for a device, the device must be discovered and display in the topology.
SAN view management overview 8 • Regular Expression — Enter a Unicode regular expression in the search text box. (For hints, refer to “Regular Expressions” on page 1495.) All products in the Product List that contain the search text display highlighted. This search is case insensitive. 3. Press Ctrl and click the search icon. The search results display highlighted. Example If you search for IP address “192.1.1.101” and then press CTRL and click the search icon, the application only highlights “192.1.1.
8 SAN view management overview FIGURE 161 Create View dialog box - Fabrics tab 2. Enter a name (128-character maximum) in the Name field and a description (126-character maximum) in the Description field for the view. NOTE You cannot use the name “View” or “View All” in the Name field. NOTE You cannot use an existing name in the Name field. 3. Click the Fabrics tab. 4.
SAN view management overview 8 6. In the Available Hosts table, select the hosts you want to include in the view and click the right arrow button to move your selections to the Selected Fabrics and Hosts table. The Available Hosts table displays the name, IP address, network address of the available hosts and the fabric in which the host is located. If this table is blank, it may be because all hosts have been selected and are displayed in the Selected Fabrics and Hosts table.
8 SAN view management overview FIGURE 164 Edit View dialog box - Hosts tab 5. In the Available Hosts table, select the fabrics you want to include in the view and use the right arrow button to move your selections to the Selected Fabrics and Hosts table. The Available Hosts table displays the name, IP address, network address of the available hosts and the fabric in which the host is located.
SAN view management overview 8 Copying a view To copy a customized view, use the following procedure. 1. Use one of the following methods to open the Copy View dialog box: • Select View > Manage View > Copy View > View_Name. • Select Copy View from the View All list. The View All list does not display until you discover a fabric or host. The Copy View dialog box displays the name of the view you are copying. FIGURE 165 Copy View dialog box 2.
8 SAN topology layout 7. Click OK to save your changes and close the Copy View dialog box. NOTE When you open a new view, the SAN tab displays with a gray screen over the Product List and Topology Map while data is loading. 8. Verify that the copied view displays on the main window of the Management application.
SAN topology layout 8 • Port Display. Select to configure how ports display. - Occupied Product Ports. Select to display the ports of the devices in the fabrics (present in the Connectivity Map) that are connected to other devices. - UnOccupied Product Ports. Select to display the ports of the devices (shown in the Connectivity Map) that are not connected to any other device. - Attached Ports. Select to display the attached ports of the target devices. Switch to Switch Connections.
8 SAN topology layout • Square. Select to display the device icons in a square configuration. Default for Host and Storage groups. • Vertical. Select to display the device icons vertically. • Horizontal. Select to display the device icons horizontally. • Most Connected at Center. Select to display the node that has the most connections at the center of the topology. • Directional. Select to display the internal nodes in a position where they mirror the external groups to which they are connected. 3.
SAN topology layout 8 FIGURE 167 Choose a background color dialog box 3. Select a color from the swatches tab and click OK. • To specify a color based on hue, saturation, and value, click the HSV tab. Specify the hue (0 to 359 degrees), saturation (0 to 100%), value (0 to 100%), and transparency (0 to 100%). • To specify a color based on hue, saturation, and lightness, click the HSL tab. Specify the hue (0 to 360 degrees), saturation (0 to 100%), lightness (0 to 100%), and transparency (0 to 100%).
8 SAN topology layout Changing the product label To change the product label, complete the following steps. 1. Select a product in the Connectivity Map or Product List. 2. Select View > Product Label, and select one of the following options: • • • • • Name (Product). Displays the product name as the product label. WWN. Displays the world wide name as the product label. IP Address. Displays the IP address as the product label. Domain ID. Displays the domain ID as the product label. Zone Alias.
Grouping on the topology 8 2. Repeat step 1 to select more than one port display option. Grouping on the topology To simplify management, devices display in groups. Groups are shown with background shading and are labeled appropriately. You can expand and collapse groups to easily view a large topology. Collapsing groups To collapse a single group on the topology, choose one of the following options: • Click the icon at the top right-hand corner of the group on the topology ( ).
8 Grouping on the topology Configuring custom connections NOTE Active zones must be available on the fabric. To create a display of the connected end devices participating in a single zone or group of zones, complete the following steps. 1. Select a fabric on the topology and select View > Connected End Devices > Custom. The Connected End Devices - Custom display for Fabric dialog box displays with a list of devices participating in a single zone or a group of zones in the Zones in Fabric list. 2.
Chapter 9 Call Home In this chapter • Call Home overview . . . . . . . . . . . . . . . . . . . . . . . . . . . . . . . . . . . . . . . . . . . . • Viewing Call Home configurations . . . . . . . . . . . . . . . . . . . . . . . . . . . . . . . . • Showing a Call Home center. . . . . . . . . . . . . . . . . . . . . . . . . . . . . . . . . . . . . • Hiding a Call Home center . . . . . . . . . . . . . . . . . . . . . . . . . . . . . . . . . . . . . . • Editing a Call Home center . . . . . . . . . . . . . . .
9 Call Home overview Call Home overview NOTE Call Home is supported on Windows systems for all modem and e-mail Call Home centers and is supported on UNIX for the e-mail Call Home centers. Call Home notification allows you to configure the Management application server to automatically send an e-mail alert or dial in to a support center to report system problems on specified devices (Fabric OS switches, routers, and directors).
Viewing Call Home configurations 9 Call Home allows you to perform the following tasks: • • • • • Assign devices to and remove devices from the Call Home centers. Define filters from the list of events generated by Fabric OS devices. Edit and remove filters available in the Call Home Event Filters table. Apply filters to and remove filters from the devices individually or in groups. Edit individual Call Home center parameters to dial a specified phone number or e-mail a specific recipient.
9 Viewing Call Home configurations • Products List — Displays all discovered products. The list allows for multiple selections and manual sorting of columns. This list displays the following information: Product Icon — The status of the products’ manageability. Name — The name of the product. IP Address — The IP address (IPv4 or IPv6 format) of the product. Node WWN — The node world wide name of the product. Fabric Name — The name of the fabric. Vendor — The vendor ID of the product.
Viewing Call Home configurations 9 • Call Home Centers list — The Call Home centers, products assigned to the Call Home centers, and event filters assigned to the Call Home centers and products. This list displays the following information: Centers — A tree with Call Home centers as the parent node, assigned products as subnodes, and event filters as the child node to the assigned products.
9 Showing a Call Home center Showing a Call Home center To show a Call Home center, complete the following steps. 1. Select Monitor > Event Notification > Call Home. The Call Home dialog box displays. 2. Click Show/Hide Centers (beneath the Call Home Centers list). The Centers dialog box displays with a predefined list of Call Home centers (Figure 169). FIGURE 169 Centers dialog box 3. Select the check boxes of the Call Home centers you want to display. Clear the check box to hide the Call Home center.
Editing a Call Home center 9 Editing a Call Home center To edit a Call Home center, select from the following procedures: • Editing the IBM Call Home center . . . . . . . . . . . . . . . . . . . . . . . . . . . . . . . . • Editing an e-mail Call Home center . . . . . . . . . . . . . . . . . . . . . . . . . . . . . . . • Editing the EMC Call Home center . . . . . . . . . . . . . . . . . . . . . . . . . . . . . . . . • Editing the HP LAN Call Home center. . . . . . . . . . . . . . . . . . . . . . . . . . .
9 Editing a Call Home center 8. Enter how often you want to retry the heartbeat interval in the Retry Interval field. The default is 10 seconds. 9. Enter the maximum number of retries in the Maximum Retries field. The default is 3. 10. Enter the primary phone number or extension of the Call Home center in the Call Home Center - Primary Connection field. 11. Enter the backup phone number or extension of the Call Home center in the Call Home Center - Backup Connection field. 12.
Editing a Call Home center 9 FIGURE 171 Configure Call Home Center dialog box (Brocade, IBM, NetApp, or Oracle E-mail option) 4. Make sure the Call Home center type you selected displays in the Call Home Centers list. If the Call Home center type is incorrect, select the correct type from the list. 5. Select the Enable check box to enable this Call Home center. 6. Enter your contact name in the Customer Details - Name field. 7. Enter your company name in the Customer Details - Company field. 8.
9 Editing a Call Home center 16. Enter an e-mail address in the E-mail Notification Settings - Send To Address field. For Brocade E-mail Call Home centers, enter callhomeemail@brocade.com. 17. Click Send Test to test the mail server. The selected Call Home center must be enabled to test the mail server. A faked event is generated and sent to the selected Call Home center. You must contact the Call Home center to verify that the event was received and in the correct format.
Editing a Call Home center - Source — Details about the product. Includes the following data: - Event Time Event Severity Event Reason Code FRU Code/Event Type Event Description Event Data — Information about the triggered event.
9 Editing a Call Home center Editing the EMC Call Home center To edit an EMC Call Home center, complete the following steps. 1. Select Monitor > Event Notification > Call Home. The Call Home dialog box displays. 2. Select the EMC Call Home center you want to edit in the Call Home Centers list. 3. Click Edit Centers (beneath the Call Home Centers list). The Configure Call Home Center dialog box displays (Figure 172). FIGURE 172 Configure Call Home Center dialog box (EMC option) 4.
Editing a Call Home center 9 13. Click OK. The Call Home dialog box displays with the Call Home center you edited highlighted in the Call Home Centers list. 14. Click OK to close the Call Home dialog box. Editing the HP LAN Call Home center To edit an HP LAN Call Home center, complete the following steps. 1. Select Monitor > Event Notification > Call Home. The Call Home dialog box displays. 2. Select the HP LAN Call Home center you want to edit in the Call Home Centers list. 3.
9 Enabling a Call Home center 8. Click Send Test to test the address. The selected Call Home center must be enabled to test the IP address. A faked event is generated and sent to the selected Call Home center. You must contact the Call Home center to verify that the event was received and in the correct format. NOTE The HP LAN Call Home alert displays the directory separation characters with a double backslash (\\) instead of a single backslash (\). 9. Click OK to close the “Test Event Sent” message.
Testing the Call Home center connection 9 Testing the Call Home center connection Once you add and enable a Call Home center, you should verify that Call Home is functional. To verify Call Home center functionality, complete the following steps. 1. Select Monitor > Event Notification > Call Home. 2. Click Edit Centers (beneath the Call Home Centers list). The Configure Call Home Center dialog box displays. 3. Select the Call Home center you want to check in the Call Home Centers list. 4.
9 Viewing Call Home status Viewing Call Home status You can view Call Home status from the main Management application window or from the Call Home Notification dialog box. The Management application enables you to view the Call Home status at a glance by providing a Call Home status icon on the status bar. Table 38 illustrates and describes the icons that indicate the current status of the Call Home function.
Assigning a device to the Call Home center 9 Assigning a device to the Call Home center Discovered devices (switches, routers, and directors) are not assigned to a corresponding Call Home center automatically. You must manually assign each device to a Call Home center before you use Call Home. To assign a device or multiple devices to a Call Home center, complete the following steps. 1. Select Monitor > Event Notification > Call Home. The Call Home dialog box displays. 2.
9 Defining an event filter 3. Click the left arrow button. A confirmation message displays. 4. Click OK. All devices assigned to the selected Call Home center display in the Products List. Any assigned filters are also removed. 5. Click OK to close the Call Home dialog box. Defining an event filter To define an event filter, complete the following steps. 1. Select Monitor > Event Notification > Call Home. The Call Home dialog box displays. 2. Click Add beneath the Call Home Event Filter list.
Assigning an event filter to a Call Home center 9 Assigning an event filter to a Call Home center Event filters allow Call Home center users to log in to a Management server and assign specific event filters to the devices. This limits the number of unnecessary or “acknowledge” events and improves the performance and effectiveness of the Call Home center. You can only select one event filter at a time; however, you can assign the same event filter to multiple devices or Call Home centers.
9 Overwriting an assigned event filter Overwriting an assigned event filter A device can only have one event filter at a time; therefore, when a new filter is applied to a device that already has a filter, you must confirm the new filter assignment. To overwrite an event filter, complete the following steps. 1. Select Monitor > Event Notification > Call Home. The Call Home dialog box displays. 2. Select the event filter you want to apply in the Call Home Event Filters list.
Removing an event filter from a device 9 Removing an event filter from a device To remove an event filter from a device, complete the following steps. 1. Select Monitor > Event Notification > Call Home. The Call Home dialog box displays. 2. Choose one of the following options in the Call Home Centers list: • Right-click a device to which the event filter is assigned and select Remove Filter. • Select an event filter assigned to a device and click the left arrow button.
9 410 Searching for an assigned event filter Brocade Network Advisor SAN User Manual 53-1003154-01
Chapter 10 Third-party tools In this chapter • About third-party tools . . . . . . . . . . . . . . . . . . . . . . . . . . . . . . . . . . . . . . . . . . • Starting third-party tools from the application . . . . . . . . . . . . . . . . . . . . . . • Launching a Telnet session . . . . . . . . . . . . . . . . . . . . . . . . . . . . . . . . . . . . . • Launching an Element Manager . . . . . . . . . . . . . . . . . . . . . . . . . . . . . . . . . • Launching Web Tools. . . . . . . . . . . . . . . . . . . .
10 Starting third-party tools from the application Starting third-party tools from the application You can open third-party tools from the Tools menu or a device’s shortcut menu. Remember that you cannot open a tool that is not installed on your computer. You must install the tool on your computer and add the tool to the Tools menu or the device’s shortcut menu. NOTE Installing tools is only available with the Trial and Licensed version versions. To open an application, complete the following steps. 1.
Launching an Element Manager 10 2. Select Tools > Product Menu > Telnet. The Telnet session window displays. NOTE On Linux systems, you must use CTRL + BACKSPACE to delete text in the Telnet session window. Launching an Element Manager Element Managers are used to manage Fibre Channel switches and directors. You can open a device’s Element Manager directly from the application. To launch a device’s Element Manager, complete the following steps.
10 Launching Web Tools Launching Web Tools Use Web Tools to enable and manage Fabric OS access gateway, switches, and directors. You can open Web Tools directly from the application. For more information about Web Tools, refer to the Web Tools Administrator’s Guide. For more information about Fabric OS access gateway, switches, and directors, refer to the documentation for the specific device. To launch a device’s Element Manager, complete the following steps.
Launching Name Server • • • • 10 Fabric OS 1U, 8 Gbps 40-port FC Switch (with Integrated Routing license) Fabric OS 2U, 8 Gbps 80-port FC Switch (with Integrated Routing license) Fabric OS directors configured with a FC 8 Gbps 16-port Blade (with Integrated Routing license) Fabric OS directors configured with a FC 8 Gbps 32-port Blade (with Integrated Routing license) • Fabric OS directors configured with a FC 8 Gbps 48-port Blade (with Integrated Routing license) Note that on the FC 8 Gbps 48-port Blad
10 Launching HCM Agent 2. Select Configure > Element Manager > Name Server. The Name Server module displays. NOTE When you close the Management application client, any Web Tools instance launched from the clients closes as well. Launching HCM Agent Use Fabric OS HCM Agent to enable and manage Fabric OS HBAs. You can open HCM Agent directly from the application. For more information about HCM Agent, refer to the HCM Agent Administrator’s Guide.
Launching Fabric Watch 10 Launching Fabric Watch Use Fabric Watch as an health monitor that allows you to enable each switch to constantly monitor its SAN fabric for potential faults and automatically alerts you to problems long before they become costly failures.. For more information about Fabric Watch, refer to the Fabric Watch Administrator’s Guide. For more information about Fabro OS access gateway, switches, and directors, refer to the documentation for the specific device.
10 Entering the server IP address of a tool FIGURE 174 Define Tools dialog box 4. Type the tool’s name in the Tool Name field as you want it to appear on the Tools menu. 5. Type or browse to the path of the executable file in the Path field. 6. Type or browse to the path of the folder that you want to set as your working folder in the Working Folder field. 7. Click Add to add the tool. The Setup Tools dialog box displays with the new tool added to the Tools Menu Item table.
Adding an option to the Tools menu 10 5. Click Edit. NOTE You must click Edit before clicking OK; otherwise, your changes will be lost. 6. Click OK to save your work and close the Setup Tools dialog box. Adding an option to the Tools menu You can add third-party tools to the Tools menu which enables you to launch tools directly from the application. To add a option to the tools menu, complete the following steps. 1. Select Tools > Setup. The Setup Tools dialog box displays. 2. Click the Tools Menu tab.
10 Changing an option on the Tools menu 7. Click Add. The new tool displays in the Tool Menu Items table. NOTE You must click Add before clicking OK; otherwise, the new menu option is not created. 8. Click OK to save your work and close the Setup Tools dialog box. The tool you configured now displays on the Tools menu. Changing an option on the Tools menu You can edit parameters for third-party tools that display on the Tools menu. To edit a option to the tools menu, complete the following steps. 1.
Adding an option to a device’s shortcut menu 10 4. Click Remove. If the tool is not being utilized, no confirmation message displays. 5. Click Update to remove the tool. 6. Click OK to save your work and close the Setup Tools dialog box. Adding an option to a device’s shortcut menu You can add an option to a device’s shortcut menu. To add an option to the device’s shortcut menu, complete the following steps. 1. Select Tools > Setup. The Setup Tools dialog box displays. 2. Click the Product Menu tab.
10 Changing an option on a device’s shortcut menu 10. Click Add to add the new menu item. It displays in the Product Popup Menu Items table. NOTE You must click Add before clicking OK; otherwise, your changes will be lost. 11. Click OK to save your work and close the Setup Tools dialog box. Changing an option on a device’s shortcut menu You can change the parameters for a tool that displays on a device’s shortcut menu. To edit an option to the device’s shortcut menu, complete the following steps. 1.
Removing an option from a device’s shortcut menu 10 11. Click Edit. NOTE You must click Edit before clicking OK; otherwise, your changes will be lost. 12. Click OK to save your work and close the Setup Tools dialog box. Removing an option from a device’s shortcut menu You can remove a tool that displays on a device’s shortcut menu. To remove an option to the device’s shortcut menu, complete the following steps. 1. Select Tools > Setup. The Setup Tools dialog box displays. 2. Click the Product Menu tab.
10 Microsoft System Center Operations Manager (SCOM) plug-in The SCOM plug-in is supported on the following configurations: • SCOM 2007 R2 or SCOM 2012 • Professional Plus and Enterprise Trial and Licensed version 11.0.0 and later SCOM plug-in requirements • Make sure you import the Management application management pack (Management_Application_Name.FabricView.xml) to the SCOM Server prior to registering the SCOM Plug-in. The management pack is located in the following directory: Install_Home\scom.
Microsoft System Center Operations Manager (SCOM) plug-in 10 Editing a SCOM server To edit the SCOM server, complete the following steps. 1. Select Tools > Plug-in for SCOM. The Plug-in for SCOM dialog box displays. 2. Select the server you want to edit and click Edit. The Edit SCOM Server dialog box displays. The Host field is not editable in the Edit SCOM Server dialog box. 3. Edit the domain name in the Domain field. 4. Enter your user ID and password. 5. Click OK. 6. Click Close.
10 426 Microsoft System Center Operations Manager (SCOM) plug-in Brocade Network Advisor SAN User Manual 53-1003154-01
Chapter 11 Server Management Console In this chapter • Server Management Console overview . . . . . . . . . . . . . . . . . . . . . . . . . . . . • Services tab . . . . . . . . . . . . . . . . . . . . . . . . . . . . . . . . . . . . . . . . . . . . . . . . . . • Ports tab. . . . . . . . . . . . . . . . . . . . . . . . . . . . . . . . . . . . . . . . . . . . . . . . . . . . . • AAA Settings tab . . . . . . . . . . . . . . . . . . . . . . . . . . . . . . . . . . . . . . . . . . . . . . • Restore tab. . . .
11 Services tab Launching the SMC on Linux NOTE The Server Management Console is a graphical user interface and should be launched from the XConsole on Linux systems. Perform the following steps to launch the Server Management Console on Linux systems. 1. On the Management application server, go to the following directory: Install_Directory/bin 2. Type the following at the command line: .
Services tab 11 3. Review the following information for each available service. • • • • Name — The name of the server; for example, FTP Server or Database Server. Process Name — The name of the process; for example, postgres.exe (Database Server). Status — The status of the service; for example, started or stopped. Start Time — The date and time the service started. The Start Time for Service Location Protocol displays as ‘Not Available’. 4. Click Close to close the Server Management Console.
11 Services tab Starting all services NOTE The Start button restarts running services in addition to starting stopped services which causes client-server disconnect. To start all services, complete the following steps. 1. Launch the Server Management Console. 2. Click the Services tab. 3. Click Start to start all services. NOTE If the server is configured to use an external FTP server, the Server Management Console does not attempt to start the built-in FTP service. 4.
Ports tab 11 6. Select the database user name for which you want to change the password in the User Name field. Options include dcmadmin and dcmuser. Changing the dcmadmin password requires all Management application services, except for the database server, to be stopped and then re-started. Changing the dcmuser password requires all ODBC remote client sessions to be restarted. 7. Enter your current password in the Old Password field. 8.
11 AAA Settings tab AAA Settings tab Authentication enables you to configure an authentication server and establish authentication policies. You can configure the Management application to authenticate users against the local database (Management application server), an external server (RADIUS, LDAP, CAC or TACACS+), or a switch. Authentication is configured to the local database by default.
AAA Settings tab 11 1. Select the AAA Settings tab (Figure 177). FIGURE 177 AAA Settings tab 2. Select Radius Server from the Primary Authentication list. 3. Add or edit a Radius server by referring to “Configuring a Radius server” on page 434. 4. Rearrange the Radius servers in the table by selecting a server and click the Up or Down button to move it. 5. Delete a Radius server by selecting the server and click Delete. 6. Test the established active connection with the Radius server by clicking Test.
11 AAA Settings tab Configuring a Radius server To add or edit a Radius server, complete the following steps. 1. Choose one of the following options from the AAA Settings tab: • Click Add. • Select an existing Radius server and click Edit. The Add or Edit Radius Server dialog box displays (Figure 178). FIGURE 178 Add or Edit Radius Server 2. Enter the radius server’s IP address in the IP Address field. 3. Enter the TCP port, if necessary, used by the Radius server in the TCP Port field. Default is 1812.
AAA Settings tab 11 Configuring LDAP server authentication NOTE You cannot configure multiple Active Directory groups (domains) for the LDAP server. NOTE You cannot enter Domain\User_Name in the Management application dialog box for LDAP server authentication.
11 AAA Settings tab FIGURE 179 AAA Settings tab - LDAP server 3. Add or edit an LDAP server by referring to “Configuring an LDAP server” on page 437. The LDAP Servers and Sequence table displays the following information: • • • • • Network Address — The network address of the LDAP server. Authentication Type — The authentication type (such as CHAP). Security — Whether or not security is enabled. TCP Port — The TCP port number of the LDAP server.
AAA Settings tab 11 • LDAP Servers Not Reachable • LDAP Authentication Failed • User Not Found in LDAP 10. Set the authorization preference by selecting one of the following options from the Authorization Preference list: • Local Database Use the LDAP server for authentication and the Management application local database for authorization. The user name in the local database must match the LDAP user name (password does not need to match) and must have the appropriate roles and AORs.
11 AAA Settings tab FIGURE 180 Add or Edit LDAP server 4. Enter the LDAP server’s hostname in the Network address field. If DNS is not configured in your network, provide an IP address instead of the hostname. 5. Enable security by selecting the Security Enabled check box. When you enable security, the TCP port number automatically changes to port 636 and you must enable certificate services on the LDAP server. 6. Enter the TCP port used by the LDAP server in the TCP Port field.
AAA Settings tab 11 FIGURE 181 AAA Settings tab - TACACS+ server 3. Add or edit a TACACS+ server by referring to “Configuring a TACACS+ server” on page 440. 4. Rearrange the TACACS+ servers in the table by selecting a server and click the Up or Down button to move it. 5. Delete a TACACS+ server by selecting the server and click Delete. 6. Test the established active connection with the TACACS+ server by clicking Test. The Test Authentication dialog box displays. 7.
11 AAA Settings tab Configuring a TACACS+ server To add or edit a TACACS+ server, complete the following steps. 1. Choose one of the following options from the AAA Settings tab: • Click Add. • Select an existing TACACS+ server and click Edit. The Add or Edit TACACS+ Server dialog box displays (Figure 180). FIGURE 182 Add or Edit TACACS+ Server 2. Enter the TACACS+ server’s hostname in the Network Address field. If DNS is not configured in your network, provide an IP address instead of the hostname. 3.
AAA Settings tab 11 Configuring Common Access Card authentication NOTE Common Access Card (CAC) authentication does not support SMI Agent and launch-in-context dialog boxes. NOTE CAC authentication is only supported on Windows systems. Common Access Card (CAC) authentication requires the following preparations: • Make sure to connect the CAC reader to the Management application client workstation. • Make sure to obtain and install the active client library on the client workstation.
11 AAA Settings tab FIGURE 183 AAA Settings tab - CAC server 3. Set the authorization preference by selecting one of the following options from the Authorization Preference list: • Local Database — Uses the AD server for authentication and the Management application local database for authorization. • Primary Authentication Server — Uses the AD server for authentication and authorization.
AAA Settings tab 11 Configuring switch authentication Switch authentication enables you to authenticate a user account against the switch database and the Management application server. You can configure up to three switches and specify the fall back order if one or more of the switches is not available. NOTE Switch authentication is only supported on Fabric OS devices. To configure switch authentication, complete the following steps. 1. Select the AAA Settings tab. 2.
11 AAA Settings tab 1. Select the AAA Settings tab. 2. For Primary Authentication, select Windows Domain. 3. Enter the domain name in the Windows Domain Name field. 4. Set secondary authentication by selecting one of the following options from the Secondary Authentication list: • Local Database • None 5. Click Test. The Test Authentication dialog box displays. 1. In the User ID field, choose one of the following options: • To authenticate a user account against the current domain, enter your user name.
Radius server configuration 11 Displaying the client authentication audit trail All responses to authentication requests coming from clients are logged to an audit trail log file. This file is automatically backed up on the first day of every month. 1. Select the AAA Settings tab. 2. Click Display next to Authentication Audit Trail. The Login dialog box displays. 3. Enter your username and password in the appropriate fields and click OK. The defaults are Administrator and password, respectively.
11 Radius server configuration For example: client 172.26.3.76 { secret = password shortname = GVM1 server } 3. Save and close the file. Configuring user authorization for the Radius server The user configuration file contains the individual user profiles. 1. Open the user configuration file (such as users.conf) a text editor (such as Notepad). 2.
LDAP server configuration 11 2. Change the attribute to use the sequence number 9 as follows. ATTRIBUTE NM-Roles-AORs-List 9 string 3. Save and close the file. 4. Open the Radius server dictionary file in a text editor (such as Notepad). 5. Enter the following to add the Management application dictionary file to the Radius server dictionary file: $INCLUDE dictonary.NM_AAA_dictionary 6. Save and close the file.
11 LDAP server configuration 4. Enter a name in the Full name field 5. Enter a log on name in the User logon name field. 6. Click Next. 7. Select the Password Never Expires option and click Next. 8. Click Finish. The new user displays in the Users pane. 9. Right-click the new user in the Users pane and select Reset Password. 10. Assign a new password with at least one special character and one number and click OK.. 11. Close the Active Directory Users and Computers dialog box.
LDAP server configuration 11 5. Select Active Directory Schema from the Available standalone snap-ins list and click Add. If Active Directory Schema does not display the Available standalone snap-ins list, you must configure it on the LDAP server (refer to “Configuring the Active Directory Schema on the LDAP server” on page 450). 6. Click Close on the Add Standalone Snap-in dialog box. 7. Click OK on the Add/Remove Snap-in dialog box. 8.
11 LDAP server configuration 19. Close the Management console. 20. Restart the AD server. After you restart the AD server, go to “Configuring authorization details on the external LDAP server” on page 450. Configuring the Active Directory Schema on the LDAP server 1. Select Start > Run. 2. Type regsvr32 schmmgmt.dll and press Enter. Make sure that the following message displays: Dll register Server in schmmgmt.dll succeeded. 3. Select Start > Run. 4. Type mmc and press Enter. 5.
LDAP server configuration 11 4. Select NmAors in the Attributes list and click Edit. The String Attribute Editor dialog box displays. 5. Enter the areas of responsibility (such as, All Fabricsand All Hosts) in the Value field and click OK.. 6. Select NmRoles in the Attributes list and click Edit. 7.
11 LDAP server configuration 3. Select the roles and AORs you want to remove in the Active Directory Groups table. Select multiple roles and AORs by holding down the CTRL key and clicking more than one role and AOR. 4. Click the left arrow button. The selected roles and AORs are moved to the Available Roles / AORs table. 5. Click OK to save your work. Loading an AD group To load an AD group, complete the following steps. 1. Select Server > Users. The Users dialog box displays. 2.
TACACS+ server configuration 11 10. (Optional) Enter the group name in the Group Name Filter field. You can specify the group name in the following formats: • User, Domain - Will fetch the group name that contains the user or the operator. • User*, Domain - Will fetch the group name that starts with the user and contains the operator. • User, *Domain - Will fetch the group name that starts with the user and ends with the operator.
11 Restore tab Restore tab The Restore tab enables you to restore the application data files used by the Management application server. Restoring the database To restore application data files, you must know the path to the backup files. This path is configured from the Server > Options dialog box. For more information about backup, refer to “Server Data backup” on page 75. NOTE You cannot restore data from a previous version of the Management application.
Technical Support Information tab 11 5. Click Restore. Upon completion, a message displays the status of the restore operation. Click OK to close the message and the Server Management Console. For the restored data to take effect, re-launch the Configuration Wizard using the instructions in “Launching the Configuration Wizard” on page 6.
11 HCM Upgrade tab 3. Enter the path where you want to save the support data and a name for the support save file in the Output Path field. For example, Full_Path\Support_Save_File_Name.zip. You can also browse to the location you want to save the support data and append the file name to the path when you return to the Technical Support Information tab. If you do not specify an output path, the Management application automatically saves the data to the Install_Home/support directory.
SMI Agent Configuration Tool 11 3. Click Upgrade. 4. Click Close. SMI Agent Configuration Tool The SMIA Configuration Tool enables you to configure SMI (Storage Management Initiative) Agent settings, such as security, CIMOM, and certificate management. This tool is automatically installed with the Management application as part of the Server Management Console.
11 SMI Agent Configuration Tool 3. Enter your username and password in the appropriate fields. The defaults are Administrator and password, respectively. If you migrated from a previous release, your username and password do not change. 4. Select or clear the Save password check box to choose whether you want the application to remember your password the next time you log in. 5. Click Login. The SMIA Configuration Tool dialog box displays.
SMI Agent Configuration Tool 11 4. Enter your username and password in the appropriate fields and click OK. The defaults are Administrator and password, respectively. If you migrated from a previous release, your username and password do not change. The SMIA Configuration Tool dialog box displays. Launching a remote SMIA configuration tool To launch a remote SMIA configuration tool, complete the following steps. 1.
11 SMI Agent Configuration Tool SLP support includes the following components: • slpd script starts the slpd platform • slpd program acts as a Service Agent (SA). A different slpd binary executable file exists for UNIX and Windows systems. • slptool script starts the slptool platform-specific program • slptool program can be used to verify whether SLP is operating properly or not. A different slptool exists for UNIX and Windows.
SMI Agent Configuration Tool 11 • slptool findattrs service:wbem:https://IP_Address:Port NOTE Where IP_Address:Port is the IP address and port number that display when you use the slptool findsrvs service:wbem command. Use this command to verify that Management application SMI Agent SLP service is properly advertising its WBEM SLP template over the HTTP protocol. Example output: Install_Home\cimom\bin>slptool findattrs service:wbem:http://10.24.35.61:5988 (template-type=wbem),(template-version=1.
11 SMI Agent Configuration Tool SLP on UNIX systems This section describes how to verify the SLP daemon on UNIX systems. SLP file locations on UNIX systems • SLP log — Install_Home/cimom /cfg/slp.log • SLP daemon — Install_Home/cimom /cfg/slp.conf You can reconfigure the SLP daemon by modifying this file. • SLP register — Install_Home/cimom /cfg/slp.reg You can statically register an application that does not dynamically register with SLP using SLPAPIs by modifying this file.
SMI Agent Configuration Tool 11 Verifying SLP service installation and operation on Windows systems 1. Launch the Server Management Console from the Start menu. 2. Click Start to start the SLP service. 3. Open a command window. 4. Type cd c:\Install_Home\cimom \bin and press Enter to change to the directory where slpd.bat is located. 5. Type > slptool findsrvs service:service-agent and press Enter to verify the SLP service is running as a Service Agent. 6.
11 SMI Agent Configuration Tool Accessing Management application features To access Management application features such as, fabric and host discovery, role-based access control, application configuration and display options, server properties, as well as the application name, build, and copyright, complete the following steps. 1. Click the Home tab, if necessary. 2. Select from the following to access the feature or dialog box.
SMI Agent Configuration Tool 11 1. Click the Authentication tab. FIGURE 190 Authentication tab 2. Select the Enable Client Mutual Authentication check box, as needed. If the check box is checked, CIM client mutual authentication is enabled. If the check box is clear (default), client mutual authentication is disabled. 3. Select the Enable Indication Mutual Authentication check box, as needed. If the check box is checked, indication mutual authentication is enabled.
11 SMI Agent Configuration Tool Configuring CIMOM server authentication CIMOM server authentication is the authentication mechanism between the CIM client and the CIMOM Server. You can configure the CIMOM server to allow the CIM client to query the CIMOM server without providing credentials; however, the CIMOM server requires the Management application credentials to connect to the Management application server to retrieve the required data.
SMI Agent Configuration Tool 11 CIMOM tab NOTE You must have SAN - SMI Operation Read and Write privileges to view or make changes on the CIMOM tab. For more information about privileges, refer to “User Privileges” on page 1451. The CIMOM tab enables you to configure the CIMOM server port, the CIMOM Bind Network Address, and the CIMOM log. Configuring the SMI Agent port number To configure the SMI Agent port number, complete the following steps. 1. Click the CIMOM tab. FIGURE 191 CIMOM tab 2.
11 SMI Agent Configuration Tool 4. Click Apply. NOTE Changes on this tab take effect after the next CIMOM server restart. NOTE You can only restart the server using the Server Management Console (Start > Programs > Management_Application_Name 12.X.X > Server Management Console). If you disabled SSL, a confirmation message displays. Click Yes to continue. 5. Click Close to close the SMIA Configuration Tool dialog box.
SMI Agent Configuration Tool 11 Configuring the CIMOM log NOTE You must have SAN - SMI Operation Read and Write privileges to view or make changes on the CIMOM tab. For more information about privileges, refer to “User Privileges” on page 1451. To configure the CIMOM log, complete the following steps. 1. Click the CIMOM tab. 2. Select a log category from the Log Level list to start logging support data for the server. Options include the following: • Off — select to turn off logging support data.
11 SMI Agent Configuration Tool Certificate Management tab NOTE You must have SMI Operation Read and Write privileges to view or make changes on the Certificate Management tab. For more information about privileges, refer to “User Privileges” on page 1451. The Certificate Management tab enables you to manage your CIM client and Indication authentication certificates.
SMI Agent Configuration Tool 11 5. Click Import. The new certificate displays in the Certificates list and text box. If the certificate location is not valid, an error message displays. Click OK to close the message and reenter the full path to the certificate location. If you did not enter a certificate name, an error message displays. Click OK to close the message and enter a name for the certificate. If the certificate file is empty or corrupted, an error message displays.
11 SMI Agent Configuration Tool Deleting a certificate NOTE You must have SMI Operation Read and Write privileges to view or make changes to the Certificate Management tab. For more information about privileges, refer to “User Privileges” on page 1451. To delete a certificate, complete the following steps. 1. Click the Certificate Management tab. 2. Select Client or Indication from the Authentication list. The appropriate certificates display in the Certificates list. 3.
SMI Agent Configuration Tool 11 1. Click the Summary tab. FIGURE 193 Summary tab 2. Review the summary. NOTE When the CIMOM server is stopped, the server configuration information does not display on the Summary tab. The following information is included in the summary. TABLE 39 Field/Component Description Client Mutual Authentication Displays whether or not the client mutual authentication is enabled or disabled for the Server Configuration and the Current Configuration.
11 SMI Agent Configuration Tool TABLE 39 Field/Component Description Log Level Displays the log level for the Server Configuration and the Current Configuration. Options include the following: • 10000 — Off • 1000 — Severe • 900 — Warning • 800 — Info (default) • 700 — Config • 500 — Fine • 400 — Finer • 300 — Finest • 0 — All Managed Ports Displays the number of managed ports. For more information about managed port count rules, refer to “Managed count” on page 35.
Chapter 12 SAN Device Configuration In this chapter • Configuration file management . . . . . . . . . . . . . . . . . . . . . . . . . . . . . . . . . . • Enhanced group management . . . . . . . . . . . . . . . . . . . . . . . . . . . . . . . . . . . • Firmware management . . . . . . . . . . . . . . . . . . . . . . . . . . . . . . . . . . . . . . . . . • Frame viewer . . . . . . . . . . . . . . . . . . . . . . . . . . . . . . . . . . . . . . . . . . . . . . . . . • Ports . . . . . . . . . . . . . . . . .
12 Configuration file management • Defining a schedule (Configuration File > Schedule Backup) (refer to “Scheduling switch configuration backup” on page 479) • Defining adaptive backup (Discovery or Event-triggered) (refer to “Adaptive backup” on page 477) Saving switch configurations on demand or manually Configuration files are uploaded from the selected switches and stored in individual files only for the Professional edition. Files are named with the convention cfg_switch_name_Date_Time.
Configuration file management 12 Adaptive backup Adaptive backup is triggered based on fabric discovery and when configuration change events is received from a switch. Discovery backup Switch or fabric discovery automatically triggers discovery backup for all switches in the fabric which have the correct user credentials. To discover a switch, refer to “Discovering fabrics” on page 37. Discovery configuration files display in the Configuration File Manager dialog box with the Backup Type as Discovery.
12 Configuration file management To restore a switch configuration, complete the following steps. 1. Right-click a device in the Product List or the Connectivity Map, and select Configuration File > Restore. The Restore Switch Configuration dialog box displays. FIGURE 195 Restore Switch Configuration dialog box 2. Select the switch configuration you want to download from the Saved Switch Configurations table. 3. Click OK. The configuration is downloaded to the device.
Configuration file management 12 Scheduling switch configuration backup NOTE The Enhanced Group Management (EGM) license must be activated on a switch to perform this procedure and to use the supportSave module. You can schedule a backup of one or more switch configurations. If a periodic backup is scheduled at the SAN level, that backup will apply to all switches from all fabrics discovered. Any new fabrics being discovered are automatically added to the list of fabrics to be backed up.
12 Configuration file management 3. Set the Schedule parameters. These include the following: - The desired Frequency for backup operations (daily, weekly, monthly). The Day you want backup to run. If Frequency is Daily, the Day list is unavailable. If Frequency is Weekly, choices are days of the week (Sunday through Saturday). If Frequency is Monthly, choices are days of the month (1 through 31). - The Time (hour, minute) you want backup to run. The maximum age allowed before you Purge Backups.
Configuration file management 12 FIGURE 197 Switch Configurations tab The Switch Configurations tab contains the following fields and components: • Trigger Backup on Events check box — Select to collect backup configurations triggered by events (refer to “Event -triggered backup”). Clear the check box to not collect backup configurations triggered by events. Trigger Backup on Events is only supported on Fabric OS devices running 7.2.1 or later.
12 Configuration file management • Backup Date/Time — The date and time the last backup occurred. This is the backup that will be restored. • Name — The name of the switch that will be restored. • Configuration Type — The type of configuration for the switch (FC, DCB-running, or DCB-startup). • Backup Type — The type of backup used to obtain the configuration files from the device.
Configuration file management 12 Restoring a configuration from the repository If you delete a fabric or switch from discovery, the configuration remains in the repository until you delete it manually. Stored configurations are linked to the switch WWN; therefore, if the IP address or switch name is changed and then rediscovered, the Configuration File Manager dialog box displays the new switch name and IP address for the old configuration. NOTE This feature requires a Trial or Licensed version. 1.
12 Configuration file management • Backup Type — The type of backup used to obtain the configuration files from the device. Backup options include the following types: - Discovery — The discovery backup is obtained after the discovery process. - Manual — Occurs when you launch the Save Switch Configuration dialog box and save the switch configuration manually. - Scheduled — Occurs when backup is obtained at the scheduled time.
Configuration file management 12 FIGURE 199 Configuration file content 5. Click Close to close the dialog box. Searching the configuration file content NOTE This feature requires a Trial or Licensed version. To search the configuration file content, complete the following steps. 1. Right-click a device in the Product List or the Connectivity Map, and select Configuration File > Configuration File Manager. The Configuration File Manager dialog box displays. 2. Click the Switch Configuration tab.
12 Configuration file management FIGURE 200 Searching Configuration file content 6. Click Close to close the dialog box. Deleting a configuration NOTE This feature requires a Trial or Licensed version. NOTE Baseline configurations and the latest configurations will not be deleted. 1. Right-click a device in the Product List or the Connectivity Map, and select Configuration File > Configuration File Manager. The Configuration File Manager dialog box displays. 2. Click the Switch Configurations tab.
Configuration file management 12 Exporting a configuration NOTE This feature requires a Trial or Licensed version. 1. Right-click a device in the Product List or the Connectivity Map, and select Configuration File > Configuration File Manager. The Configuration File Manager dialog box displays. 2. Select the configuration you want to export, and click Export. The file appropriate to your operating system displays. 3. Click the file to select the location into which you want to export the configuration. 4.
12 Configuration file management Comparing switch configurations The Compare dialog box allows you to display the contents of two configurations side-by-side. To compare two configurations, perform the following steps. 1. Click the SAN tab. 2. Select Configure > Configuration > Configuration File Manager. The Configuration File Manager dialog box displays. 3. Click the Switch Configurations tab. 4. Select a switch to view the configurations. 5. Select two configurations and click Compare.
Configuration file management 12 • Change Navigator buttons/legend — The Change Navigator buttons and legends are enabled when there is at least one change between two compared files. - Go to first change button ( - Differences legend — Displays the color legend for differences: ) — Click to move to the first change. Go to previous change button ( ) — Click to move to the previous change. Go to next change button ( ) — Click to move to the next change.
12 Configuration file management Keeping a copy past the defined age limit NOTE This feature requires a Trial or Licensed version. 1. Select Configure > Configuration File > Configuration File Manager. The Configuration File Manager dialog box displays. 2. Select the check box under Keep for the configuration you want to preserve. The configuration will be kept until it is manually deleted, or until the Keep check box is cleared to enable the age limit again.
Configuration file management 12 FIGURE 202 Change Tracking tab The Change Tracking tab displays the following information: • • • • Name — The switch name. Fabric Name — The name of the fabric. WWN — The world wide name of the switch selected to be the destination switch. Baseline Backup Time — The date and time when the baseline configuration for the device was copied into the repository of the management server. • Backup Time — The time when the last backup attempt occurred for the selected device.
12 Configuration file management Replicating configurations NOTE This feature requires a Trial or Licensed version. You can replicate a switch SNMP configuration, the Fabric Watch configuration, Trace Destination configuration, or the entire configuration. 1. Select Configure > Configuration File > Replicate > Configuration. A wizard is launched to guide you through the process. The first step of the wizard, Overview, displays.
Configuration file management TABLE 41 12 Step 3. Source Location Field/Component Description Configuration File Manager option Select to replicate the entire Configuration File Manager to the destination switches. Configuration from the switch option Select to assign a designated switch to the destination switch.
12 Configuration file management TABLE 42 Step 4. Source Configuration (Continued) Field/Component Port Type The type of port (for example, expansion port, node port, or NL_port). Product Type The type of product. Protocol The protocol for the port. Serial # The serial number of the switch. Speed Configured (Gbps) The actual speed of the port in Gigabits per second. State The port state, for example, online or offline. Status The operational status of the port.
Configuration file management TABLE 43 12 Step 5. Destination Switches (Continued) Field/Component Description Product Type The type of product. Protocol The protocol for the port. Serial # The serial number of the switch. Speed Configured (Gbps) The actual speed of the port in Gigabits per second. State The port state, for example, online or offline. Status The operational status of the port.; for example, unknown or marginal. Symbolic Name The symbolic name for the port.
12 Configuration file management Replicating security configurations NOTE This feature requires a Trial or Licensed version. You can replicate an AD/LDAP Server, DCC, IP, RADIUS Server, or SCC security policy. 1. Select Configure > Configuration File > Replicate > Security. A wizard is launched to guide you through the process. The first step of the wizard, Overview, displays. There are seven steps in the Replicate Switch Security Policy Configuration wizard: - Overview, which describes the wizard.
Configuration file management TABLE 47 12 Step 3. Select Source Switch (Continued) Field/Component Description Switch Name The name of the source switch to be replicated. Switch IP Address The IP address of the source switch to be replicated. Switch WWN The world wide name of the source switch to be replicated. Name The name of the selected switch. Device Type The type of device port. Tag The tag number of the port Serial # The serial number of the switch.
12 Enhanced group management TABLE 48 Step 4. Select Destination Switches (Continued) Field/Component Description Contact The primary contact at the customer site. Description A description of the customer site. State The port state, for example, online or offline. Status The operational status of the port; for example, unknown or marginal. Right and left arrow buttons Click to move the switches back and forth between the Available Switches table and the Selected Switches table.
Firmware management 12 Firmware management A firmware file repository (Windows systems only) is maintained on the server in the following location: C:\Program Files\Install_Directory\data\ftproot\Firmware\Switches\7.0\n.n.n\n.n.n The firmware repository is used by the internal FTP, SCP, or SFTP server that is delivered with the Management application software, and may be used by an external FTP server if it is installed on the same platform as the Management application software.
12 Firmware management FIGURE 203 Download tab 3. Select one or more switches from the Available Switches table. The Available Switches table lists the switches that are available for firmware download. 4. Click the right arrow to move the switches to the Selected Switches table. If you select any switches that do not support firmware download, a message displays. Click OK on the message. The switches that support firmware download display in the Selected Switches table.
Firmware management 12 • Select the SCP Server option to download from the external SCP server. Continue with step 7. NOTE The Management application only supports WinSSHD as the third-party Windows external SCP server. Firmware upgrade and downgrade through WinSSHD is only supported on devices running Fabric OS 6.0 or later. • Select the SFTP Server option to download from the external SFTP server. Continue with step 7.
12 Firmware management Displaying the firmware repository The firmware repository is available on the Firmware Management dialog box. The Management application supports .zip and .gz compression file types for firmware files. Initially, the firmware repository is configured to use the built-in FTP, SCP, or SFTP server. To use an external FTP server, refer to “Configuring an external FTP, SCP, or SFTP server” on page 128.
Firmware management 12 • Release Notes View button — Click to view the release notes, if imported, which contain information about downloading firmware. For internal built-in FTP, SCP, or SFTP servers or external SCP or SFTP servers running on the same system as the Management application, if there is a space in the release note file name, you will not be able to view the release notes.
12 Firmware management 6. Enter or browse to the location of the MD5 file (.md5 file type). If the MD5 checksum file is located in the same directory as the firmware file and has the same file name (with the md5 extension), this field is auto-populated. The MD5 checksum file can be obtained from the Fabric OS product download site in the same location as the firmware file.
Switch password management 12 Switch password management Switch password management enables you to change or reset the switch password for one or more users across multiple switches. NOTE You can change the switch password for root and factory users only by using the Change Password button because the current password is mandatory. NOTE If you change the switch password for one Fabric ID (FID) user name, the switch password changes for all FIDs that have the same user name.
12 Switch password management The Manage Switch Password dialog box includes the following components: • Available Switches table — Displays the switches available in the current view of the application. • Selected Switches table — Displays the selected switches. • Results table — Displays the users associated with the selected switches. 2. Select the switches for which you want to change the switch password from the Available Switches table.
Switch password management 12 FIGURE 208 Change Password dialog box 6. Enter the current password in the Current Password field. 7. Enter the new password in the New Password and Confirm Password fields. NOTE Passwords must be from 8 through 40 characters long and cannot contain a colon (:). 8. Click OK. The Change Password Summary dialog box displays. NOTE If the password change is sucessful for the “admin” (account used for discovery), the password is updated in the database.
12 Frame viewer 5. Select one or more users for whom you want to reset the switch password from the Results table and click Reset Password. The Reset Password dialog box displays (as shown in Figure 209). FIGURE 209 Reset Password dialog box 6. Enter the new password in the New Password and Confirm Password fields. 7. Click OK. The Reset Password Summary dialog box displays. Frame viewer NOTE Frame viewer is only supported on devices running Fabric OS 7.1.0 or later.
Frame viewer 12 2. Select one of the following options from the Show list: • Select Only Supported Products with Dropped Frames in the Log. The top table displays Fabric OS devices running 7.1.0 or later that support frame viewer and have dropped frames. • Select All Supported Products to view all devices. The top table displays all Fabric OS devices running 7.1.0 or later that support frame viewer.
12 Frame viewer • Clear button — Select a device in the upper table and click to clear the discarded frames from the frame log (refer to “Clearing the discarded frame log” on page 511). All discarded frame records from the frame log on the switch are cleared. The Discarded Frames column value in the upper table updates “No”. • Refresh button — Click to fetch new data from the frame log on the switch (refer to “Refreshing the discarded frame log” on page 511).
Frame viewer 12 Destination – Destination name. If the device port is an HBA managed by the Management application, the host name displays. Destination Port – Destination port name. Destination Switch-Port – Destination Switch_Name – Port_Name. Destination FID – Destination fabric ID. Destination Fabric – Destination fabric name.
12 Ports Ports You can enable and disable ports, as well as view port details, properties, type, status, and connectivity. Viewing port connectivity The connected switch and switch port information displays for all ports. To view port connectivity, choose one of the following steps: • Right-click a Fabric and select Port Connectivity. • Right-click a product icon and select Port Connectivity. • Select a product icon and select Monitor > Port Connectivity.
Ports 12 • Add Flow button — Select a port and click to add a flow definition (refer to “Provisioning flows” on page 1816). NOTE Flow Vision is supported on platforms running Fabric OS 7.2 and later. • Port connectivity table — Displays the ports connected to the selected fabric or device. Loop devices are displayed in multiple rows, one row for each related device port. If no switch or device is connected to the port, then the related fields are empty. - Port Number — The port’s number.
12 Ports - Device Port Type— The device port type; for example, U_Port (universal port), FL_Port (Fabric loop port), and so on. - Device Node WWN — The world wide name of the device node. - Port IP Address — The port’s IP address. - Vendor — The hardware vendor’s name. - Switch Status — The operational status. There are four possible operation status values: Device Symbolic Name — The symbolic name of the device node.
Ports - 12 Connected Port Name — The name of the connected port. Connected User Port Number — The port number of the connected user port. Connected Port Area ID Port Index — The area ID and the port index of the connected port. Connected Port Speed — The speed of the connected port. Connected Blade Number — The number of the connected blade. Connected Port Number — The number of the connected port. Connected Port Status — The connection status ; for example, online or offline.
12 Ports • • • • • • • • == != < > <= >= contains matches 4. Define a filter by entering a value that corresponds to the selected property in the Value column. 5. Repeat steps 2 through 4 as needed to define more filters. 6. Click OK. The Port Connectivity View dialog box displays. If filtering is already enabled, only those ports that meet the filter requirements display. To enable the filter, select the Filter check box. Resetting the filter Reset immediately clears all existing definitions.
Ports 12 Viewing port details To view port details, complete the following steps. 1. Right-click the port for which you want to view more detailed information on the Port Connectivity View dialog box and select Show Details. The Port Details dialog box displays(Figure 211). FIGURE 213 Port Details dialog box 2. Review the port information. For the list of fields on the Port Details dialog box, refer to “Viewing port properties” on page 1482. 3. Sort the results by clicking on the column header. 4.
12 Ports Port types On the Connectivity Map, right-click a switch icon and select Show Ports. The port types display showing which ports are connected to which products. NOTE Show Ports is not applicable when the map display layout is set to Free Form (default). NOTE This feature is only available for connected products. On bridges and CNT products, only utilized Fibre Channel ports display. IP ports do not display. TABLE 51 Port types Port Type Description D A port in diagnostic mode.
Ports 12 2. Review the following information: • Product properties for both devices. • Connection properties. • Selected connection port properties. Depending on the device type at either end of the connection, some of the following fields (Table 52) may not be available for all products. TABLE 52 Port connection properties Field Description Product Properties table The product information for the two connected switches.
12 Ports TABLE 52 Port connection properties (Continued) Field Description dB Loss (dB) Selected Connection Properties table 520 The power loss (dB) value between the source and destination ports. Only available when historical performance data collection is enabled. For Fabric OS devices, this field requires firmware version 6.2.2d, 6.3.2c, 6.4.1a, or 6.4.2 or later.
Ports TABLE 52 12 Port connection properties (Continued) Field Description Manufacturer Plant The name of the manufacturing plant. Name The name of the switch. NPIV Enabled Whether the NPIV port is enabled. Parameter The parameter of the switch. Physical/Logical Whether the port is a physical port or a logical port. PID Format The port ID format of the switch. Port # The port number. Port Address The address of the port. Port Module The port’s module.
12 Ports Determining inactive iSCSI devices For router-discovered iSCSI devices, you can view all of the inactive iSCSI devices in one list. To do this, use the Ports Only view and then sort the devices by FC Address. The devices that have an FC address of all zeros are inactive. 1. Select View All, Levels, and then Ports Only from the main window. 2. Use the scroll bar to view the columns to the right and locate the FC Address column in the Ports Only list. 3.
Ports 12 • Combined Status — Displays the current status of the port. NOTE Requires a 16 Gbps capable port running Fabric OS 7.0 or later. NOTE For devices running Fabric OS 7.1 or earlier, the device must have a Fabric Watch license and threshold monitoring configured for the port. For more information, refer to the Fabric Watch Administrator’s Guide. NOTE For devices running Fabric OS 7.
12 Port commissioning • Powered on Years (Hours) — The powered on time in years and hours for 16 Gbps capable ports. Empty for unsupported ports. NOTE Requires a 16 Gbps capable port running Fabric OS 7.0 or later. • • • • • • • • • • • • • FC Speed (GB/s) (Fabric OS 7.0 or later) — The FC port speed; for example, 4 Gbps. FC Speed (MB/s) (Fabric OS 6.4 or earlier) — The FC port speed; for example, 400 Mbps. Distance — The length of the fiber optic cable. Vendor — The vendor of the SFP.
Port commissioning 12 • Port commissioning is not supported on ports with Dense Wave Division Multiplexing (DWDM), Course Wave Division Multiplexing, or Time Division Multiplexing (TDM). • E_Port commissioning requires that the lossless feature is enabled on both the local switch and the remote switch. • Fabric tracking must be enabled (refer to“Enabling fabric tracking” on page 289) to maintain the decommissioned port details (such as port type, device port WWN, and so on).
12 Port commissioning Configuring port commissioning The following procedure provides an overview of the steps you must complete to configure port commissioning. 1. Make sure you meet the z/OS (mainframe operating system) requirements. For more information, refer to “z/OS requirements” on page 525. 2. Register each CIMOM server within the fabric affected by the action. For step-by-step instructions, refer to “Registering a CIMOM server” on page 526. 3. Decommission an F_Port.
Port commissioning 12 FIGURE 215 Port Commissioning Setup dialog box 2. Enter the IP address (IPv4 or IPv6 format) or host name of the CIMOM server in the Network Address field. 3. (Optional) Enter a description of the CIMOM server in the Description field. The description cannot be over 1024 characters. 4. Enter the CIMOM port number for the CIMOM server in the CIMOM Port field. The default port number is 5989. 5. Enter the namespace of the CIM_FCPort in the Namespace field.
12 Port commissioning Viewing existing CIMOM servers NOTE Port commissioning is only supported on FICON devices running Fabric OS 7.1 or later. Before you can decommission or recommission an F_Port, you must register the CIMOM servers within the fabric affected by the action. For more information, refer to “Registering a CIMOM server” on page 526. 1. Select Configure > Port Commissioning > Setup. The Port Commissioning Setup dialog box displays (Figure 215).
Port commissioning 12 Not Reachable — CIMOM server not reachable. Wrong Namespace — CIMOM server namespace is incorrect. Last Contacted — The last time you contacted the system. Updates when you test the reachability of the CIMOM server and when you contact the CIMOM server to respond to the F_Port decommission or recommission request. • 2. To register a CIMOM server, refer to “Registering a CIMOM server” on page 526. 3.
12 Port commissioning Importing CIMOM servers and credentials You can import one or more CIMOM servers (system and credentials) using a CSV-formatted file. You can import a maximum of 2,000 CIMOM servers. 1. Select Configure > Port Commissioning > Setup. The Port Commissioning Setup dialog box displays (Figure 215). 2. Click Import to import CIMOM server information from a file. The CSV file must use the following format: Network Address, User ID, CIMOM Port, Namespace, Description, Password Example 10.
Port commissioning 12 Changing CIMOM server credentials You can edit the CIMOM server credentials for one or more CIMOM servers at the same time. 1. Select Configure > Port Commissioning > Setup. The Port Commissioning Setup dialog box displays (Figure 215). 2. Select one or more CIMOM servers from the Systems List and click Change Credentials. The Edit Credentials dialog box displays. If you selected one CIMOM server, the credentials for the selected server display in the dialog box.
12 Port commissioning Deleting CIMOM server credentials 1. Select Configure > Port Commissioning > Setup. The Port Commissioning Setup dialog box displays (Figure 215). 2. Select one or more CIMOM servers from the Systems List and click the left arrow button. The details for the last selected CIMOM server row displays in the Add/Edit System and Credentials area. 3. Confirm that this is the CIMOM server you want to delete and click OK to delete the CIMOM server from the Port Commissioning Setup dialog box.
Port commissioning 12 • Force — Select to force the port decommission. The Management application still contacts all registered CIMOM servers within the fabric affected by the action, but forces the port decommission regardless of the CIMOM server response. NOTE If the CIMOM server is not reachable or the credentials fail, F_Port decommissioning do not occur. If all CIMOM servers are reachable, the Management application sends a CAL request to decommission the port.
12 Port commissioning E_Port commissioning Although you can use any of the following methods to access the E_Port commissioning commands, individual procedures only include one method. • From the main menu, select the E_Port in the Product List, and then select Configure > Port Commissioning > Decommission/Recommission > Port. • From the Product List, right-click the E_Port and select Decommission/Recommission > Port.
Port commissioning 12 Decommissioning an E_Port trunk Select the E_Port trunk in the Product List, and then select Configure > Port Commissioning > Decommission > Port or right-click E_Port trunk and select Decommission. The decommission request is sent to all the trunk members including the master, If a decommissioning request is triggered on a trunk level. An error message displays, if the trunk group is the only connection between the switches.
12 Port commissioning NOTE If the CIMOM server is not reachable or the credentials fail, port decommission does not occur. If all CIMOM servers are reachable, the Management application sends a CAL Request to decommission the port. If all the CIMOM servers are not reachable, decommissioning fails. If some CIMOM servers are reachable and some CIM servers are not reachable, decommissioning fails and the Management application recommissions the decommissioned CIM instances.
Port commissioning 12 Decommissioning all ports on a blade NOTE (Virtual Fabrics only) All ports on the blade must be managed by the Management application. NOTE Fabric tracking must be enabled (refer to “Enabling fabric tracking” on page 133) to maintain the decommissioned port details (such as port type, device port WWN, and so on). Do not accept changes in the Management application client. 1.
12 Port commissioning Recommissioning all ports on a blade NOTE All ports on the blade must be managed by the Management application. Select a port on the blade for which you want to recommission all ports, and then select Configure > Port Commissioning > Recommission > All Ports on the Blade. NOTE You can only recommission ports from the logical switch, not the physical chassis. While recommissioning is in progress, an up arrow icon displays next to the port icon in the Product List.
Port commissioning 12 • Configuration Name — Name of the deployment. For example, Decommission/Recommission - switch_name, Decommission/Recommission switch_name - blade, or Decommission/Recommission - switch_name - Ports. • Product — The product name. • Status — The status of the deployment. For example, Success or Failed. • Reason — The port level status of the decommission or recommission.
12 Port commissioning • Configuration Name — Name of the deployment. For example, Decommission/Recommission - switch_name, Decommission/Recommission - switch_name - blade, or Decommission/Recommission switch_name - Ports. • Product — The product name. • Status — The status of the deployment. For example, Allowed or Failed. • Reason — The port level status of the decommission or recommission. 5. Click the close button (X) to close the deployment report.
Port commissioning 12 CIMCLI trouble shooting Use the following sections to obtain data to support trouble shooting. Obtaining FCPort and PCCUPort data To obtain CIMOM supporting documentation for troubles hooting, complete the following steps. 1. Log onto the TSO. NOTE You need a very large TSO user region size for the cimcli command. 2. From the ISPF Primary Option Menu, select option 6. 3. Enter the TSO OMVS to open the z/OS USS shell. 4.
12 Port commissioning 3. Enter a file name for the server support save file in the File Name field. The default file name is DCM-SS-Time_Stamp. 4. Select the Include Database check box to include the database in the support save and choose one of the following options. • Select the Partial (Excludes historical performance data and events) option to exclude historical performance data and events from the database capture. • Select the Full option to capture the entire database.
Administrative Domain-enabled fabric support 12 Administrative Domain-enabled fabric support The Management application provides limited support for AD-enabled fabrics. An Administrative Domain (Admin Domain or AD) is a logical grouping of fabric elements that defines which switches, ports, and devices you can view and modify. An Admin Domain is a filtered administrative view of the fabric. NOTE If you do not implement Admin Domains, the feature has no impact on users and you can ignore this section.
12 Administrative Domain-enabled fabric support • If you try to enable Virtual Fabrics on an AD-enabled switch, that operation fails with the following message: “Failed to enable Virtual Fabric feature for Chassis (Remove All ADs before attempting to enable VF).” • Performs performance management (including Advance Performance Monitoring and Top Talkers) data collection and reports in a physical fabric context.
Administrative Domain-enabled fabric support TABLE 53 12 Feature support for AD-enabled fabrics (Continued) Feature AD context ADO AD255 Not supported All AD User interface impact Performance Management > Configure Thresholds End-to-End Monitors Clear Counters X Filters AD-enabled fabric from the Fabrics list. Port Auto Disable X Filters AD-enabled fabric from the dialog box. Port Connectivity X Disables menu for a switch in an AD-enabled fabric.
12 Port Auto Disable Port Auto Disable NOTE Port Auto Disable requires devices running Fabric OS 6.3 or later. Port Auto Disable (PAD) allows you to enable and disable Port Auto Disable on individual FC_ports or on all ports on a selected device, as well as unblock currently blocked ports.
Port Auto Disable 12 FIGURE 217 Port Auto Disable dialog box 2. Select a fabric from the Fabric list. An information message displays the number of block ports for the fabric, if any. 3. Select one of the following from the Show list to determine what ports to display: • • • • All Ports (default) Disabled PAD Ports Enabled PAD Ports Blocked Ports 4. Review the port information: • Products/Ports tree — Displays devices and associated ports.
12 Port Auto Disable • • • • • • • • Port # — Displays the port number. Port WWN — Displays the port world wide name. Port Name — Displays the port name. User Port # — Displays the user port number. PID — Displays the port identifier. Connected Port # — Displays the connected port number. Connected Port WWN — Displays the connected port world wide name. Connected Port Name — Displays the connected port name. 5. Click OK on the Port Auto Disable dialog box.
Port Auto Disable 12 Enabling Port Auto Disable on individual ports NOTE Port Auto Disable requires devices running Fabric OS 6.3 or later. To enable PAD on individual ports, complete the following steps. 1. Select Monitor > Port Auto Disable. The Port Auto Disable dialog box displays. 2. Select the fabric on which you want to configure PAD from the Fabric list. 3. Choose one of the following options from the Show list to filter the port list: • All Ports (default) — Displays all ports in the fabric.
12 Port Auto Disable Disabling Port Auto Disable on individual ports NOTE Port Auto Disable requires devices running Fabric OS 6.3 or later. To disable port auto disable on individual ports, complete the following steps. 1. Select Monitor > Port Auto Disable. The Port Auto Disable dialog box displays. 2. Select the fabric on which you want to configure PAD from the Fabric list. 3.
Port Auto Disable 12 Stopping Port Auto Disable on a device NOTE Port Auto Disable requires devices running Fabric OS 7.2 or later. You can disable PAD at the device level. This allows you stop PAD for the device regardless of the individual port setting. To stop PAD on a device, complete the following steps. 1. Select Monitor > Port Auto Disable. The Port Auto Disable dialog box displays. 2. Select the fabric on which you want to configure PAD from the Fabric list. 3.
12 Port Auto Disable Unblocking ports NOTE Port Auto Disable requires devices running Fabric OS 6.3 or later. To unblock ports, complete the following steps. 1. Select Monitor > Port Auto Disable. The Port Auto Disable dialog box displays. 2. Select the fabric on which you want to unblock ports from the Fabric list. 3. Select Blocked Ports from the Show list. 4. Select the device on which you want to unblock ports. 5. Click Unblock (under Port). 6. Click OK on the Port Auto Disable dialog box.
Chapter 13 Host Port Mapping In this chapter • Host port mapping overview . . . . . . . . . . . . . . . . . . . . . . . . . . . . . . . . . . . . . • Creating a new Host . . . . . . . . . . . . . . . . . . . . . . . . . . . . . . . . . . . . . . . . . . . • Renaming an HBA Host. . . . . . . . . . . . . . . . . . . . . . . . . . . . . . . . . . . . . . . . . • Deleting an HBA Host . . . . . . . . . . . . . . . . . . . . . . . . . . . . . . . . . . . . . . . . . . • Viewing Host properties . . . . . . . .
13 Creating a new Host Creating a new Host To create a new Host, complete the following steps. 1. Right-click an HBA icon in the Fabric topology and select Host Port Mapping. The Host Port Mapping dialog box displays. FIGURE 218 Host Port Mapping dialog box The Host Port Mapping dialog box includes the following details: • HBAs table — All unassigned HBAs. Lists the following information for all available HBAs. You can sort the table by clicking once on any of the column titles.
Renaming an HBA Host 13 Renaming an HBA Host To rename a Host, complete the following steps. 1. Right-click an HBA icon in the Fabric topology and select Host Port Mapping. The Host Port Mapping dialog box displays. 2. Click the Host you want to rename in the Hosts table, wait a moment, and then click it again. The Host displays in edit mode. 3. Type a new name for the Host. The name of the Host appears in the Hosts table in alphabetical order with the new name.
13 Associating an HBA with a Host Associating an HBA with a Host ATTENTION Discovered information overwrites your user settings. To associate an HBA with a Host, complete the following steps. 1. Right-click an HBA icon in the Fabric topology and select Host Port Mapping. The Host Port Mapping dialog box displays. 2. Select the Host to which you want to assign HBAs in the Hosts table or click New Host to create a new Host. 3. Select the HBA from the HBAs table on the left and click the right arrow.
Importing HBA-to-Host mapping 13 4. Click Open on the Import dialog box. The file imports, reads, and applies all changes line-by-line and performs the following: • Checks for correct file structure and well-formed WWNs, and counts number of errors. If more than 5 errors occur, import fails and a ‘maximum error count exceeded’ message displays. Edit the Host port mapping file and try again. • Checks for duplicate HBAs. If duplicates exist, a message displays with the duplicate mappings detailed.
13 Removing an HBA from a Host Removing an HBA from a Host To remove an HBA from a Host, complete the following steps. 1. Right-click an HBA icon in the Fabric topology and select Host Port Mapping. The Host Port Mapping dialog box displays. 2. Select the HBA from the Hosts table on the right and click the left arrow. The HBA you selected is removed from the Hosts table and the HBA is no longer associated with the Host.
Exporting Host port mapping 13 4. Browse to the location where you want to save the export file. Depending on your operating system, the default export location are as follows: • Desktop\My documents (Windows) • \root (Linux) 5. Enter a name for the files and click Save. 6. Click OK to close the Host Port Mapping dialog box.
13 560 Exporting Host port mapping Brocade Network Advisor SAN User Manual 53-1003154-01
Chapter 14 Storage Port Mapping In this chapter • Storage port mapping overview . . . . . . . . . . . . . . . . . . . . . . . . . . . . . . . . . . • Creating a storage array . . . . . . . . . . . . . . . . . . . . . . . . . . . . . . . . . . . . . . . . • Adding storage ports to a storage array. . . . . . . . . . . . . . . . . . . . . . . . . . . . • Unassigning a storage port from a storage array . . . . . . . . . . . . . . . . . . . . • Reassigning mapped storage ports . . . . . . . . . . . . . . . .
14 Creating a storage array Creating a storage array To create a storage array, complete the following steps. 1. Select a storage port icon in the topology view, then select Discover > Storage Port Mapping. The Storage Port Mapping dialog box displays with the following information. • Storage Ports table — Lists the following information for all available storage ports. You can sort the table by clicking once on any of the column titles. Fabric Name — The fabric name.
Unassigning a storage port from a storage array 14 4. Click the right arrow. The storage port is added to the Storage Array. 5. Click OK to save your work and close the Storage Port Mapping dialog box. If the storage device is part of more than one fabric, a message displays: The selected Storage_Name/Storage_WWN is part of more than one fabric. The port nodes associated with the other fabrics will automatically be moved to the storage array. Click OK to close the message.
14 Editing storage array properties 6. Click the right arrow button. The storage port moves from the Storage Ports table to the selected storage array. 7. Click OK to save your work and close the Storage Port Mapping dialog box. Editing storage array properties To edit storage array properties, complete the following steps. 1. Select a storage port icon in the topology view, then select Discover > Storage Port Mapping. The Storage Port Mapping dialog box displays. 2.
Viewing storage array properties 14 4. Review the properties. 5. Click OK on the Properties dialog box. 6. Click OK on the Storage Port Mapping dialog box. Viewing storage array properties To view storage array properties, complete the following steps. 1. Select a storage port icon in the topology view, then select Discover > Storage Port Mapping. The Storage Port Mapping dialog box displays. 2. Select a storage array from the Storage Array list. 3. Click Properties. The Properties dialog box displays.
14 Importing storage port mapping 4. Click Open on the Import dialog box. The file imports, reads, and applies all changes line-by-line and performs the following: • Checks for correct file structure (first entry must be the storage node name (WWN) and second entry must be the storage array name), well formed WWNs, and counts number of errors If more than 5 errors occur, import automatically cancels. Edit the storage port mapping file and try again.
Exporting storage port mapping 14 Exporting storage port mapping The Storage Port Mapping dialog box enables you to export a storage port array. The export file uses the CSV format. The first row contains the headers (Storage Node Name (WWNN), Storage Array Name) for the file. Example Storage Node Name (WWNN), Storage Array Name 20000004CFBD7100,New Storage Array 20000004CFBD896E,New Storage Array 20000037E19CED,New Storage Array To export a storage port array, complete the following steps. 1.
14 568 Exporting storage port mapping Brocade Network Advisor SAN User Manual 53-1003154-01
Chapter 15 Host Management In this chapter • Host management. . . . . . . . . . . . . . . . . . . . . . . . . . . . . . . . . . . . . . . . . . . . . • Supported adapters . . . . . . . . . . . . . . . . . . . . . . . . . . . . . . . . . . . . . . . . . . . • HCM software . . . . . . . . . . . . . . . . . . . . . . . . . . . . . . . . . . . . . . . . . . . . . . . . • Host adapter discovery . . . . . . . . . . . . . . . . . . . . . . . . . . . . . . . . . . . . . . . . . • VM Manager. . . . . . . . . . .
15 Supported adapters The Management application, in conjunction with HCM, provides end-to-end management capability. For information about configuring, monitoring, and managing individual adapters using the HCM GUI or the Brocade Command Utility (BCU), refer to the Adapters Administrator’s Guide.
Supported adapters 15 Converged Network Adapters Table 57 describes available Converged Network Adapters (CNAs) for PCIe x 8 host bus interfaces, hereafter referred to as CNAs. These adapters provide reliable, high-performance host connectivity for mission-critical SAN environments.
15 HCM software AnyIOTM technology Although the Brocade 1860 Fabric Adapter can be shipped in a variety of small form-factor pluggable (SFP) transceiver configurations, you can change port function to the following modes using Brocade AnyIOTM technology, provided the correct SFP transceiver is installed for the port: • HBA or Fibre Channel mode — This mode utilizes the Brocade Fibre Channel storage driver. An 8 or 16 Gbps Fibre Channel SFP transceiver can be installed for the port.
HCM software 15 HCM features Common HBA and CNA management software features include the following: • Discovery using the agent software running on the servers attached to the SAN, which enables you to contact the devices in your SAN. • Configuration management, which enables you to configure local and remote systems.
15 Host adapter discovery Host adapter discovery The Management application enables you to discover individual hosts, import a group of hosts from a CSV file, or import host names from discovered fabrics. The maximum number of host discovery requests that can be accepted is 1000. Host discovery requires HCM Agent 2.0 or later. ESXi host adapter discovery requires the vendor-specific HBA CIM provider to be installed on the ESXi host.
HCM and Management application support on ESXi systems 15 6. Enable or disable the vSphere client plug-in registration. If you enable this plug-in, events are forwarded from the Management application to the vCenter server. 7. Click OK. The VMM discovery process begins. When complete, the vCenter server and all ESX and ESXi hosts managed by that vCenter display in the Host product tree.
15 HCM and Management application support on ESXi systems ESXi CIM listener ports The Management application server uses two CIM indication listener ports to listen for CIM indications. NOTE s Management Application does not support CIM indications for Emulex Adapters. • HCM Proxy Service CIM Indication Listener Port — This port is used to listen for CIM indications from ESXi hosts managed through HCM instances launched by the Management application.
Connectivity map 15 3. Select CIM server (ESXi only) as the Contact option. 4. (Optional) Select HTTP or HTTPS from the Protocol list. HTTPS is the default. 5. Click OK. Connectivity map The Connectivity Map, which displays in the upper right area of the main window, is a grouped map that shows physical and logical connectivity of Fabric OS components, including discovered and monitored devices and connections. These components display as icons in the Connectivity Map.
15 Adapter software If you create a new host and associate HBAs to it, and then you try to discover a host with the same HBAs using Host discovery, the HBAs discovered using host discovery must match the HBAs associated to the host exactly; otherwise, host discovery will fail. Instructions for mapping a host to HBAs are detailed in Chapter 13, “Host Port Mapping”.
Adapter software 15 • Name — The name of the host. The first three digits indicate the host’s operating system; for example, WIN or LIN. • Operating System — The host operating system; for example, Microsoft Windows or Red Hat Linux. • Driver Version — The host’s current driver version. • Architecture — The host’s architecture; for example, 32-bit or 64-bit. 3. Select one or more hosts from the Selected Hosts list.
15 Adapter software FIGURE 222 Driver Repository dialog box 2. Click Import on the Driver Repository dialog box. The Import Driver Repository dialog box displays. 3. Locate the driver file using one of the following methods: • Search for the file you want from the Look In list. • Enter the name of the image file you want to import in the File Name field. 4. Click Open. After the import completes, you see a message that the driver imported successfully. 5. Click OK.
Adapter software 15 Importing a boot image into the repository Boot images are required for adapters that are shipped without a boot image or when it is necessary to overwrite images on adapters that contain older or corrupted boot image versions. 1. From the Management application menu bar, select Configure > Host > Adapter Software. 2. Click the Boot Image tab. The Boot Image Management dialog box, shown in Figure 223, displays. FIGURE 223 Boot Image Management dialog box 3.
15 Adapter software 6. Locate the boot image file using one of the following methods: • Search for the file you want from the Look In list. Boot image files version 2.0.0.0 and 2.1.0.0 are .zip files and other boot image files are .tar files. • Enter the name of the image file you want to import in the File Name field. 7. Click Open. After the import completes, you see a message that the boot image imported successfully.
Bulk port configuration 15 Deleting a boot image from the repository 1. Select one or more boot images from the Boot Image File Name list on the Boot Image Repository dialog box. 2. Click Delete. The boot image is removed from the boot image repository. Backing up boot image files You can back up the boot image files from the repository using the Options dialog box. Refer to “Backup support” on page 599 for instructions.
15 Bulk port configuration Configuring host adapter ports To create, edit, duplicate, or delete port configurations, complete the following steps. Select Host > Adapter Ports from the Configure menu. The Configure Host Adapter Ports dialog box, shown in Figure 225, displays.
Bulk port configuration 15 Adding a port configuration The Add Port Configuration dialog box allows you to create a maximum of 50 customized port configurations which you can then select and assign to ports. 1. Click Add on the Configure Host Adapter Ports dialog box. The Add Port Configuration dialog box, shown in Figure 226, displays. FIGURE 226 Add Port Configuration dialog box 2. Enter a name for the port configuration in the Configuration Name field.
15 Bulk port configuration - Target Rate Limiting — Enable the Target Rate Limiting feature to minimize congestion at the adapter port. Limiting the data rate to slower targets ensures that there is no buffer-to-buffer credit back-pressure between the switch due to a slow-draining target. NOTE NOTE: Target Rate Limiting and QoS cannot be enabled at the same time.
Bulk port configuration 15 • Enter the minimum allowable output bandwidth in the Min Bandwidth (Mbps) box. The minimum bandwidth is 0 Mbps. A zero value of minimum bandwidth (the default) implies that no bandwidth is guaranteed for that vNIC. • BB Credit Recovery — Enables you to enable or disable buffer-to-buffer (BB) credits, which are a flow control mechanism that represent the availability of resources at the receiving port.
15 Adapter port WWN virtualization Adapter port WWN virtualization Adapter port world wide name (WWN) virtualization enables the adapter port to use a switch-assigned WWN rather than the physical port WWN for communication, allowing you to preprovision the server with the following configuration tasks: • Create the zones with the Fabric Assigned WWN (FAWWN) before the servers and devices are connected to the switches, before they are exposed to the SAN network.
Adapter port WWN virtualization 15 Enabling the FAWWN feature on a switch or AG ports 1. Select Configure > Fabric Assigned WWN. or Right-click the switch and select Fabric Assigned WWN. The Configure Fabric Assigned WWNs dialog box displays. 2. Select a switch port from the Fabric Assigned WWN - Configuration list. 3. Click the Enable button. The selected switch’s port status is enabled. 4. Click OK. The Fabric Assigned WWN Confirmation and Status dialog box displays. 5.
15 Adapter port WWN virtualization Manually assigning a FAWWN to a switch or AG port 1. Select Configure > Fabric Assigned WWN. or Right-click the switch and select Fabric Assigned WWN. The Configure Fabric Assigned WWNs dialog box displays. 2. Select a switch port or AG port from the Fabric Assigned WWN - Configuration list. 3. Click the Auto button. If the switch port does not have an Auto FAWWN map type and the FAWWN feature is not yet enabled on the port, a To Be Generated message displays. 4.
Adapter port WWN virtualization 15 FAWWNs on attached AG ports The Configure Fabric Assigned Assigned WWNs dialog box, shown in Figure 228, enables you to configure the Fabric Assigned WWN feature on a selected attached Access Gateway (AG) port. 1. Select Configure > Fabric Assigned WWN. or Right-click the switch and select Fabric Assigned WWN. The Configure Fabric Assigned WWNs dialog box displays. 2. Click the Attached AG Ports tab.
15 Adapter port WWN virtualization 5. Enter a valid world wide name (WWN), with or without colons, for the Access Gateway node. Optionally, you can select an existing AG Node WWN from the list. The AG Node WWN box includes all discovered AG Node WWNs that are connected to the selected switch. 6. Enter a port or a port range using numbers or a hyphen (-). For example, you can enter a range as 1-6 or you can separate values with a comma; for example: 1, 2, 5, 7-10, 20. 7.
Role-based access control 15 Role-based access control The Management application enables you to create resource groups and assign users to the selected role within that group. This enables you to assign users to a role within the resource group. The Management application provides one preconfigured resource group (All Fabrics). When you create a resource group, all available roles are automatically assigned to the resource group.
15 Host performance management Host performance management Real-time performance enables you to collect data from managed HBA and CNA ports. You can use real-time performance to configure the following options: • Select the polling rate from 20 seconds up to 1 minute. • Select up to 32 ports total from a maximum of 10 devices for graphing performance. • Choose to display the same Y-axis range for both the Tx MBps and Rx MBps measure types for easier comparison of graphs.
Host security authentication TABLE 59 15 Counters (Continued) FC port measures HBA port measures CNA port measures Transmitted FCoE pause frames Received FCS error frames Transmitted FCS error frames Received alignment error frames Received length error frames Received code error frames Instructions for generating real-time performance data are detailed in “Generating a real-time performance graph” on page 1074.
15 Host security authentication FIGURE 229 Fibre Channel Security Protocol Configuration dialog box 3. Configure the following parameters on the Fibre Channel Security Protocol Configuration dialog box: a. Select the Enable Authentication check box to enable the authentication policy. If authentication is enabled, the port attempts to negotiate with the switch. If the switch does not participate in the authentication process, the port skips the authentication process. b.
supportSave on adapters 15 supportSave on adapters Host management features support capturing support information for managed Brocade adapters, which are discovered in the Management application. You can trigger supportSave for multiple adapters at the same time. supportSave cannot be used to collect support information for ESXi hosts managed by a CIM Server. Refer to the Brocade Adapters Administrator’s Guide for information about supportSave on ESXi hosts.
15 Host fault management Filtering event notifications The Management application provides notification of many different types of SAN events. If a user wants to receive notification of certain events, you can filter the events specifically for that user. NOTE The e-mail filter in the Management application is overridden by the firmware e-mail filter.
Backup support 15 Backup support The Management application helps you to protect your data by backing it up automatically. The data can then be restored, as necessary. Configuring backup to a hard drive NOTE Configuring backup to a hard drive requires a hard drive. The drive should not be the same physical drive on which your operating system or the Management application is installed. To configure the backup function to a hard drive, complete the following steps. 1. Select Server > Options.
15 Backup support Enabling backup Backup is enabled by default. However, if it has been disabled, complete the following steps to enable the function. 1. Select Server > Options. The Options dialog box displays. 2. Select Server Backup in the Category list. 3. Select the Enable Backup check box. 4. Click Apply or OK. Disabling backup Backup is enabled by default. If you want to stop the backup process, you must disable backup. To disable the backup function, complete the following steps. 1.
Chapter 16 Fibre Channel over Ethernet In this chapter • FCoE overview . . . . . . . . . . . . . . . . . . . . . . . . . . . . . . . . . . . . . . . . . . . . . . . . • Enhanced Ethernet features. . . . . . . . . . . . . . . . . . . . . . . . . . . . . . . . . . . . . • FCoE protocols supported. . . . . . . . . . . . . . . . . . . . . . . . . . . . . . . . . . . . . . . • FCoE licensing . . . . . . . . . . . . . . . . . . . . . . . . . . . . . . . . . . . . . . . . . . . . . . . .
16 Enhanced Ethernet features DCBX protocol Data Center Bridging Exchange (DCBX) protocol allows enhanced Ethernet devices to convey and configure their DCB capabilities and ensures a consistent configuration across the network. DCBX protocol is used between DCB devices, such as a converged network adapter (CNA) and an FCoE switch, to exchange configuration with directly connected peers.
FCoE protocols supported 16 Ethernet jumbo frames The basic assumption underlying FCoE is that TCP/IP is not required in a local data center network and the necessary functions can be provided with Enhanced Ethernet. The purpose of an “enhanced” Ethernet is to provide reliable, lossless transport for the encapsulated Fibre Channel traffic. Enhanced Ethernet provides support for jumbo Ethernet frames and in-order frame delivery.
16 FCoE licensing FCoE licensing The FCoE license enables Fibre Channel over Ethernet (FCoE) functionality on the following supported DCB switches: • • • • • Network OS 10 GbE 24-port 8 GbE 8 FC port switch Network OS VDX 6710, 6720, and 6730 switches Network OS VDX 6740 and 6740T switches Network OS VDX 8770-series switches Network OS VDX 2730 10 GbE connection blade for the Fujitsu PRIMERGY BX900 and BX400 Blade Servers Without the FCoE license, the DCB switches are pure Layer 2 Ethernet switches and
DCB configuration management 16 2. Highlight a discovered DCB switch from the Available Switches list, and click the right arrow button to move the switch to the Selected Switches list. 3. Highlight the selected switch and click OK to start the configuration. The running configuration is saved to the selected switch, effective on the next system startup.
16 Switch policies Switch policies You can configure and enable a number of DCB policies on a switch, port, or link aggregation group (LAG). The following switch policy configurations apply to all ports in a LAG: • DCB map and Traffic Class map • Link Layer Discovery Protocol (LLDP) The switch policies are described in the following sections.
DCB configuration 16 DCB configuration To launch the DCB Configuration dialog box, select Configure > DCB from the menu bar. The DCB Configuration dialog box displays, showing the status of all DCB-related hardware and functions. NOTE For FOS DCB devices, the Protocol Down Reason column, shown in Figure 231, displays the values only for the external ports of embedded platforms but not for the internal ports.
16 DCB configuration FIGURE 232 Edit Switch dialog box - QoS tab 4. Select DCB from the Map Type list. 5. Configure the following DCB Map parameters in the DCB Map area: • Name - Enter a name to identify the DCB map. • Precedence - Enter a value from 1 through 100. This number determines the map’s priority. • Priority Flow Control check box - Check to enable priority-based flow control on individual priority groups.
DCB configuration 16 6. Click the right arrow button to add the map to the DCB Maps list. If a DCB map exists with the same name, a validation dialog box launches and you are asked if you want to overwrite the map. 7. Click OK. 8. When you have finished the configuration, click OK to launch the Deploy to Products dialog box. Configuring LLDP To configure LLDP, complete the following steps. 1. Select Configure > DCB. The DCB Configuration dialog box displays. 2.
16 DCB configuration 7. Click OK after changing the attributes of the current deployment. The Deployment Status dialog box displays. 8. Click Start on the Deployment Status dialog box to save the changes to the switch. 9. Click Close to close the Deployment Status dialog box. Configuring the DCB interface with the DCB map and global LLDP profile To configure the DCB interface, complete the following steps. 1. Select Configure > DCB. The DCB Configuration dialog box displays. 2.
DCB configuration 16 The Web Tools application displays. You can also launch Web Tools by clicking the Element Manager button on the DCB Configuration dialog box. 3. Click the DCB tab. 4. Click the VLAN tab. 5. Click Add. The VLAN Configuration dialog box displays. 6. Enter the VLAN identifier in the VLAN ID field. 7. Click OK on the VLAN Configuration dialog box. 8. Select the VLAN you created and click Edit to convert the VLAN to FCoE VLAN. 9. Select the FCoE check box. 10.
16 DCB configuration Adding a LAG Link aggregation, based on the IEEE 802.3ad protocol, is a mechanism to bundle several physical ports together to form a single logical channel or trunk. The collection of ports is called a link aggregation group (LAG). NOTE An internal port cannot be part of a LAG. You can create LAGs with external ports only. • The Add LAG button on the DCB Configuration dialog box is enabled when a single DCB switch or ports of a single DCB switch are selected.
DCB configuration 16 FIGURE 234 Add LAG dialog box 4. Configure the following LAG parameters: NOTE Ports with 802.1x authentication or ports that are enabled in L2 mode or L3 mode are not supported in a LAG. • LAG ID - Enter the LAG identifier, using a value from 1 through 63. Duplicate LAG IDs are not allowed. • Status - Click the Enable check box to enable the LAG. You must enable the LAG to use the DCB functionality. • Interface Mode - Select None or L2.
16 DCB configuration • Type - Sets the limit on the size of the LAG. The type values include Standard, where the LAG is limited to 16 ports, and Brocade LAG, where the LAG is limited to 4 ports. The default is Standard. NOTE You cannot create Fabric OS-type LAGs from different anvil chips. If you do, an error message displays. Only the first port is considered as part of the LAG. • Mode - Sets all ports added to the LAG members list in either Static or Dynamic mode.
DCB configuration 16 FIGURE 235 Edit Switch dialog box 4. Configure the policies for the Edit Switch dialog box tabs, which are described in the following sections: • • • • • “QoS configuration” on page 620 “FCoE provisioning” on page 626 “VLAN classifier configuration” on page 628 “LLDP-DCBX configuration” on page 632 “802.1x authentication” on page 636 5. When you have finished configuring the policies, apply the settings to the switch.
16 DCB configuration Editing a DCB port 1. Select Configure > DCB. The DCB Configuration dialog box displays, showing the status of all DCB-related hardware and functions. 2. Select a DCB port from the Products/Ports list. 3. Click Edit. The Edit Port dialog box displays, as shown in Figure 236. FIGURE 236 Edit Port dialog box 4. Modify the following DCB port parameters as required: • Interface Mode - Select None or L2. For external ports, the L3 interface mode displays in addition to None or L2.
DCB configuration 16 5. When you have finished configuring the policies, apply the settings to the DCB port. NOTE Clicking Cancel when there are pending changes launches a pop-up dialog box. 6. Click OK when you have finished modifying the DCB port parameters. The Deploy to Ports dialog box displays. 7. Click OK after changing the attributes of the current deployment. The Deployment Status dialog box launches. 8.
16 DCB configuration 4. Configure the following LAG parameters, as required: NOTE Ports with 802.1x authentication or ports that are enabled in L2 mode or L3 mode are not supported in a LAG. • LAG ID - The LAG identifier, which is not an editable field. • Status - Click the Enable check box to enable the LAG. You must enable the LAG to use the DCB functionality. • Interface Mode - Select None or L2. For external ports, the L3 interface mode displays, in addition to None or L2.
DCB configuration 16 8. Click Start on the Deployment Status dialog box to save the changes to the selected LAG or LAGs. NOTE If the primary or secondary IP address already exists on another interface, an error message displays in the Status area. 9. Click Close to close the Deployment Status dialog box. Enabling a DCB port or LAG If you select multiple switches or multiple ports and LAGs from two or more switches, both the Enable button and the Disable button are disabled. 1. Select Configure > DCB.
16 QoS configuration QoS configuration QoS configuration involves configuring packet classification, mapping the priority and traffic class, controlling congestion, and scheduling. The configuration of these QoS entities consists of DCB Map and Traffic Class Map configuration. In a Data Center Bridging (DCB) configuration, Enhanced Transmission Selection (ETS) and priority-based flow control (PFC) are configured by utilizing a priority table, a priority group table, and a priority traffic table.
QoS configuration 16 Creating a DCB map The procedure in this section applies only for Fabric OS versions earlier than Fabric OS 7.0. When you create a DCB map, each of the Class of Service (CoS) options (0-7) must be mapped to at least one of the Priority Group IDs (0-7) and the total bandwidth percentage must equal 100. All QoS, DCB map, and Traffic Class map configurations apply to all ports in a LAG. There can be, at the most, 16 entries in the Priority Group table.
16 QoS configuration • Precedence - Enter a value from 1 through 100. This number determines the map’s priority. • Priority Flow Control check box - Check to enable priority-based flow control on individual priority groups. • CoS - Click the CoS cell to launch the Edit CoS dialog box, where you can select and assign one or more priorities (PG ID 15.0 through 15.7). All of the eight CoS values (0-7) must be used in a DCB map, separated with a comma and a space.
QoS configuration 16 • Precedence - Enter a value from 1 through 100. This number determines the map’s priority. • % Bandwidth - Enter a bandwidth value for priority group IDs 0-7. The total of all priority groups must equal 100 percent. • Priority Flow Control check box - Check to enable priority flow control on individual priority groups. • CoS - Click the CoS cell to launch the Edit CoS dialog box, where you can select and assign one or more priorities (PG ID 15.0 through 15.7). 6.
16 QoS configuration Assigning a DCB map to a port or link aggregation group The Edit Port dialog box - QoS tab allows you to assign DCB maps to ports and LAGs on a selected switch. NOTE QoS maps are created using the Edit Switch dialog box, accessible from the DCB Configuration dialog box. A port can have either a DCB map or a Traffic Class map assigned to it, but it cannot have both. 1. Select Configure > DCB.
QoS configuration 16 6. Click the Traffic Class cell in a CoS row and directly enter a value from 0-7. You can leave the cell empty to indicate zero (0). 7. Click the right arrow button to add the map to the Traffic Class Maps list. If the name of the Traffic Class map already exists, an overwrite warning message displays. Click Yes to overwrite the existing Traffic Class map. 8. When you have finished the configuration, click OK to launch the Deploy to Products dialog box.
16 FCoE provisioning 8. Click Start on the Deployment Status dialog box to save the changes to the selected devices. Assigning a Traffic Class map to a port or link aggregation group You can assign a Traffic Class map to a port or ports under the LAG; however, a port does not require a Traffic Class map be assigned to it. A port can have either a DCB map or a Traffic Class map assigned to it, but it cannot have both. NOTE You cannot configure QoS or LLDP-DCBX on a LAG. 1. Select Configure > DCB.
FCoE provisioning 16 Changing the VLAN ID on the default FCoE map You can change the VLAN ID on the default FCoE map only when no ports or LAGs are participating as members of the switch. You must first manually remove the FCoE map option for each of the port members before you change the VLAN ID on the switch. NOTE You can complete this procedure using the Management application on embedded platforms such as the Fabric OS converged 10 GbE switch module for the IBM BladeCenter or the Dell M8428-k switch.
16 VLAN classifier configuration 3. Click the FCoE tab on the Edit Port dialog box. The Edit Port dialog box, FCoE tab displays the following parameters: • FCoE Map field — Displays the name of the FCoE map (read-only). • VLAN ID list — The FCoE VLAN identifier associated with the FCoE map. The values range from 2 through 3583, and 1002 is the default. • DCB Map — Displays the name of the DCB map (read-only). • Details of selected DCB Map list: PG - ID — Lists the priority group ID (15.
VLAN classifier configuration 16 Adding a VLAN classifier rule The Edit Switch dialog box, VLAN Classifiers tab allows you to create rules and group them into VLAN classifiers, which can then be applied to access port and LAG VLAN members and converged port VLAN members. 1. Select Configure > DCB. The DCB Configuration dialog box displays, showing the status of all DCB-related hardware and functions. 2. Select a switch and click Edit. 3. Click the VLAN Classifiers tab on the Edit Switch dialog box.
16 VLAN classifier configuration FIGURE 240 Add Rules dialog box The Rule ID field is pre-populated with the next available rule ID number. 5. Keep the rule ID number as it is, or change the number using a value from 1 through 256. 6. Select a rule type. Valid rule types are MAC (MAC address-based rule) and Proto (802.1Q protocol-based rule). 7. If Ethernet Type is selected as the protocol rule type, enter any valid four-digit hexadecimal value within the allowed range of 0x0000 through 0xFFFF.
VLAN classifier configuration 16 • IP — 0x8881 • IPv6 — 0x86DD 4. Select an encapsulation type from the list. Options include Ethv2, nosnapllc, and snapllc. The Encapsulation list only accepts a value when Protocol is selected as the rule type. 5. Click OK to add the edited rule to the Available Rules list on the VLAN Classifiers tab of the Edit Switch dialog box and close the Edit Rules dialog box. 6. When you have finished the configuration, click OK to launch the Deploy to Products dialog box.
16 LLDP-DCBX configuration Deleting a VLAN classifier group 1. Click the VLAN Classifiers tab on the Edit Switch dialog box. The Edit Switch dialog box, VLAN Classifiers tab displays. 2. Select a classifier from the VLAN Classifiers list. 3. Click Delete. The VLAN classifier group is deleted. 4. When you have finished the configuration, click OK to launch the Deploy to Products dialog box.
LLDP-DCBX configuration 16 FIGURE 241 Edit Switch dialog box - LLDP-DCBX tab Adding an LLDP profile NOTE When a TE port is selected to assign to an LLDP profile, a yellow banner displays with the following error message: “LLDP-DCBX is disabled on this switch. The configuration becomes functional when LLDP-DCBX is enabled on the switch.” 1. Select Configure > DCB. The DCB Configuration dialog box displays, showing the status of all DCB-related hardware and functions. 2. Select a switch, and click Edit. 3.
16 LLDP-DCBX configuration • Check the profile parameters that you want to display as part of the LLDP profile from the Advertise list: Port description - The user-configured port description. System name - The user-configured name of the local system. System capabilities - The system capabilities running on the system. System description - The system description containing information about the software running on the system.
LLDP-DCBX configuration 16 3. Click the LLDP-DCBX tab on the Edit Switch dialog box. 4. Select an existing LLDP profile from the LLDP Profiles list in the upper right pane. NOTE You cannot delete . You can, however, edit global configurations. For more information, refer to “Product configuration templates” on page 1449. 5. Click the left arrow button. The selected LLDP profile is removed from the list. 6.
16 802.1x authentication 802.1x authentication 802.1x is a standard authentication protocol that defines a client-server-based access control and authentication protocol. 802.1x restricts unknown or unauthorized clients from connecting to a LAN through publicly accessible ports. NOTE 802.1x is not supported for internal ports. A switch must be enabled for 802.1x authentication before you configure its parameters. See “Setting 802.1x parameters for a port” for more information. Enabling 802.
802.1x authentication 16 Setting 802.1x parameters for a port The 802.1x parameters can be configured whether or not the feature is enabled on the switch. The default parameters are initially populated when 802.1x is enabled, but you can change the default values as required. 1. Select Configure > DCB from the menu bar. The DCB Configuration dialog box displays, showing the status of all DCB-related hardware and functions. 2. Select a port and click Edit. 3. Click the 802.
16 Switch, port, and LAG deployment • Port Control - Select an authorization mode from the list to configure the ports for authorization. Options include auto, force-authorized, or force-unauthorized and the default value is auto. 6. When you have finished the configuration, click OK to launch the Deploy to Ports dialog box. Refer to “Switch, port, and LAG deployment” on page 638 for more information.
Switch, port, and LAG deployment 16 FIGURE 243 Deploy to Products dialog box FIGURE 244 Deploy to Ports dialog box Brocade Network Advisor SAN User Manual 53-1003154-01 639
16 Switch, port, and LAG deployment FIGURE 245 Deploy to LAGs dialog box 4. Click one of the following deployment options: • • • • Deploy now Save and deploy now Save deployment only Schedule 5. Click one of the following save configuration options: • Save to running • Save to running and startup • Save to running and startup then reboot The name for the scheduled product deployment is pre-populated with a “DCB-MM-DD-YYYY-HR-MIN-SS” prefix. This is an editable field. 6.
Switch, port, and LAG deployment 16 8. Select one or more of the following configurations, to be deployed on the selected targets. NOTE These configurations can be pushed to target DCB switches, FOS version 6.3.1_cee or 6.3.1_del. For switches: • • • • • • QoS, DCB Map QoS, Traffic Class Map FCoE Map VLAN Classifiers and Rules LLDP Profiles 802.1x Configuration NOTE See “Source to target switch Fabric OS version compatibility for deployment” for restrictions.
16 Switch, port, and LAG deployment Source to target switch Fabric OS version compatibility for deployment Table 62 lists the restrictions that exist when deploying source switches to target switches. TABLE 62 Source to target switch Fabric OS version compatibility Source Fabric OS version and device Target Fabric OS version supported Comments Fabric OS DCB switch and FCOE10-24 DCB blade with Fabric OS version 6.4.2 or earlier.
DCB performance 16 DCB performance Performance monitoring provides details about the quantity of traffic and errors a specific port or device generates on the fabric over a specific time frame. You can also use Performance features to indicate the devices that create the most traffic and to identify the ports that are most congested. The Performance menu items launch either SAN or IP performance dialog boxes based on which tab you select.
16 DCB performance Generating a real-time performance graph from the IP tab To generate a real-time performance graph for a Network OS or FOS DCB switch, complete the following steps. 1. Click the IP tab. 2. Select a DCB port from the DCB Configuration dialog box, and select Real Time Graph from the Performance list. A message displays, prompting you to close the DCB Configuration dialog box. 3. Click OK to close the DCB Configuration dialog and open the Performance dialog box.
DCB performance 16 Historical performance graph The Historical Performance Graph dialog box enables you to customize how you want the historical performance information to display. Generating a historical performance graph You can generate a historical performance graph by selecting both Network OS and FOS DCB devices from the IP Tab or by selecting only Network OS DCB devices from the IP tab. 1.
16 FCoE login groups FCoE login groups The FCoE Configuration dialog box allows you to manage the FCoE login configuration parameters on the DCB switches in all discovered fabrics. FCoE login configuration is created and maintained as a fabric-wide configuration. With the FCoE license, the FCoE Configuration dialog box displays virtual FCoE port information and enables you to manage the virtual port information.
FCoE login groups 16 • Click Edit to launch the Edit Login Group dialog box, where you can edit the login group parameters. See “Editing an FCoE login group” on page 648. • Click Delete to remove the login group from the list. See “Deleting one or more FCoE login groups” on page 649. Adding an FCoE login group Complete the following steps to add switches to a login group. You can manually add ports by entering the world wide name (WWN) or select available managed CNAs from all discovered hosts.
16 FCoE login groups 5. Select one of the following Available Member options: • Port WWN — Click to enter the world wide name (WWN) of the port to associate with the selected switch. The member port WWN text field allows a maximum of 16 digits. • Managed CNAs — Click to show a list of products and ports which can be selected as login group members. 6. Select available members from the Products/Ports list and click the right arrow button to move the available members to the Selected Members list. 7.
FCoE login groups 16 • Rename the login group by entering the new name into the Name field. The Allow All option must be selected to rename the login group. • Select one of the following options to add or remove login members into the Available Members list. The Allow Specific option must be selected to add or remove login members. • Port WWN — Click to enter the world wide name (WWN) of the port to associate with the selected switch. The member port WWN text field allows a maximum of 16 digits.
16 Virtual FCoE port configuration 4. Click Start to apply the changes, or click Close to abort the operation. The FCoE login management feature is disabled and all login groups on the selected switch are deleted. The value in the FCoE Login Management State column for the selected switch is Disabled and no login groups appear under the switch after the FCoE Configuration dialog box refresh operation. Enabling the FCoE login management feature on a switch 1. Select Configure > FCoE from the menu bar.
Virtual FCoE port configuration 16 • There is a dynamic binding between the virtual FCoE port and the physical port or LAG. • There is a static binding between the virtual FCoE port and the physical port or lag and there are end devices connected to it. To view the virtual FCoE ports, complete the following steps: 1. Select Configure > FCoE from the menu bar. or Right-click the DCB device and select FCoE. The FCoE Configuration dialog box displays. 2. Select the Virtual FCoE Ports tab.
16 Virtual FCoE port configuration Clearing a stale entry A stale entry is a device that logged in and logged off but, because a port went down after an FLOGI was received, the device failed to receive the message. The entry in the FCoE Connected Devices table becomes stale and you must clear it manually. NOTE Clearing a stale entry is not supported for Network OS devices. 1. Select a virtual FCoE port from the FCoE Configuration dialog box and click Connected Devices.
Chapter Security Management 17 In this chapter • Layer 2 access control list management . . . . . . . . . . . . . . . . . . . . . . . . . . . 653 • Security configuration deployment. . . . . . . . . . . . . . . . . . . . . . . . . . . . . . . . 662 Layer 2 access control list management A Layer 2 access control list (ACL) enables you to filter traffic based on the information in the IP packet header using the MAC address and Ethernet type.
17 Layer 2 access control list management Creating a standard Layer 2 ACL configuration (Fabric OS) To create a standard Layer 2 ACL configuration, complete the following steps. 1. Select the device and select Configure > Security > Layer 2 ACL > Product. The Device_Name - Layer 2 ACL Configuration dialog box displays. 2. Select New from the Add list. The Device_Name - Layer 2 ACL Configuration dialog box displays. FIGURE 253 Device_Name - Layer 2 ACL Configuration (Standard) dialog box 3.
Layer 2 access control list management 17 11. Click OK on the Device_Name - Layer 2 ACL Configuration dialog box. The Deploy to Products - Layer 2 ACL dialog box displays. To save the configuration, refer to “Saving a security configuration deployment” on page 664 Editing a standard Layer 2 ACL configuration (Fabric OS) To create a standard Layer 2 ACL configuration on a Fabric OS device, complete the following steps. 1. Select the device and select Configure > Security > Layer 2 ACL > Product.
17 Layer 2 access control list management 4. To edit an existing ACL rule, complete the following steps. a. Select the rule you want to edit in the ACL Entries list and click the left arrow button. b. Complete step 5 through step 9 in “Creating a standard Layer 2 ACL configuration (Fabric OS)” on page 654. The updated ACL entry displays in the ACL Entries list. To edit additional ACL entries, repeat step 4. 5.
Layer 2 access control list management 17 5. Enter a sequence number for the ACL in the Sequence field. 6. Select Permit or Deny from the Action list. 7. In the Source list, select one of the following options: • Any • Host • MAC Selecting MAC or Host enables the Source field. Enter the source address on which the configuration filters traffic in the Source field. 8.
17 Layer 2 access control list management Editing an extended Layer 2 ACL configuration (Fabric OS) To edit an extended Layer 2 ACL configuration on a Fabric OS device, complete the following steps. 1. Select the device and select Configure > Security > Layer 2 ACL > Product. The Device_Name - Layer 2 ACL Configuration dialog box displays. 2. Select the ACL you want to edit in the ACLs list and click Edit. The Configuration_Name Edit Extended Layer 2 ACL Configuration dialog box displays. 3.
Layer 2 access control list management 17 5. To add a new ACL rule, complete step 4 through step 12 in “Creating an extended Layer 2 ACL configuration (Fabric OS)” on page 656. The new ACL entry displays in the ACL Entries list. To add additional ACL entries, repeat step 5. 6. To delete an existing ACL rule, select the rule you want to edit in the ACL Entries list and click the left arrow button. 7. Click OK on the Duplicate - Layer 2 ACL Configuration dialog box.
17 Layer 2 access control list management • Select Deployment_Name (a user-configured deployment) to assign a user-configured deployment on the port. 5. Select the ACL you want to assign to the port from the second Assign ACL list. 6. Select the Write to Product check box to create the selected ACL on the device if it does not already exist. 7. Click OK on the Device_Name - Port_Number - Layer 2 ACL Configuration dialog box. The Deploy to Ports - Layer 2 ACL dialog box displays.
Layer 2 access control list management 17 Deleting a Layer 2 ACL configuration from the application To delete a Layer 2 ACL configuration from the application, complete the following steps. 1. Select the device and select Configure > Security > Layer 2 ACL > Product. The Device_Name - Layer 2 ACL Configuration dialog box displays. 2. Select the Layer 2 ACL you want to delete in the ACLs list and click Delete. This deletes the Layer 2 ACL configuration from the application. 3.
17 Security configuration deployment Security configuration deployment Figure 256 shows the standard interface used to deploy security configurations. FIGURE 256 Deploy to Product/Ports dialog box Before you can deploy a security configuration, you must create the security configuration. For step-by-step instructions, refer to the following sections: Security Management enables you to configure, persist, and manage a security configuration as a “deployment configuration object”.
Security configuration deployment 17 Deploying a security configuration on demand To deploy a security configuration immediately, complete the following steps. FIGURE 257 Deploy to Product/Ports dialog box 1. Choose one of the following options: • Deploy now — Select to deploy the configuration immediately on the product or port without saving the deployment definition.
17 Security configuration deployment Saving a security configuration deployment To save a security configuration deployment, complete the following steps. FIGURE 258 Deploy to Product/Ports dialog box 1. Select the Save deployment only option to save the deployment definition for future deployment. 2. Select one of the following save configuration options: • Save to running — Select to update the running configuration; however, the deployment is not saved to the product’s flash memory.
Security configuration deployment 17 Scheduling a security configuration deployment To schedule a security configuration deployment, complete the following steps. FIGURE 259 Deploy to Product/Ports dialog box 1. Select Configure > Security > Layer 2 ACL > Product. The Device_Name - Layer 2 ACL Configuration dialog box displays. 2. Choose one of the following options: • Select New from the Add list. The Add - Layer 2 ACL Configuration dialog box displays. • Select an ACL in the list and click Edit.
17 Security configuration deployment 10. Choose one of the following options to configure the frequency at which deployment runs for the schedule: • To configure deployment to run only once, refer to “Configuring a one-time deployment schedule” on page 666. • To configure hourly deployment, refer to “Configuring an hourly deployment schedule” on page 666. • To configure daily deployment, refer to “Configuring a daily deployment schedule” on page 667.
Security configuration deployment 17 Configuring a daily deployment schedule To configure a daily deployment schedule, complete the following steps. 1. Select Daily from the Frequency list. 2. Select the time of day you want deployment to run from the Time (hh:mm) lists. Where the hour value is from 1 through 12, the minute value is from 00 through 59, and the day or night value is AM or PM.
17 668 Security configuration deployment Brocade Network Advisor SAN User Manual 53-1003154-01
Chapter 18 FC-FC Routing Service Management In this chapter • Devices that support Fibre Channel routing . . . . . . . . . . . . . . . . . . . . . . . . • Fibre Channel routing overview . . . . . . . . . . . . . . . . . . . . . . . . . . . . . . . . . . • Guidelines for setting up Fibre Channel routing . . . . . . . . . . . . . . . . . . . . . • Connecting edge fabrics to a backbone fabric . . . . . . . . . . . . . . . . . . . . . . • Configuring routing domain IDs . . . . . . . . . . . . . . . . . . . .
18 Fibre Channel routing overview • Any of the following blades on a Backbone chassis: - 4 Gbps Router, Extension Blade - FC 8 GB 16-port Blade - FC 8 GB 32-port Blade - FC 8 GB 32-port Enhanced Blade (16 Gbps 4-slot or 16 Gbps 4-slot Backbone Chassis only) - FC 8 GB 48-port Blade - The shared ports area (ports 16-47) cannot be used as EX_Ports.
Guidelines for setting up Fibre Channel routing 18 Figure 260 on page 671 shows a metaSAN with a backbone fabric and three edge fabrics. The backbone consists of one 4 Gbps Router, Extension Switch connecting hosts in Edge fabrics 1 and 3 with storage in Edge fabric 2 and the backbone fabric.
18 Connecting edge fabrics to a backbone fabric Connecting edge fabrics to a backbone fabric The following procedure explains how to set up FC-FC routing on two edge fabrics connected through an FC router using E_Ports and EX_Ports. NOTE To configure an EX_Port, switches running Fabric OS 7.0.0 or earlier must have an FCR license. Switches running Fabric OS 7.0.1 or later configured in Brocade Native mode (IM0) or Brocade NOS mode (IM5) do not require an FCR license.
Connecting edge fabrics to a backbone fabric 18 FIGURE 261 Router Configuration-Connect Edge Fabric dialog box 3. Select the FC router from the Available Routers list. 4. Click the right arrow button to move the FC router you selected to the Selected Router list. 5. Select a valid fabric ID from the Fabric ID list. You can choose any unique fabric ID as long as it is consistent for all EX_Ports that connect to the same edge fabric.
18 Configuring routing domain IDs 9. Configure LSAN zones in each fabric that will share devices. For specific instructions, refer to “Configuring LSAN zoning” on page 911. Configuring routing domain IDs Logical (phantom) domains are automatically created to enable routed fabrics. Two types of logical domains are created: • A front domain is created in edge fabrics for every interfabric link (IFL). • A translate (Xlate) domain is created in routed fabrics that share devices.
Chapter Virtual Fabrics 19 In this chapter • Virtual Fabrics overview . . . . . . . . . . . . . . . . . . . . . . . . . . . . . . . . . . . . . . . . 675 • Virtual Fabrics requirements . . . . . . . . . . . . . . . . . . . . . . . . . . . . . . . . . . . . 677 • Configuring Virtual Fabrics . . . . . . . . . . . . . . . . . . . . . . . . . . . . . . . . . . . . . .
19 Virtual Fabrics overview Terminology for Virtual Fabrics Table 63 lists definitions of Virtual Fabrics terms. TABLE 63 676 Virtual Fabrics terms Term Definition Physical chassis The physical switch or chassis from which you create logical switches and fabrics. Logical switch A collection of ports that act as a single Fibre Channel (FC) switch. When Virtual Fabrics is enabled on the chassis, there is always at least one logical switch: the default logical switch.
Virtual Fabrics requirements 19 Virtual Fabrics requirements To configure Virtual Fabrics, you must have at least one Virtual Fabrics-enabled physical chassis running Fabric OS 6.2.0 or later in your SAN. Use one of the following options to discover a Virtual Fabrics-enabled physical chassis on the Management application topology: • Discover a Virtual Fabrics-capable seed physical chassis running Fabric OS 6.2.0 or later. Virtual Fabrics is disabled by default.
19 Virtual Fabrics requirements TABLE 65 Blade and port types supported on logical switches for backbone chassis Logical switch type Ports Default logical switch • • • • • • • • Logical switch Base switch • • • • • • • • • • • Extension Blade — E_Ports, F_Ports, GE_Ports, and VE_Ports Application Platform Blade — E_Ports and F_Ports FC 10-6 ISL Blade — E_Ports and F_Ports Encryption Blade — E_Ports, F_Ports, and Encryption ports FC 8 GB Port Blade — E_Ports and F_Ports FC 16 GB Port Blade — E_Por
FICON best practices for Virtual Fabrics 19 FICON best practices for Virtual Fabrics Use the following recommended best practices and considerations for configuring Virtual Fabrics in a FICON environment when following the procedures under “Configuring Virtual Fabrics” on page 680: • When configuring the logical switch in the New Logical Fabric Template or New Logical Switch dialog box (Fabric tab), use the following parameters.
19 Configuring Virtual Fabrics • When the Logical Switch Change Conformation and Status dialog box displays after configuring logical switches through the Logical Switches dialog box, be sure the following parameters are selected: - Re-Enable ports after moving them. Unbind Port Addresses while moving them QoS disable the ports while moving them.
Configuring Virtual Fabrics d. 19 Enable all of the base switches. This forms the base fabric. Right-click each base switch in the Connectivity Map or Product List and select Enable/Disable > Enable. 3. Set up logical switches in each physical chassis. a. Create logical switches in each physical chassis and assign ports to them. Make sure the logical switches are configured to allow XISL use. Refer to “Creating a logical switch or base switch” on page 682 for instructions. b.
19 Configuring Virtual Fabrics Disabling Virtual Fabrics ATTENTION Disabling Virtual Fabrics deletes all logical switches, returns port management to the physical chassis, and reboots the physical chassis. If these logical switches are participating in a fabric, all affected fabrics will be disrupted. 1. Select the physical chassis in the Chassis Group and select Configure > Virtual Fabric > Disable.
Configuring Virtual Fabrics 19 2. Select the physical chassis from which you want to create a logical switch in the Chassis list. You can display all logical switches from all chassis by selecting the Show Logical Switches from all Chassis check box. 3.
19 Configuring Virtual Fabrics • • • • Logical switches in an edge fabric connected to an FC router A logical switch in InteropMode 2 or InteropMode 3 The logical switch has VE_Ports and is running Fabric OS 6.4.x or earlier The logical switch has lossless DLS and is running Fabric OS 7.0.x or earlier NOTE For switches running Fabric OS 7.0.0 or later, VE_Ports on the 8 Gbps Extension Blade are supported on logical switches that use XISLs. d.
Configuring Virtual Fabrics 19 Finding the physical chassis for a logical switch The Management application enables you to locate the physical chassis in the Product List from which the logical switch was created. To find the physical chassis for a logical switch, right-click the logical switch in the Connectivity Map or Product List and select Virtual Fabric > Chassis. The physical chassis is highlighted in the Product List.
19 Configuring Virtual Fabrics 7. Click the right arrow button to move the selected ports to the logical switch. If you selected the Addressing check box, enter the starting port address in the Bind Port Address dialog box. The ports display in the selected logical switch node in the Existing Logical Switches list. 8. Click OK on the Logical Switches dialog box. The Logical Switch Change Confirmation and Status dialog box displays with a list of all changes you made in the Logical Switches dialog box.
Configuring Virtual Fabrics 7. 19 Click OK on the Logical Switches dialog box. The Logical Switch Change Confirmation and Status dialog box displays with a list of all changes you made in the Logical Switches dialog box. The Re-Enable ports after moving them and QoS disable the ports while moving them check boxes are selected by default. NOTE Ports are disabled before moving from one logical switch to another. 8. (Optional) Select the Unbind Port Addresses while moving them check box. 9.
19 Configuring Virtual Fabrics Configuring fabric-wide parameters for a logical fabric When you create a logical switch, you must assign it to a fabric and configure fabric-wide parameters. All the switches in a fabric must have the same fabric-wide settings. Instead of configuring these settings separately on each logical switch, you can create a logical fabric template, which defines the fabric-wide settings for a logical fabric.
Configuring Virtual Fabrics 19 NOTE When you close the Logical Switches dialog box, the logical fabric templates are automatically deleted. Create the logical switches first, before closing the dialog box, to use the template. Applying logical fabric settings to all associated logical switches You can apply a selected logical switch configuration to all logical switches in the same fabric. This configures the fabric parameters for the selected logical switch to all logical switches in the fabric. 1.
19 Configuring Virtual Fabrics 5. Change the FID in the Logical Fabric ID field. 6. Click OK on the Edit Properties dialog box. The logical switch displays under the new logical fabric node in the Existing Logical Switches list. 7. Click OK on the Logical Switches dialog box. The Logical Switch Change Confirmation and Status dialog box displays with a list of all changes you made in the Logical Switches dialog box.
Configuring Virtual Fabrics 7. 19 Click OK on the Edit Properties dialog box. The Base Switch column in the Existing Logical Switches list now displays Yes for the logical switch. 8. Click OK on the Logical Switches dialog box. The Logical Switch Change Confirmation and Status dialog box displays with a list of all changes you made in the Logical Switches dialog box. The Re-Enable ports after moving them and QoS disable the ports while moving them check boxes are selected by default.
19 692 Configuring Virtual Fabrics Brocade Network Advisor SAN User Manual 53-1003154-01
Chapter 20 SAN Encryption Configuration In this chapter • Encryption Center features . . . . . . . . . . . . . . . . . . . . . . . . . . . . . . . . . . . . . . • Encryption user privileges. . . . . . . . . . . . . . . . . . . . . . . . . . . . . . . . . . . . . . . • Smart card usage . . . . . . . . . . . . . . . . . . . . . . . . . . . . . . . . . . . . . . . . . . . . . • Network connections. . . . . . . . . . . . . . . . . . . . . . . . . . . . . . . . . . . . . . . . . . . • Blade processor links .
20 Encryption Center features • Using the Encryption Targets dialog box . . . . . . . . . . . . . . . . . . . . . . . . . . . • Redirection zones . . . . . . . . . . . . . . . . . . . . . . . . . . . . . . . . . . . . . . . . . . . . . • Disk device decommissioning . . . . . . . . . . . . . . . . . . . . . . . . . . . . . . . . . . . • Rekeying all disk LUNs manually . . . . . . . . . . . . . . . . . . . . . . . . . . . . . . . . . • Thin provisioned LUNs. . . . . . . . . . . . . . . . . . . . . . . . . .
Encryption user privileges 20 • “Blade processor links” on page 707 describes the steps for interconnecting encryption switches or blades in an encryption group through a dedicated LAN. This must be done before the encryption engines are enabled. Security parameters and certificates cannot be exchanged if these links are not configured and active.
20 Smart card usage TABLE 66 Encryption privileges (Continued) Privilege Read/Write Storage Encryption Security • • • • • • • • • • • • Launch the Encryption center dialog box. View switch, group, or engine properties. View Encryption Group Properties Security tab. View LUN centric view. View all rekey sessions. View encryption targets, hosts, and LUNs. Create a master key. Backup a master key. Edit smart card.
Smart card usage 20 • Establishing a trusted link with the NetApp LKM/SSKM key vault. • Decommissioning a LUN. When a quorum of authentication cards is registered for use, authentication must be provided before you are granted access. Registering authentication cards from a card reader To register an authentication card or a set of authentication cards from a card reader, have the cards physically available.
20 Smart card usage 3. Locate the Authentication Card Quorum Size and select the quorum size from the list. The quorum size is the minimum number of cards necessary to enable the card holders to perform the security sensitive operations listed above. The maximum quorum size is five cards. The actual number of authentication cards registered is always more than the quorum size, so if you set the quorum size to five, for example, you will need to register at least six cards in the subsequent steps.
Smart card usage 20 Registering authentication cards from the database Smart cards that are already in the Management program’s database can be registered as authentication cards. 1. Select Configure > Encryption from the menu task bar to display the Encryption Center dialog box. (Refer to Figure 266 on page 694.) 2. Select an encryption group from the Encryption Center Devices table, then select Group > Security from the menu task bar to display the Encryption Group Properties dialog box.
20 Smart card usage Deregistering an authentication card Authentication cards can be removed from the database and the switch by deregistering them. Complete the following procedure to deregister an authentication card. 1. Select Configure > Encryption from the menu task bar to display the Encryption Center dialog box. (Refer to Figure 266 on page 694.) 2.
Smart card usage 20 Using system cards System cards are smart cards that can be used to control activation of encryption engines. You can choose whether the use of a system card is required or not. Encryption switches and blades have a card reader that enables the use of a system card. System cards discourage theft of encryption switches or blades by requiring the use of a system card at the switch or blade to enable the encryption engine after a power off.
20 Smart card usage Enabling or disabling the system card requirement To use a system card to control activation of an encryption engine on a switch, you must enable the system card requirement. If a system card is required, it must be read by the card reader on the switch. You access the system card GUI from the Security tab. Complete the following procedure to enable or disable the system card requirement. 1.
Smart card usage 20 Deregistering system cards System cards can be removed from the database by deregistering them. Use the following procedure to deregister a system card: 1. Select Configure > Encryption from the menu task bar to display the Encryption Center dialog box. (Refer to Figure 266 on page 694.) 2. Select the switch from the Encryption Center Devices table, then select Switch > System Cards from the menu task bar. The System Cards dialog box displays. (Refer to Figure 271 on page 701.) 3.
20 Smart card usage FIGURE 272 Smart Card Asset Tracking dialog box The Smart Cards table lists the known smart cards and the details for the smart cards. These details include the following: • Card ID: Lists the smart card ID, prefixed with an ID that identifies how the card id used. For example, rc.123566b700017818, where rc stands for recovery card. • Card Type: Options are: System card, Authentication card, and Recovery set. • Usage: Usage content varies based on the card type.
Smart card usage 20 • Delete button: Deletes a selected smart card from the Management application database. NOTE You can remove smart cards from the table to keep the Smart Cards table at a manageable size, but removing the card from the table does not invalidate it; the smart card can still be used. • Save As button: Saves the entire list of smart cards to a file. The available formats are comma-separated values (.csv) and HTML (.html). • Card Details table: Card details vary based on the card type.
20 Smart card usage Editing smart cards Smart cards can be used for user authentication, master key storage and backup, and as a system card for authorizing use of encryption operations. 1. From the Encryption Center dialog box, select Smart Card > Edit Smart Card from the menu task bar to display the Edit Smart Card dialog box. (Refer to Figure 273.) FIGURE 273 Edit Smart Card dialog box 2. Insert the smart card into the card reader. 3.
Network connections 20 Network connections Before you use the encryption setup wizard for the first time, you must have the following required network connections: • The management ports on all encryption switches and DCX Backbone Chassis CPs that have Encryption Blades installed must have a LAN connection to the SAN management program, and must be available for discovery.
20 Encryption node initialization and certificate generation Configuring blade processor links To configure blade processor links, complete the following steps: 1. Select Configure > Encryption from the menu task bar to display the Encryption Center dialog box. (Refer to Figure 266 on page 694.) 2. Select the encryption engine from the Encryption Center Devices table, then select Engine > Blade Processor Link from the menu task bar to display the Blade Processor Link dialog box. (Refer to Figure 274.
Key Management Interoperability Protocol 20 Setting encryption node initialization Encryption nodes are initialized by the Configure Switch Encryption wizard when you confirm a configuration. Encryption nodes may also be initialized from the Encryption Center dialog box. 1. Select a switch from the Encryption Center Devices table, then select Switch > Init Node from the menu task bar. 2. Select Yes after reading the warning message to initialize the node.
20 Key Management Interoperability Protocol Configuration parameters The encryption group object has three additional properties that can be configured when the key vault (KV) type is KMIP. These additional properties must be set by the user: • High availability • User credentials • Certificate type High availability The KMIP Key Authentication Center (KAC) adapter provides configurable HA support. HA for the key vault should be set before you register the key vault.
Key Management Interoperability Protocol 20 Key vault type and vendor The key vault type for any KMIP-compliant key vault is shown on the switch as “KMIP” in the groupcfg output. The key vault vendor or key manager name is displayed under “Server SDK Version”.
20 Supported encryption key manager appliances Authentication Quorum Size: 0 Authentication Cards not configured NODE LIST Total Number of defined nodes: Group Leader Node Name: Encryption Group state: Crypto Device Config state: Encryption Group Config state: 2 10:00:00:05:1e:53:ae:4c CLUSTER_STATE_CONVERGED In Sync In Sync Node Name 10:00:00:05:1e:b6:68:80 EE Slot: SP state: IP address 10.37.36.128 10:00:00:05:1e:53:ae:4c EE Slot: SP state: 10.37.39.
Steps for connecting to a DPM appliance 20 Steps for connecting to a DPM appliance All switches that you plan to include in an encryption group must have a secure connection to the RSA Data Protection Manager (DPM). The following is a suggested order of steps needed to create a secure connection to the DPM. NOTE The switch uses the manual enrollment of identities with client registration to connect with DPM 3.x servers. Client registration is done automatically when you upgrade to Fabric OS 7.1.
20 Steps for connecting to a DPM appliance 4. Do one of the following: • If a CSR is present, click Export. • If a CSR is not present, select a switch from the Encryption Center Devices table, then select Switch > Init Node from the menu task bar. This generates switch security parameters and certificates, including the KAC CSR. 5. Save the file. The default location for the exported file is in the Documents folder. NOTE The CSR is exported in Privacy Enhanced Mail (.pem) format.
Steps for connecting to a DPM appliance 20 In the example above, the certificate validity is active until “Dec 4 18:03:14 2010 GMT.” After the KAC certificate has expired, the registration process must be redone. NOTE In the event that the signed KAC certificate must be re-registered, you will need to log in to the key vault web interface and upload the new signed KAC certificate for the corresponding switch Identity.
20 Steps for connecting to a DPM appliance 7. Open another web browser window, and start the RSA management user interface. You will need the URL, and have the proper authority level, user name, and password. NOTE The Identity Group name used in the next step might not exist in a freshly installed DPM. To establish an Identity Group name, click the Identity Group tab, and create a name. The name Hardware Retail Group is used as an example in the following steps. 8. Select the Key Classes tab.
Steps for connecting to a DPM appliance 20 Uploading the KAC certificate onto the DPM appliance (manual identity enrollment) NOTE The switch will not use the Identity Auto Enrollment feature supported with DPM 3.x servers. You must complete the identity enrollment manually to configure the DPM 3.x server with the switch as described in this section. You need to install the switch public key certificate (KAC certificate). For each encryption node, manually create an identity as follows: 1.
20 Steps for connecting to an LKM/SSKM appliance . FIGURE 276 Encryption Group Properties with Key Vault Certificate 2. Select Load from File and browse to the location on your client PC that contains the downloaded CA certificate in .pem format. Steps for connecting to an LKM/SSKM appliance The NetApp Lifetime Key Manager (LKM) resides on an FIPS 140-2 Level 3-compliant network appliance. The encryption engine and LKM appliance communicate over a trusted link.
Steps for connecting to an LKM/SSKM appliance 20 Launching the NetApp DataFort Management Console The NetApp DataFort Management Console (DMC) must be installed on your PC or workstation to complete certain procedures described in this chapter. Refer to the appropriate DMC product documentation for DMC installation instructions. After you install the DMC, complete the following steps: 1. Launch the DMC. 2. Click the Appliance tab on the top panel. 3.
20 Steps for connecting to an LKM/SSKM appliance Obtaining and importing the LKM/SSKM certificate Certificates must be exchanged between the LKM/SSKM appliance and the encryption switch to enable mutual authentication. You must obtain a certificate from the LKM/SSKM appliance and import it into the encryption Group Leader. The encryption Group Leader exports the certificate to other encryption group members. To obtain and import an LKM/SSKM certificate, complete the following steps: 1.
Steps for connecting to an LKM/SSKM appliance 20 Exporting and registering the switch KAC certificates on LKM/SSKM 1. Select Configure > Encryption from the menu task bar to display the Encryption Center dialog box. (Refer to Figure 266 on page 694.) 2. Select a switch from the Encryption Center Devices table, then select Switch > Export Certificate from the menu task bar.
20 Steps for connecting to an LKM/SSKM appliance Data Encryption Keys The following sections describe Data Encryption Key (DEK) behavior during DEK creation, retrieval, and updates as they relate to disk keys and tape pool keys, and tape LUN and DF-compatible tape pool support: Disk keys and tape pool keys (Brocade native mode support) Data Encryption Key (DEK) creation, retrieval, and update for disk and tape pool keys in Brocade native mode are as follows: • DEK creation: The DEK is archived into the
Steps for connecting to an ESKM/SKM appliance 20 LKM/SSKM key vault deregistration Deregistration of either the primary or secondary LKM/SSKM key vault from an encryption switch or blade is allowed independently. • Deregistration of Primary LKM/SSKM: You can deregister the Primary LKM/SSKM from an encryption switch or blade without deregistering the backup or secondary LKM/SSKM for maintenance or replacement purposes.
20 Steps for connecting to an ESKM/SKM appliance • Enable an SSL connection. Refer to “Enabling SSL on the Key Management System (KMS) Server” on page 729. • Configure a cluster of ESKM/SKM appliances for high availability.
Steps for connecting to an ESKM/SKM appliance 20 Registering the ESKM/SKM Brocade group user name and password The Brocade group user name and password you created when configuring a Brocade group on ESKM/SKM must also be registered on each encryption node. NOTE This operation can be performed only after the switch is added to the encryption group. 1. Select Configure > Encryption from the menu task bar to display the Encryption Center dialog box. (Refer to Figure 266 on page 694.) 2.
20 Steps for connecting to an ESKM/SKM appliance • Different user names and passwords can never be used within the same encryption group, but each encryption group may have its own user name and password. • If you change the user name and password, the keys created by the previous user become inaccessible. The Brocade group user name and password must also be changed to the same values on ESKM/SKM to make the keys accessible.
Steps for connecting to an ESKM/SKM appliance 20 FIGURE 279 Creating an HP ESKM/SKM local CA 5. Under Certificates & CAs, select Trusted CA Lists to display the Trusted Certificate Authority List Profiles. 6. Click on Default under Profile Name. 7. In the Trusted Certificate Authority List, click Edit. 8. From the list of Available CAs in the right panel, select the CA you just created. Repeat these steps any time another local CA is needed.
20 Steps for connecting to an ESKM/SKM appliance 3. Enter the required information under Create Certificate Request. - Enter a Certificate Name and Common Name. The same name may be used for both. Enter your organizational information. Enter the E-mail Address where you want messages to the Security Officer to go. Enter the Key Size. HP recommends using the default value: 1024. 4. Click Create Certificate Request.
Steps for connecting to an ESKM/SKM appliance 20 Enabling SSL on the Key Management System (KMS) Server The KMS Server provides the interface to the client. Secure Sockets Layer (SSL) must be enabled on the KMS Server before this interface will operate. After SSL is enabled on the first appliance, it will be enabled automatically on the other cluster members. To configure and enable SSL, complete the following steps: 1. Select the Device tab. 2.
20 Steps for connecting to an ESKM/SKM appliance Copying the local CA certificate for a clustered ESKM/SKM appliance Before adding an ESKM/SKM appliance to a cluster, you must obtain the local CA certificate from the original ESKM/SKM or from an ESKM/SKM that is already in the cluster. 1. Select the Security tab. 2. Select Local CAs under Certificates & CAs. 3. Select the name of the local CA from the Local Certificate Authority list. The CA Certificate Information is displayed. 4.
Steps for connecting to an ESKM/SKM appliance 20 15. Click Browse, then select the Cluster Key File you saved. 16. Enter the cluster password, then click Join. 17. After adding all members to the cluster, delete the cluster key file from the desktop. 18. Create and install an ESKM/SKM server certificate. Refer to “Creating and installing the ESKM/SKM server certificate” on page 727 for a description of this procedure.
20 Steps for connecting to an ESKM/SKM appliance Importing a signed KAC certificate into a switch After a KAC CSR has been submitted and signed by a CA, the signed certificate must be imported into the switch. NOTE This operation can be performed only after the switch is added to the encryption group. 1. Select Configure > Encryption from the menu task bar to display the Encryption Center dialog box. (Refer to Figure 266 on page 694.) 1.
Steps for connecting to an ESKM/SKM appliance 20 Data Encryption Keys The following sections describe Data Encryption Key (DEK) behavior during DEK creation, retrieval, and updates as they relate to disk keys and tape pool keys, and tape LUN and DF-compatible tape pool support: Disk keys and tape pool keys support Data Encryption Key (DEK) creation, retrieval, and update for disk and tape pool keys are as follows: • DEK creation: The DEK is first archived using the session list available for the configu
20 Steps for connecting to a TEKA appliance ESKM/SKM key vault deregistration Deregistration of either the primary or secondary ESKM/SKM key vault from an encryption switch or blade is allowed independently. • Deregistration of primary ESKM: You can deregister the primary ESKM/SKM from an encryption switch or blade without deregistering the backup or secondary ESKM/SKM for maintenance or replacement purposes.
Steps for connecting to a TEKA appliance 20 Setting up TEKA network connections Communicating to TEKA is enabled over an SSL connection. Two IP addresses are needed. One IP address is used for the management interface, and a second IP address is used for communication with clients. These IP addresses are typically assigned during the initial setup of the TEKA appliance. 1. Log in to the Thales management program as admin and select the Network tab. (Refer to Figure 281.
20 Steps for connecting to a TEKA appliance Creating a client on TEKA This step assumes the group brocade has been created by an administrator. If the group brocade does not exist, you must log in to TEKA as officer and create the group, then assign the group to a manager. 1. From the Encryption Center Devices table, select a switch that needs to have a TEKA client, then select Properties. 2. Click Key Vault User Name. The Key Vault User Information dialog box displays. (Refer to Figure 282.
Steps for connecting to a TEKA appliance 20 6. Click Add Client. 7. Enter the user name from step 3 in the Name field. 8. Enter a password in the Password and Verify Password fields. 9. Select the group brocade from the group pull-down menu, then click Add Client. A TEKA client user is created and is listed in the table. Establishing TEKA key vault credentials on the switch The credentials established for the TEKA client must be presented to TEKA by the switch.
20 Steps for connecting to a TEKA appliance The following rules apply for TEKA: • The key vault user name and user group name are generated on the switch. To view those values, select Switch > Properties, then click Key Vault User Name. • The generated user name and user group name are registered with TEKA and are used for administering TEKA clients. • The password is established when the TEKA client is created.
Steps for connecting to a TKLM appliance 20 FIGURE 285 Import Signed Certificate dialog box 2. Browse to the location where the signed certificate is stored, then click OK. The signed certificate is stored on the switch. Steps for connecting to a TKLM appliance All switches you plan to include in an encryption group must have a secure connection to the Tivoli Key Lifecycle Manager (TKLM). A local LINUX host must be available to transfer certificates.
20 Steps for connecting to a TKLM appliance 11. Import the server CA certificate and register TKLM on the encryption Group Leader nodes. Refer to “Importing the TKLM certificate into the group leader” on page 742. 12. Enable the encryption engines. Exporting the Fabric OS node self-signed KAC certificates Each Fabric OS node generates a self-signed KAC certificate as part of the node initialization process as described under “Encryption node initialization and certificate generation”.
Steps for connecting to a TKLM appliance 20 3. Click Add on the Devices table menu task bar, which adds the entry to the table. 4. Under Device Serial Number, enter the serial number that is displayed for each node that you are adding to the device group. Creating a self-signed certificate for TKLM You must create a self-signed certificate for TKLM that can be downloaded to the Fabric OS encryption engines to verify the authenticity of TKLM. 1. Select Tivoli Key Lifecycle Manager > Configuration.
20 Steps for connecting to a TKLM appliance Exporting the TKLM self-signed server certificate The TKLM self-signed server certificate must be exported in preparation for importing and registering the certificate on a Fabric OS encryption Group Leader node. 1. Enter the TKLM server wsadmin CLI. For Linux (in ./wsadmin.sh): /IBM/tivoli/tiptklmV2/bin/wsadmin.sh -username TKLMAdmin -password -lang jython For Windows: \ibm\tivoli\tiptklmV2\bin\wsadmin.
Steps for connecting to a KMIP-compliant SafeNet KeySecure 20 FIGURE 286 Import Signed Certificate dialog box 3. Browse to the location where the signed certificate is stored, then click OK. The signed certificate is stored on the switch. Steps for connecting to a KMIP-compliant SafeNet KeySecure With the introduction of Fabric OS 7.1.0, the Key Management Interoperability Protocol (KMIP) KeySecure Management Console can be used on the switch.
20 Steps for connecting to a KMIP-compliant SafeNet KeySecure Setting FIPS compliance 1. From the KeySecure Management Console, select the Security tab, then select Advanced Security, > High Security. The High Security Configuration page displays. (Refer to Figure 287.) FIGURE 287 KeySecure High Security Configuration page 2. Under FIPS Compliance, set FIPS Compliance to Yes. This ensures that only TLS 1.0 connections are supported between the switch and the KeySecure.
Steps for connecting to a KMIP-compliant SafeNet KeySecure 20 Creating a local CA 1. From the KeySecure Management Console, select the Security tab, then select CAs & SSL Certificates > Local CAs. The Certificate and CA Configuration page displays. (Refer to Figure 288.) FIGURE 288 KeySecure Certificate and CA Configuration page - Create Local Certificate Authority 2. Under Create Local Certificate Authority, enter the organization information in the fields provided, then click Create.
20 Steps for connecting to a KMIP-compliant SafeNet KeySecure Creating a server certificate 1. From the Security tab, select CAs & SSL Certificates > SSL Certificates. The Certificate and CA Configuration page displays. (Refer to Figure 290.) FIGURE 290 KeySecure Certificate and CA Configuration page 2. Under Create Certificate Request, enter your organization information in the fields provided, then click Create Certificate Request.
Steps for connecting to a KMIP-compliant SafeNet KeySecure 20 FIGURE 291 KeySecure Certificate and CA Configuration page - Certificate List 3. Verify the server certificate status is shown as Request Pending. 4. Click on the server certificate name that you just created (Safenet75ServerCert), which displays the certificate contents. (Refer to Figure 292.
20 Steps for connecting to a KMIP-compliant SafeNet KeySecure 5. Copy the certificate contents. 6. From the Security tab, select CAs & SSL Certificates > Local CAs. The Certificate and CA Configuration page displays. 7. Under Local Certificate Authority List, select the CA certificate you just created (SafeNetCA), then click Sign Request. (Refer to Figure 293.) FIGURE 293 KeySecure Certificate and CA Configuration page - Local Certificate Authority List The Sign Certificate Request dialog box displays.
Steps for connecting to a KMIP-compliant SafeNet KeySecure 20 8. Select Server as the Certificate Purpose and verify the Certificate Duration length. The default is 3649 days. 9. Paste the server certificate contents that you copied (refer to step 5) in the Certificate Request text box, then click Sign Request. The Certificate and CA Configuration page refreshes and the certificate information is displayed under Certificate Request Information. (Refer to Figure 295.
20 Steps for connecting to a KMIP-compliant SafeNet KeySecure FIGURE 296 KeySecure Certificate and CA Configuration page - Certificate Installation 14. After the page refreshes, the new certificate information is displayed in the Certificate List table. (Refer to Figure 297.) FIGURE 297 KeySecure Certificate and CA Configuration page - Certificate List 15. Verify the server certificate status is shown as Active.
Steps for connecting to a KMIP-compliant SafeNet KeySecure 20 Creating a cluster 1. From the KeySecure Management Console, select the Device tab, then select Device Configuration > Cluster. The Cluster Configuration page displays. (Refer to Figure 298.) FIGURE 298 KeySecure Cluster Configuration page 2. Under Create Cluster, enter a user-defined password in the fields provided, then click Create. The Cluster Configuration page refreshes; the new cluster information is listed in the Cluster Members table.
20 Steps for connecting to a KMIP-compliant SafeNet KeySecure FIGURE 299 KeySecure Cluster Configuration page - Cluster Members 4. Under Cluster Settings, click Download Cluster Key. (Refer to Figure 300.) You are prompted to enter a local file name. FIGURE 300 KeySecure Cluster Configuration page - Cluster Settings Configuring a Brocade group on the KeySecure A Brocade group is configured on the KeySecure for all keys created by encryption switches and blades.
Steps for connecting to a KMIP-compliant SafeNet KeySecure 20 3. Select Local Users & Groups under Users & Groups. 4. Select Add under Local Users. 5. Create a Brocade user name and password. 6. Select the User Administration Permission and Change Password Permission check boxes, then click Save. 7. Select Add under Local Groups. 8. Add a Brocade group under Group, then click Save. 9. Select the new Brocade group name, then select Properties. The Local Group Properties and a User List are displayed.
20 Steps for connecting to a KMIP-compliant SafeNet KeySecure FIGURE 302 Key Vault Credentials dialog box The dialog box contains the following information: • Primary Key Vault: Primary Key Vault is preselected. KMIP key vaults are clustered, so only one set of credentials is needed. • • • • • Secondary Key Vault: (TEKA key vault only). Shown as inactive. User Name: Enter a user name for the group leader. User Group Name: Displays the selected User Group Name.
Steps for connecting to a KMIP-compliant SafeNet KeySecure 20 6. The Certificate and CA Configuration page displays. 7. Under Local Certificate Authority List, select the local CA name, and verify that its CA Status is shown as Active. 8. Click Sign Request. The Sign Certificate Request page displays. (Refer to Figure 303.) FIGURE 303 Certificate and CA Configuration page - Sign Certificate Request 9. Select the local CA from the Sign with Certificate Authority drop-down list.
20 Steps for connecting to a KMIP-compliant SafeNet KeySecure Importing a signed KAC certificate into a switch After a KAC CSR has been submitted and signed by a CA, the signed certificate must be imported into the switch. NOTE This operation can be performed only after the switch is added to the encryption group. 1. Select Configure > Encryption from the menu task bar to display the Encryption Center dialog box. (Refer to Figure 266 on page 694.) 2.
Steps for connecting to a KMIP-compliant SafeNet KeySecure 20 Backing up the certificates 1. From the KeySecure Management Console, select the Device tab, then select Maintenance > Backup & Restore > Create Backup. The Backup and Restore page displays. (Refer to Figure 305.) FIGURE 305 Backup and Restore page 2. Select the server certificate from the list. The example is using Safenet75ServerReq. 3. Select the local CA from the list. The example is using SafeNetCA. 4.
20 Steps for connecting to a KMIP-compliant SafeNet KeySecure FIGURE 306 Backup and Restore page - Device items 5. Select the items for backup, then click Continue. The Create Backup page displays, which is used for setting backup details. (Refer to Figure 307.) FIGURE 307 Backup and Restore page - Backup details 6. Enter backup details in the fields provided, then click Backup to initiate the backup process. 7. 758 Restore this backup file on the Secondary clustered KeySecure server.
Steps for connecting to a KMIP-compliant SafeNet KeySecure 20 Configuring the KMIP server 1. From the KeySecure Management Console, select the Device tab, then select Device Configuration > Key Server > Key Server. The Cryptographic Key Server Configuration page displays. (Refer to Figure 308.) FIGURE 308 KeySecure Cryptographic Key Server Configuration page 2. Under Cryptographic Key Server Settings, select KMIP as the protocol. 3. Ensure that the Use SSL check box is selected. 4.
20 Steps for connecting to a KMIP-compliant SafeNet KeySecure Adding a node to the cluster Perform the following steps on the secondary KeySecure node when adding it to the cluster. 1. From the KeySecure Management Console, select the Device tab, then select Device Configuration > Cluster. The Cluster Configuration page displays. (Refer to Figure 309.) FIGURE 309 KeySecure Cluster Configuration page 2. Under Join Cluster, enter the cluster information that you configured for the primary KeySecure node.
Steps for connecting to a KMIP-compliant SafeNet KeySecure 20 FIGURE 310 KeySecure Cluster Configuration page - Cluster Members 6. Verify that both KeySecure nodes are shown as Active. 7. From the Devices tab, select Maintenance > Backup and Restore > Restore Backup. The Backup and Restore page displays. (Refer to Figure 311.
20 Steps for connecting to a KMIP-compliant keyAuthority 8. Under Restore Backup, select Upload from browser, then enter a file name or browse to the file location. 9. Enter the Backup Password in the field provided, then click Restore. 10. After the certificate is restored to the secondary node from the previously backed-up primary node, select Maintenance > Services. The Services Configuration page displays. (Refer to Figure 312.
Encryption preparation 20 Encryption preparation Before you use the encryption setup wizard for the first time, you should have a detailed configuration plan in place and available for reference. The encryption setup wizard assumes the following: • You have a plan in place to organize encryption devices into encryption groups.
20 Creating a new encryption group Creating a new encryption group The following steps describe how to start and run the encryption setup wizard and create a new encryption group. NOTE When a new encryption group is created, any existing tape pools in the switch are removed. 1. Select Configure > Encryption from the menu task bar to display the Encryption Center dialog box. (Refer to Figure 313.) FIGURE 313 Encryption Center dialog box - No group defined 2.
Creating a new encryption group 20 FIGURE 314 Configure Switch Encryption wizard - welcome screen 4. From the Configure Switch Encryption welcome screen, click Next to begin. The Designate Switch Membership dialog box displays (Figure 315).
20 Creating a new encryption group 5. For this procedure, verify that Create a new encryption group containing just this switch is selected, then click Next. NOTE If you are adding a switch to an encryption, refer to “Adding a switch to an encryption group” on page 801. The Create a New Encryption Group dialog box displays. (Refer to Figure 316.
Creating a new encryption group 7. 20 Click Next. The Select Key Vault. dialog box displays. (Refer to Figure 317.) FIGURE 317 Select Key Vault dialog box Using this dialog box, you can select a key vault for the encryption group that contains the selected switch. Prior to selecting your Key Vault Type, the selection is shown as None.
20 Creating a new encryption group - Thales e-Security keyAuthority (TEKA): If an encryption group contains mixed firmware nodes, the Encryption Group Properties Key Vault Type name is based on the firmware version of the Group Leader. For example, If a switch is running Fabric OS 7.1.0 or later, the Key Vault Type is displayed as “Thales e-Security keyAuthority (TEKA).”If a switch is running a Fabric OS version prior to v7.1.0, Key Vault Type is displayed as “Thales Key Manager (TEMS)”.
Creating a new encryption group 20 8. Select the Key Vault Type. Configuration options vary based on the key vault type you choose. To complete the wizard steps, proceed to the section that describes your particular key vault type. - For DPM key vault setting instructions, see “Configuring key vault settings for RSA Data Protection Manager (DPM)” on page 769. - For LKM/SSKM key vault setting instructions, see “Configuring key vault settings for NetApp Link Key Manager (LKM/SSKM)” on page 774.
20 Creating a new encryption group 1. Enter the IP address or host name for the primary key vault. If you are clustering DPM appliances for high availability, IP load balancers are used to direct traffic to the appliances. Use the IP address of the load balancer. 2. Enter the name of the file that holds the Primary Key Vault’s CA Key Certificate or browse to the desired location. This file can be generated from the key vault’s administrative console. 3.
Creating a new encryption group 20 FIGURE 320 Specify Master Key File Name dialog box 7. Enter the location of the file where you want to store back up master key information, or browse to the desired location. 8. Enter the passphrase, which is required for restoring the master key. The passphrase can be between eight and 40 characters, and any character is allowed. 9. Re-enter the passphrase for verification, then click Next. The Select Security Settings dialog box displays. (Refer to Figure 321.
20 Creating a new encryption group FIGURE 321 Select Security Settings dialog box 10. Set quorum size and system card requirements. The quorum size is the minimum number of cards necessary to enable the card holders to perform the security sensitive operations listed above. The maximum quorum size is five cards.
Creating a new encryption group 20 FIGURE 322 Confirm Configuration dialog box The Configuration Status dialog box displays. (Refer to Figure 323.) FIGURE 323 Configuration Status dialog box 12. Review the post-configuration instructions, which you can copy to a clipboard or print for later, then click Next. The Next Steps dialog box displays. (Refer to Figure 324.) Instructions for installing public key certificates for the encryption switch are displayed.
20 Creating a new encryption group FIGURE 324 Next Steps dialog box 13. Review the post-configuration instructions, which you can copy to a clipboard or print for later, then click Finish to exit the wizard. Configuring key vault settings for NetApp Link Key Manager (LKM/SSKM) The following procedure assumes you have already configured the initial steps in the Configure Switch Encryption wizard. If you have not already done so, go to “Creating a new encryption group” on page 764.
Creating a new encryption group 20 FIGURE 325 Select Key Vault dialog box for LKM/SSKM 1. Enter the IP address or host name for the primary key vault. 2. Enter the name of the file that holds the primary key vault’s public key certificate, or browse to the desired location. 3. If you are using a backup key vault, enter the IP address or host name, and the name of the file holding the backup key vault’s public key certificate, then click Next.
20 Creating a new encryption group FIGURE 326 Specify Public Key Certificate (KAC) File Name dialog box 4. Specify the location of the file where you want to store the public key certificate that is used to authenticate connections to the key vault. The certificate stored in this file is the switch’s public key certificate. You will need to know this path and file name to install the switch’s public key certificate on the key management appliance. 5. Click Next.
Creating a new encryption group 20 FIGURE 327 Select Security Settings dialog box 6. Set quorum size and system card requirements. The quorum size is the minimum number of cards necessary to enable the card holders to perform the security sensitive operations listed above. The maximum quorum size is five cards.
20 Creating a new encryption group FIGURE 328 Confirm Configuration dialog box The Configuration Status dialog box displays. (Refer to Figure 329.) FIGURE 329 Configuration Status dialog box All configuration items have green check marks if the configuration is successful. A red stop sign indicates a failed step. A message displays below the table, indicating the encryption switch was added to the group you named, and the public key certificate is stored in the location you specified.
Creating a new encryption group 20 After configuration of the encryption group is completed, the Management application sends API commands to verify the switch configuration. See “Understanding configuration status results” on page 800 for more information. 8. Verify the information is correct, then click Next. The Next Steps dialog box displays. (Refer to Figure 330.) Instructions for installing public key certificates for the encryption switch are displayed.
20 Creating a new encryption group Configuring key vault settings for HP Enterprise Secure Key Manager (ESKM/SKM) The following procedure assumes you have already configured the initial steps in the Configure Switch Encryption wizard. If you have not already done so, go to “Creating a new encryption group” on page 764. Figure 331 shows the key vault selection dialog box for ESKM/SKM. FIGURE 331 Select Key Vault dialog box for ESKM/SKM 1. Enter the IP address or host name for the primary key vault. 2.
Creating a new encryption group 20 FIGURE 332 Specify Certificate Signing Request File Name dialog box 6. Enter the location of the file where you want to store the certificate information, or browse to the desired location, then click Next. The Specify Master Key File Name dialog box displays. (Refer to Figure 333.) FIGURE 333 Specify Master Key File Name dialog box 7. Enter the passphrase, which is required for restoring the master key.
20 Creating a new encryption group 8. Re-enter the passphrase for verification, then click Next. The Select Security Settings dialog box displays. (Refer to Figure 334.) FIGURE 334 Select Security Settings dialog box 9. Set quorum size and system card requirements. The quorum size is the minimum number of cards necessary to enable the card holders to perform the security sensitive operations listed above. The maximum quorum size is five cards.
Creating a new encryption group 20 FIGURE 335 Confirm Configuration dialog box The Configuration Status dialog box displays. (Refer to Figure 336.) FIGURE 336 Configuration Status dialog box All configuration items have green check marks if the configuration is successful. A red stop sign indicates a failed step. A message displays below the table, indicating the encryption switch was added to the group you named, and the public key certificate is stored in the location you specified.
20 Creating a new encryption group After configuration of the encryption group is completed, the Management application sends API commands to verify the switch configuration. See “Understanding configuration status results” on page 800 for more information. 11. Review important messages, then click Next. The Next Steps dialog box displays. (Refer to Figure 337.) Instructions for installing public key certificates for the encryption switch are displayed. FIGURE 337 Next Steps dialog box 12.
Creating a new encryption group 20 FIGURE 338 Select Key Vault dialog box for TEKA 1. Enter the IP address or host name for the primary key vault. 2. Enter the name of the file that holds the primary key vault’s public key certificate, or browse to the desired location. 3. Enter the password you created for the Brocade group TEKA client. 4.
20 Creating a new encryption group FIGURE 339 Specify Master Key File Name dialog box 6. Enter the name of the file used for backing up the master key or browse to the desired location. 7. Enter the passphrase, which is required for restoring the master key. The passphrase can be between eight and 40 characters, and any character is allowed. 8. Re-enter the passphrase for verification, then click Next. The Select Security Settings dialog box displays. (Refer to Figure 340.
Creating a new encryption group 20 9. Set quorum size and system card requirements. The quorum size is the minimum number of cards necessary to enable the card holders to perform the security sensitive operations listed above. The maximum quorum size is five cards. The actual number of authentication cards registered is always more than the quorum size, so if you set the quorum size to five, for example, you will need to register at least six cards in the subsequent steps.
20 Creating a new encryption group FIGURE 342 Configuration Status dialog box All configuration items have green check marks if the configuration is successful. A red stop sign indicates a failed step. A message displays below the table, indicating the encryption switch was added to the group you named, and the public key certificate is stored in the location you specified.
Creating a new encryption group 20 FIGURE 343 Next Steps dialog box 12. Review the post-configuration instructions, which you can copy to a clipboard or print for later. 13. Click Finish to exit the Configure Switch Encryption wizard. 14. Refer to “Understanding configuration status results” on page 800. Configuring key vault settings for IBM Tivoli Key Lifetime Manager (TKLM) The following procedure assumes you have already configured the initial steps in the Configure Switch Encryption wizard.
20 Creating a new encryption group FIGURE 344 Select Key Vault dialog box for TKLM 1. Enter the IP address or host name for the primary key vault. 2. Enter the name of the file that holds the primary key vault’s public key certificate or browse to the desired location. 3. If you are using a backup key vault, enter the IP address or host name, and the name of the file holding the backup key vault’s public key certificate in the fields provided. 4. Click Next.
Creating a new encryption group 20 FIGURE 345 Specify Public Key Certificate (KAC) File Name dialog box 5. Enter the name of the file where the switch’s public key certificate is stored, or browse to the desired location, then click Next. The Specify Master Key File Name dialog box displays. (Refer to Figure 346.) FIGURE 346 Specify Master Key File Name dialog box 6. Enter the name of the file used for backing up the master key, or browse to the desired location.
20 Creating a new encryption group 7. Enter the passphrase, which is required for restoring the master key. The passphrase can be between eight and 40 characters, and any character is allowed. 8. Re-enter the passphrase for verification, then click Next. The Select Security Settings dialog box displays. (Refer to Figure 347.) FIGURE 347 Select Security Settings dialog box 9. Set quorum size and system card requirements.
Creating a new encryption group 20 FIGURE 348 Confirm Configuration dialog box The Configuration Status dialog box displays. (Refer to Figure 349.) FIGURE 349 Configuration Status dialog box All configuration items have green check marks if the configuration is successful. A red stop sign indicates a failed step. A message displays below the table, indicating the encryption switch was added to the group you named, and the public key certificate is stored in the location you specified.
20 Creating a new encryption group After configuration of the encryption group is completed, the Management application sends API commands to verify the switch configuration. 11. Click Next. The Next Steps dialog box displays. (Refer to Figure 350.) Instructions for installing public key certificates for the encryption switch are displayed. These instructions are specific to the key vault type. FIGURE 350 Next Steps dialog box 12.
Creating a new encryption group 20 • With the introduction of Fabric OS 7.2.0, KMIP with TEKA 4.0 is also supported, but must be configured using the CLI. All nodes in a keyAuthority encryption group must be running Fabric OS 7.2.0 or later. For configuration instructions, refer to the Fabric OS Encryption Administrator’s Guide Supporting Key Management Interoperability Protocol (KMIP) Key-Compliant Environments. Figure 351 shows the key vault selection dialog box for KMIP.
20 Creating a new encryption group • Username: Activates the Primary and Backup Key Vault User Names for completion. • None: Deactivates Primary and Backup Key Vault User Names and password fields. 6. Select the Certificate Type. Options are: • CA Signed: The switch KAC certificate is signed by a CA, imported back on the switch and registered as a KAC certificate. The CA will be registered as a key vault certificate on the switch.
Creating a new encryption group 20 FIGURE 353 Specify Master Key File Name dialog box 9. Enter the name of the file used for backing up the master key, or browse to the desired location. 10. Enter the passphrase, which is required for restoring the master key. The passphrase can be between eight and 40 characters, and any character is allowed. 11. Re-enter the passphrase for verification, then click Next. The Select Security Settings dialog box displays. (Refer to Figure 354.
20 Creating a new encryption group FIGURE 354 Select Security Settings dialog box 12. Set quorum size and system card requirements. The quorum size is the minimum number of cards necessary to enable the card holders to perform the security sensitive operations listed above. The maximum quorum size is five cards.
Creating a new encryption group 20 FIGURE 355 Confirm Configuration dialog box 14. Confirm the encryption group name and switch public key certificate file name you specified are correct, then click Next. The Configuration Status dialog box displays. (Refer to Figure 356.
20 Creating a new encryption group All configuration items have green check marks if the configuration is successful. A red stop sign indicates a failed step. A message displays below the table, indicating the encryption switch was added to the group you named, and the public key certificate is stored in the location you specified. After configuration of the encryption group is completed, the Management application sends API commands to verify the switch configuration. 15. Click Next.
Adding a switch to an encryption group 20 3. Register the key vault. The Management application registers the key vault using the cryptocfg --reg keyvault command. 4. Enable the encryption engines. The Management application initializes an encryption switch using the cryptocfg --initEE [] and cryptocfg --regEE [] commands. 5. Create a new master key. (Opaque key vaults only). The Management application checks for a new master key.
20 Adding a switch to an encryption group FIGURE 358 Configure Switch Encryption wizard - welcome screen 3. Click Next. The Designate Switch Membership dialog box displays. (Refer to Figure 359.) FIGURE 359 Designate Switch Membership dialog box 4. For this procedure, select Add this switch to an existing encryption group, then click Next. The Add Switch to Existing Encryption Group dialog box displays. (Refer to Figure 360.
Adding a switch to an encryption group 20 The dialog box contains the following information: • Encryption Groups table: Enables you to select an encryption group in which to add a switch. • Member Switches table: Lists the switches in the selected encryption group. NOTE If you are creating a new encryption group, refer to “Creating a new encryption group” on page 764. FIGURE 360 Add Switch to Existing Encryption Group dialog box 5. Select the group in which to add the switch, then click Next.
20 Adding a switch to an encryption group FIGURE 361 Specify Public Key Certificate (KAC) File Name dialog box 6. Enter the location where you want to store the public key certificate that is used to authenticate connections to the key vault, or browse to the desired location, then click Next. The Confirm Configuration dialog box displays. (Refer to Figure 362.) Confirm the encryption group name and switch public key certificate file name you specified are correct, then click Next.
Adding a switch to an encryption group 20 The Configuration Status dialog box displays. (Refer to Figure 363.) FIGURE 363 Configuration Status dialog box All configuration items have green check marks if the configuration is successful. A red stop sign indicates a failed step. A message displays below the table, indicating the encryption switch was added to the group you named, and the public key certificate is stored in the location you specified. 7. Review important messages, then click Next.
20 Adding a switch to an encryption group FIGURE 364 Error Instructions dialog box 8. Review the post-configuration instructions, which you can copy to a clipboard or print for later. 9. Click Finish to exit the Configure Switch Encryption wizard.
Replacing an encryption engine in an encryption group 20 Replacing an encryption engine in an encryption group To replace an encryption engine in an encryption group with another encryption engine within the same DEK Cluster, complete the following steps: 1. Select Configure > Encryption from the menu task bar to display the Encryption Center dialog box. (Refer to Figure 266 on page 694.) 2.
20 High availability clusters High availability clusters A high availability (HA) cluster consists of exactly two encryption engines configured to host the same CryptoTargets and to provide Active/Standby failover and failback capabilities in a single fabric. One encryption engine can take over encryption and decryption tasks for the other encryption engine if that member fails or becomes unreachable.
High availability clusters 20 Creating HA clusters For the initial encryption node, perform the following procedure. 1. Select Configure > Encryption from the menu task bar to display the Encryption Center dialog box. (Refer to Figure 266 on page 694.) 2. Select an encryption group from the Encryption Center Devices table, then select Group > HA Cluster from the menu task bar. NOTE If groups are not visible in the Encryption Center Devices table, select View > Groups from the menu task bar.
20 High availability clusters 3. Click the right arrow to add the encryption engine to the selected HA cluster. 4. Click OK. Removing engines from an HA cluster Removing the last engine from an HA cluster also removes the HA cluster. If only one engine is removed from a two-engine cluster, you must either add another engine to the cluster, or remove the other engine. 1. Select Configure > Encryption from the menu task bar to display the Encryption Center dialog box. (Refer to Figure 266 on page 694.) 2.
Configuring encryption storage targets 20 Failback option The Failback option determines the behavior when a failed encryption engine is restarted. When the first encryption engine comes back online, the encryption group’s failback setting (auto or manual) determines how the encryption engine resumes encrypting and decrypting traffic to its encryption targets. • In auto mode, when the first encryption engine restarts, it automatically resumes encrypting and decrypting traffic to its encryption targets.
20 Configuring encryption storage targets 5. Confirmation 6. Configuration Status 7. Important Instructions Adding an encryption target 1. Select Configure > Encryption from the menu task bar to display the Encryption Center dialog box. (Refer to Figure 266 on page 694.) 2. Select a group, switch, or engine from the Encryption Center Devices table to which to add the target, then select Group/Switch/Engine > Targets from the menu task bar.
Configuring encryption storage targets 20 FIGURE 368 Configure Storage Encryption wizard - welcome screen 4. Click Next. The Select Encryption Engine dialog box displays. (Refer to Figure 369.
20 Configuring encryption storage targets The dialog box contains the following information: • Encryption engine: The name of the encryption engine. The list of engines depends on the scope being viewed: - If an encryption group was selected, the list includes all engines in the group. If a switch was selected, the list includes all encryption engines for the switch. If a single encryption engine was selected, the list contains only that engine.
Configuring encryption storage targets 20 6. Select a target from the list. (The Target Port WWN and Target Node WWN fields contain all target information that displays when using the nsShow command.) You can also enter WWNs manually, for example, to specify a target that is not on the list. 7. Select a target type from the Type list, then click Next. The Select Hosts dialog box displays. (Refer to Figure 371.) You can configure hosts for selected target device ports.
20 Configuring encryption storage targets NOTE You must enter the host node world wide name before clicking Add, to add the WWN to the Selected Hosts table. • Node WWN text box: Type a world wide name for a host node. NOTE You must also enter the host port world wide name before clicking Add to add the node WWN to the Selected Hosts table. • Device Type: The device type indicated by the fabric’s name service. The value is either Initiator or Initiator + Target.
Configuring encryption storage targets 20 FIGURE 372 Name Container dialog box 10. Enter the container name. The container name is a logical encryption name to specify a name other than the default. You can use a maximum of 31 characters. Letters, digits, and underscores are allowed. 11. Click Next. The Confirmation screen displays. (Refer to Figure 373.) The confirmation screen confirms and completes configuration of encryption engines, targets, and hosts.
20 Configuring encryption storage targets The Confirmation screen contains the following information: • Encryption Engine: The slot location of the encryption engine. • Container Name: The logical encryption name used to map storage targets and hosts to virtual targets and virtual initiators. • • • • Target Device Port: The world wide name of the target device port. Host Node WWN: The world wide name of the host node. Host Port WWN: The world wide name of the host port. Host Name: The name of the host.
Configuring encryption storage targets 20 13. Review any post-configuration instructions or messages, which you can copy to a clipboard or print for later, then click Next. The Next Steps screen displays. (Refer to Figure 375.) Post-configuration instructions for installing public key certificates for the encryption switch are displayed. These instructions are specific to the key vault type.
20 Configuring hosts for encryption targets Configuring hosts for encryption targets Use the Encryption Target Hosts dialog box to edit (add or remove) hosts for an encrypted target. NOTE Hosts are normally selected as part of the Configure Switch Encryption wizard, but you can also edit hosts later using the Encryption Target Hosts dialog box. 1. Select Configure > Encryption from the menu task bar to display the Encryption Center dialog box. (Refer to Figure 266 on page 694.) 2.
Configuring hosts for encryption targets 20 FIGURE 377 Encryption Target Hosts dialog box NOTE Both the Hosts in Fabric table and the Selected Hosts table now contain a Port ID column to display the 24-bit PID of the host port. 4. Select one or more hosts in a fabric using either of the following methods: a. Select a maximum of 1024 hosts from the Hosts in Fabric table, then click the right arrow to move the hosts to the Selected Hosts table.
20 Adding target disk LUNs for encryption Adding target disk LUNs for encryption You can add a new path to an existing disk LUN or add a new LUN and path by launching the Add New Path wizard. NOTE Before you can add a target disk LUN for encryption, you must first configure the Storage Arrays. For more information, see “Configuring storage arrays” on page 827. Complete the following steps to add a target disk LUN: 1.
Adding target disk LUNs for encryption 20 • Encryption path table: Should be LUN/Path identified by the following: - LUN Path Serial # - Target Port - Initiator Port - Container Name - Switch Name - Fabric - State - Thin Provision LUN - Encryption Mode - Encrypt Existing Data - Key ID • Remove button: Removes a selected entry from the table. 3. Click Add to launch the Add New Path wizard. The Select Target Port dialog box displays. (Refer to Figure 379.
20 Adding target disk LUNs for encryption 4. Select the target port from the Target Port table, then click Next. The Select Initiator Port dialog box displays. (Refer to Figure 380.) FIGURE 380 Select Initiator Port dialog box The dialog box is used to select an initiator port when configuring multiple I/O paths to a disk LUN. The dialog box contains the following information: • Storage Array: Displays the storage array that was selected from the LUN view prior to launching the wizard.
Adding target disk LUNs for encryption 20 FIGURE 381 Select LUN dialog box The dialog box is used to select a LUN when configuring multiple I/O paths to a disk LUN. The dialog box contains the following information: • Storage Array: The storage array selected from the LUN view prior to launching the Add New Path wizard. • Host: The host elected from the LUN view prior to launching the Add New Path wizard.
20 Adding target disk LUNs for encryption 9. Click Finish. The new LUN path is added to the Encryption Disk LUN View table. 10. Click OK on the LUN view to commit the operation. NOTE With the introduction of Fabric OS v7.1.0, the maximum number of uncommitted configuration changes per disk LUN (or maximum paths to a LUN) is 512 transactions. The 512 LUN operations can be for the same LUN or be subjected to 25 distinct LUNs.
Adding target disk LUNs for encryption 20 Configuring storage arrays The storage array contains a list of storage ports that will be used later in the LUN centric view. You must assign storage ports from the same storage array for multi-path I/O purposes. On the LUN centric view, storage ports in the same storage array are used to get the associated CryptoTarget containers and initiators from the database.
20 Adding target disk LUNs for encryption SRDF pairs Remote replication is implemented by establishing a synchronized pair of SRDF devices connected by FC or IP links. A local source device is paired with a remote target device while data replication is taking place. While the SRDF devices are paired, the remote target device is not locally accessible for read or write operations. When the data replication operation completes, the pair may be split to enable normal read/write access to both devices.
Adding target tape LUNs for encryption 20 Note the following when using the New LUN option: • Both LUNs that form an SRDF pair must be added to their containers using the New LUN option. • For any site, all paths to a given SRDF device must be configured with the New LUN option. • All LUNs configured with the New LUN option will report three blocks less than the actual size when host performs READ CAPACITY 10/READ CAPACITY 16.
20 Adding target tape LUNs for encryption FIGURE 384 Encryption Targets dialog box 3. Select a target tape storage device from the Encryption Targets table, then click LUNs. The Encryption Target Tape LUNs dialog box displays. (Refer to Figure 385.) FIGURE 385 Encryption Target Tape LUNs dialog box 4. Click Add. The Add Encryption Target Tape LUNs dialog box displays. (Refer to Figure 386.) A table of all LUNs in the storage device that are visible to hosts is displayed.
Adding target tape LUNs for encryption 20 FIGURE 386 Add Encryption Target Tape LUNs dialog box 5. Select a host from the Host list. Before you encrypt a LUN, you must select a host, then either discover LUNs that are visible to the virtual initiator representing the selected host, or enter a range of LUN numbers to be configured for the selected host. When you select a specific host, only the LUNs visible to that host are displayed.
20 Moving targets • Enable Write Early Ack: When selected, enables tape write pipelining on this tape LUN. Use this option to speed long serial writes to tape, especially for remote backup operations. • Enable Read Ahead: When selected, enables read pre-fetching on this tape LUN. Use this option to speed long serial read operations from tape, especially for remote restore operations. NOTE The Select/Deselect All button allows you to select or deselect all available LUNs. 8.
Configuring encrypted tape storage in a multi-path environment 20 Configuring encrypted tape storage in a multi-path environment This example assumes one host is accessing one storage device using two paths: • The first path is from Host Port A to Target Port A, using Encryption Engine A for encryption. • The second path is from Host Port B to Target Port B, using Encryption Engine B for encryption. Encryption Engines A and B are in switches that are already part of Encryption Group X.
20 Tape LUN write early and read ahead Tape LUN write early and read ahead The tape LUN write early and read ahead feature uses tape pipelining and prefetch to speed serial access to tape storage. These features are particularly useful when performing backup and restore operations, especially over long distances. You can enable tape LUN write early and read ahead while adding the tape LUN for encryption, or you can enable or disable these features after the tape LUN has been added for encryption.
Tape LUN statistics 20 FIGURE 388 Encryption Target Tape LUNs dialog box - Setting tape LUN read ahead and write early 4. In the Enable Write EarlyAck and Enable Read Ahead columns, when the table is populated, you can set these features as desired for each LUN: • • • • To enable write early for a specific tape LUN, select Enable Write Early Ack for that LUN. To enable read ahead for a specific LUN, select Enable Read Ahead for that LUN.
20 Tape LUN statistics Viewing and clearing tape container statistics You can view LUN statistics for an entire crypto tape container or for specific LUNs. To view or clear statistics for tape LUNs in a container, follow these steps: 1. Select Configure > Encryption from the menu task bar to display the Encryption Center dialog box. (Refer to Figure 266 on page 694.) 2. Select a group from the Encryption Center Devices table, then select Group > Targets from the menu task bar.
Tape LUN statistics • • • • • • • 20 Uncompressed blocks: The number of uncompressed blocks written to tape. Compressed blocks: The number of compressed blocks written to tape. Uncompressed Bytes: The number of uncompressed bytes written to tape. Compressed Bytes: The number of compressed bytes written to tape. Host Port WWN: The WWN of the host port that is being used for the write operation. A Refresh button updates the statistics on the display since the last reset.
20 Tape LUN statistics 4. Select the LUN or LUNs for which to display or clear statistics, then click Statistics. The Tape LUN Statistics dialog box displays. (Refer to Figure 392.) The statistic results based on the LUN or LUNs you selected is displayed. Tape LUN statistics are cumulative. FIGURE 392 Tape LUN Statistics dialog box The dialog box contains the following information: • LUN #: The number of the logical unit for which statics are displayed.
Tape LUN statistics 20 NOTE You can also select a group, switch, or engine from the Encryption Center Devices table, then click the Targets icon. The Encryption Targets dialog box displays. (Refer to Figure 393.) A list of configured CryptoTarget containers is displayed. FIGURE 393 Encryption Targets dialog box 3. Select Tape as the container of type for which to display or clear statistics, then click Statistics. The Tape LUN Statistics dialog box displays. (Refer to Figure 394.
20 Encryption engine rebalancing • Uncompressed Bytes: The number of uncompressed bytes written to tape. • Compressed Bytes: The number of compressed bytes written to tape. • Host Port WWN: The WWN of the host port that is being used for the write operation. 4. Do either of the following: • Click Clear to clear the tape LUN statistics for member LUNs in the container, then click Yes to confirm. • Click Refresh to update the tape LUN statistics on the display.
Master keys 20 Rebalancing an encryption engine To re-balance an encryption engine, complete the following steps: 1. Select Configure > Encryption from the menu task bar to display the Encryption Center dialog box. (Refer to Figure 266 on page 694.) 2. Select an engine, then select Engine > Re-Balance from the menu task bar. A warning message displays, noting the potential disruption of disk and tape I/O, and that the operation may take several minutes. 3. Click Yes to begin rebalancing.
20 Master keys Active master key The active master key is used to encrypt newly created data encryption keys (DEKs) prior to sending them to a key vault to be stored. You can restore the active master key under the following conditions: • The active master key has been lost, which happens if all encryption engines in the group have been zeroized or replaced with new hardware at the same time. • You want multiple encryption groups to share the same active master key.
Master keys 20 • Create new master key: Enabled when no master key exists, or the previous master key has been backed up. Refer to “Creating a new master key” on page 849. You must create a new master key when the status is Required but not created. NOTE If a master key was not created, Not Used is displayed as the status and the Master Key Actions list is unavailable. In this case, you must create a new master key.
20 Master keys 6. Enter the passphrase, which is required for restoring the master key. The passphrase can be between eight and 40 characters, and any character is allowed. 7. Re-enter the passphrase for verification, then click OK. ATTENTION Save the passphrase. This passphrase is required if you ever need to restore the master key from the file. Saving a master key to a key vault Use the following procedure to save the master key to a key vault. 1.
Master keys 20 6. Re-enter the passphrase for verification, then click OK. A dialog box displays that shows the Key ID. The Key ID identifies the storage location in the key vault. 7. Store both the Key ID and the passphrase in a secure place. Both will be required to restore the master key in the future. 8. Click OK. after you have copied the Key ID. Saving a master key to a smart card set 1. Select Configure > Encryption from the menu task bar to display the Encryption Center dialog box.
20 Master keys 8. Enter the mandatory last name and first name of the person to whom the card is assigned. 9. Enter a Card Password. 10. Re-enter the password for verification. 11. Record and store the password in a secure location. 12. Click Write Card. You are prompted to insert the next card, up to the number of cards specified in step 5. 13. Repeat step 6 through step 12 for each card in the set. 14. After the last card is written, click OK in the Master Key Backup dialog box to finish the operation.
Master keys 20 FIGURE 398 Restore Master Key for Encryption Group dialog box - Restore from file 4. Choose the active or alternate master key for restoration, as appropriate. 5. Select File as the Restore From location. 6. Enter a file name, or browse to the desired location. 7. Enter the passphrase. The passphrase that was used to back up the master key must be used to restore the master key. 8. Click OK.
20 Master keys FIGURE 399 Restore Master Key for Encryption Group dialog box - Restore from key vault 4. Choose the active or alternate master key for restoration, as appropriate. 5. Select Key Vault as the Restore From location. 6. Enter the key ID of the master key that was backed up to the key vault. 7. Enter the passphrase. The passphrase that was used to back up the master key must be used to restore the master key. 8. Click OK.
Master keys 20 FIGURE 400 Restore Master Key for Encryption Group dialog box - Restore from smart cards 4. Choose the active or alternate master key for restoration, as appropriate. 5. Select A Recovery Set of Smart Cards as the Restore From location. 6. Insert the recovery card containing a share of the master key that was backed up earlier, and wait for the card serial number to appear. 7. Enter the password that was used to create the card.
20 Security settings Security settings Security settings help you identify if system cards are required to initialize an encryption engine and also determine the number of authentication cards needed for a quorum. 1. Select Configure > Encryption from the menu task bar to display the Encryption Center dialog box. (Refer to Figure 266 on page 694.) 2. Select a group from the Encryption Center Devices table, then select Group > Security from the menu task bar.
Using the Encryption Targets dialog box 20 NOTE Zeroizing an engine affects the I/Os, but all target and LUN configurations remain intact. Encryption target configuration data is not deleted. You can zeroize an encryption engine only if it is enabled (running), or disabled but ready to be enabled. If the encryption engine is not in one of these states, an error message results.
20 Redirection zones To access the Encryption Targets dialog box, complete the following steps. 1. Select Configure > Encryption from the menu task bar to display the Encryption Center dialog box. (Refer to Figure 266 on page 694.) 2. Select a group, switch, or engine from the Encryption Center Devices table, then select Group/Switch/Engine > Targets from the menu task bar. NOTE You can also select a group, switch, or engine from the Encryption Center Devices table, then click the Targets icon.
Disk device decommissioning 20 Disk device decommissioning A disk device needs to be decommissioned when any of the following occurs: • The storage lease expires for an array, and devices must be returned or exchanged. • Storage is reprovisioned for movement between departments. • An array or device is removed from service. In all cases, all data on the disk media must be rendered inaccessible.
20 Disk device decommissioning Decommissioning disk LUNs Use the following procedure to decommission a disk LUN. 1. Select Configure > Encryption from the menu task bar to display the Encryption Center dialog box. (Refer to Figure 266 on page 694.) 2. Select a group, switch, or engine from the Encryption Center Devices table that contains the storage device to be configured, then select Group/Switch/Engine > Targets from the menu task bar.
Disk device decommissioning 20 In order to delete keys from the key vault, you need to know the Universal ID (UUID). To display vendor-specific UUIDs of decommissioned key IDs, complete the following procedure: 1. Select Configure > Encryption from the menu task bar to display the Encryption Center dialog box. (Refer to Figure 266 on page 694.) 2. Select a switch from the Encryption Center Devices table, then select Switch > Decommissioned key IDs from the menu task bar.
20 Rekeying all disk LUNs manually Displaying Universal IDs In order to delete keys from the key vaults, you need to know the Universal ID (UUID) associated with the decommissioned disk LUN key IDs. To display the Universal IDs, complete the following procedure: 1. Select Configure > Encryption from the menu task bar to display the Encryption Center dialog box. (Refer to Figure 266 on page 694.) 2.
Rekeying all disk LUNs manually 20 Setting disk LUN Re-key All To rekey all disk LUNs on an encryption node, complete these steps: 1. Select Configure > Encryption from the menu task bar to display the Encryption Center dialog box. (Refer to Figure 266 on page 694.) 2. Select the switch on which to perform a manual re-key from the Encryption Center Devices table, then select Switch > Re-Key All from the menu task bar. (Refer to Figure 404.
20 Rekeying all disk LUNs manually . FIGURE 405 Pending manual rekey operations Viewing disk LUN rekeying details You can view details related to the rekeying of a selected target disk LUN from the LUN Re-keying Details dialog box. 1. Select Configure > Encryption from the menu task bar to display the Encryption Center dialog box. (Refer to Figure 266 on page 694.) 2.
Rekeying all disk LUNs manually 20 4. Click Add. The Add Disk LUNs dialog box displays. This dialog box includes a table of all LUNs in the storage device that are visible to the hosts. 5. Click Re-keying Details. The LUN Re-keying Details dialog box displays. The dialog box contains the following information: • • • • • • Key ID: The LUN key identifier. Key ID State: The state of the LUN rekeying operation. Encryption Algorithm: The algorithm of the LUN rekeying operation.
20 Rekeying all disk LUNs manually FIGURE 407 Re-Key Sessions Status dialog box The dialog box contains the following information: • • • • • LUN #: The LUN number. LUN Serial #: The LUN serial number. Re-Key Session #: The number assigned to the rekeying session. Percent Complete: The percentage of completion of the rekeying session.
Thin provisioned LUNs 20 3. Click Refresh periodically to update the display. Thin provisioned LUNs With the introduction of Fabric OS 7.1.0, the switch can discover if a disk LUN is a thin provisioned LUN. Support for a thin provisioned LUN is limited to disk containers only. Thin provisioned LUNs can be created with the new LUN option. NOTE Currently, thin provisioned LUN support is limited to Brocade-tested storage arrays running specific supported firmware releases.
20 Viewing time left for auto rekey thin-provisioned LUNs results in an attempt by the encryption switch to overwrite data up to the size of the logical size of the thin-provisioned LUN, rather than limiting FTE/rekeying to the size of the physically allocated LUN size or to the data that has been written.
Viewing and editing switch encryption properties 20 FIGURE 408 Encryption Targets Disk LUNs dialog box - Time left for auto rekey Viewing and editing switch encryption properties To view switch encryption properties, complete the following steps: 1. Select Configure > Encryption from the menu task bar to display the Encryption Center dialog box. (Refer to Figure 266 on page 694.) 2.
20 Viewing and editing switch encryption properties FIGURE 409 Encryption Switch Properties dialog box The dialog box contains the following information: • • • • Switch Properties table: A list of properties associated with the selected switch Name: The name of the selected switch Node WWN: The world wide name of the node Switch Status: The health status of the switch.
Viewing and editing switch encryption properties 20 • Encryption Group: The name of the encryption group to which the switch belongs • Encryption Group Status: Status options are: - OK/Converged: the Group Leader can communicate with all members - Degraded: the Group Leader cannot communicate with one or more members.
20 Viewing and editing switch encryption properties • Primary Key Vault Link Key Status/Backup Key Vault Link Key Status: Status options are: - Not Used: The key vault type is not LKM/SSKM. - No Link Keys, ready to establish: No access request has been sent to an LKM/SSKM, or a previous request was not accepted. - Link key requested, waiting for LKM approval: A request has been sent to LKM/SSKM and is waiting for the LKM/SSKM administrator’s approval.
Viewing and editing switch encryption properties 20 • Re-Balance Recommended: Indicates if LUN rebalancing is recommended for an encryption engine that is hosting both disk and tape LUNs. Options are Yes and No. • System Card Status: The current status of system card information for the encryption engine. Options are Enabled and Disabled.
20 Viewing and editing encryption group properties Enabling and disabling the encryption engine state from Properties To enable the encryption engine, complete the following steps: 1. Select Configure > Encryption from the menu task bar to display the Encryption Center dialog box. (Refer to Figure 266 on page 694.) 2.
Viewing and editing encryption group properties 20 FIGURE 411 Encryption Group Properties dialog box The dialog box contains the following information: • • • • • General tab: For a description of the dialog box, refer to “General tab” on page 869. Members tab: For a description of the dialog box, refer to “Members tab” on page 873. Security tab: For a description of the dialog box, refer to “Security tab” on page 875.
20 Viewing and editing encryption group properties FIGURE 412 Encryption Group Properties dialog box - General tab The dialog box contains the following information: • Encryption Group Name: The name of the encryption group. • Group Status: The status of the encryption group. Options are: - OK-Converged: The Group Leader can communicate with all members. - Degraded: The Group Leader cannot contact one or more of the configured group members.
Viewing and editing encryption group properties 20 • Key Vault Type: Options are: - RSA Data Protection Manager (DPM): If an encryption group contains mixed firmware nodes, the Encryption Group Properties Key Vault Type name is based on the firmware version of the Group Leader. For example, If a switch is running Fabric OS 7.1.0 or later, the Key Vault Type is displayed as “RSA Data Protection Manager (DPM).”If a switch is running a Fabric OS version prior to v7.1.
20 Viewing and editing encryption group properties • Backup Key Vault Connection Status: The status of the backup key vault link. Options are: - Connected - Unknown/Busy - Not configured - Not responding - Failed authentication • High Availability Mode: (For KMIP key vault type.) Options are: - Opaque: Both the primary and secondary key vaults are registered on the switch. The client archives the key to a single (primary) key vault.
Viewing and editing encryption group properties 20 Members tab The Members tab lists group switches, their role, and their connection status with the Group Leader. The table columns are not editable. The tab displays the configured membership for the group and includes the following: • • • • Node WWN: The member switch’s world wide name. IP Address: The switch’s IP address or host name. Node Name: The switch’s node name, if known. If unknown, this field is blank.
20 Viewing and editing encryption group properties FIGURE 413 Encryption Group Properties dialog box - Members tab Members tab Remove button You can click the Remove button to remove a selected switch or group from the encryption group table. • You cannot remove the Group Leader unless it is the only switch in the group. If you remove the Group Leader, the Management application also removes the HA cluster, the target container, and the tape pool (if configured) that are associated with the switch.
Viewing and editing encryption group properties 20 The consequences of removing the last switch in a group (which will be the Group Leader) are all switch removal consequences noted above, plus the following: • The encryption group is deleted. • All configured tape pools are deleted. Table 67 explains the impact of removing switches. TABLE 67 Switch removal impact Switch configuration Impact of removal The switch is the only switch in the encryption group. The encryption group is also removed.
20 Viewing and editing encryption group properties FIGURE 414 Encryption Group Properties dialog box - Security tab The dialog box contains the following information: • Master Key Status: Displays the status of the master key. Possible values are: - Not used: Displays when LKM/SSKM is the key vault. - Required but not created: Displays when a master key needs to be created. - Created but not backed up: Displays when the master key needs to be backed up.
Viewing and editing encryption group properties 20 • Registered Authentication Cards table: Lists the registered authentication cards. - Group Card #: The number of cards that are registered. - Card ID: The card serial number. - First Name and Last Name: The first and last name of the person assigned to the card. The names are identified when the authentication card is first registered. - Notes: An optional entry of information.
20 Viewing and editing encryption group properties • Non-HA Encryption Engines table: Displays a list of encryption engines that are not configured for high-availability clustering • High-Availability Clusters table: A list of encryption engines that have been selected for high-availability clustering. • Right and left arrow buttons: You can select an encryption engine in the Non-HA Encryption Engines table and click the right arrow button to add the encryption engine to the High-Availability Clusters.
Viewing and editing encryption group properties 20 Link Keys tab NOTE The Link Keys tab displays only if the key vault type is NetApp LKM/SSKM. Connections between a switch and an NetApp LKM/SSKM key vault require a shared link key. Link keys are used only with LKM/SSKM key vaults. Link keys are used to protect data encryption keys in transit to and from the key vault. There is a separate link key for each key vault for each switch.
20 Viewing and editing encryption group properties FIGURE 416 Encryption Group Properties dialog box - Link Keys tab Tape Pools tab Tape pools are managed from the Tape Pools tab. From the Tape Pools tab, you can add, modify, and remove tape pools. • To add a tape pool, click Add, then complete the Add Tape Pool dialog box. • To remove an encryption switch or engine from a tape pool, select one or more tape pools listed in the table, then click Remove.
Viewing and editing encryption group properties 20 FIGURE 417 Encryption Group Properties dialog box - Tape Pools tab Tape pools overview Tape cartridges and volumes can be organized into a tape pool (a collection of tape media). The same data encryption keys are used for all cartridges and volumes in the pool. Tape pools are used by backup application programs to group all tape volumes used in a single backup or in a backup plan.
20 Viewing and editing encryption group properties NOTE If groups are not visible in the Encryption Center Devices table, select View > Groups from the menu task bar. 3. Click Add. The Add Tape Pool dialog box displays. (Refer to Figure 418.) The Name tape pool label type is the default; however, you can change the tape pool label type to Number (Refer to Figure 419.) FIGURE 418 Add Tape Pool by name dialog box FIGURE 419 Add Tape Pool by number dialog box 4.
Viewing and editing encryption group properties 20 6. Enter the number of days to use a key before obtaining a new one, if you choose to enforce a key lifespan. The default is Infinite (a blank field or a value of 0), which is the recommended setting. NOTE The key lifespan interval represents the key expiry timeout period for tapes or tape pools. You can only enter the Key Lifespan field if the tape pool is encrypted. If Clear Text is selected as the encryption mode, the Key Lifespan field is disabled.
20 Encryption-related acronyms in log messages NOTE You cannot replace an encryption engine if it is part of an HA cluster. Encryption-related acronyms in log messages Fabric OS log messages related to encryption components and features may have acronyms embedded that require interpretation. Table 68 lists some of those acronyms.
Chapter 21 Zoning In this chapter • Zoning overview . . . . . . . . . . . . . . . . . . . . . . . . . . . . . . . . . . . . . . . . . . . . . . . • Zone database size . . . . . . . . . . . . . . . . . . . . . . . . . . . . . . . . . . . . . . . . . . . . • Zoning configuration . . . . . . . . . . . . . . . . . . . . . . . . . . . . . . . . . . . . . . . . . . . • LSAN zones . . . . . . . . . . . . . . . . . . . . . . . . . . . . . . . . . . . . . . . . . . . . . . . . . . • LSAN tagging . . . . . . . . .
21 Zoning overview Blue Zone Server 2 Server 1 Storage 2 Red Zone Storage 1 RAID Green Zone Storage 3 Server 3 FIGURE 421 Zoning NOTE Zone objects based on physical port number or port ID (D,I ports) are not supported in Network OS fabrics. Types of zones The following types of zones are supported: • Standard zones Enable you to partition your fabric into logical groups of devices that can access each other. These are “regular” or “standard” zones.
Zoning overview 21 • QoS zones Assign high or low priority to designated traffic flows. Quality of Service (QoS) zones are standard zones with additional QoS attributes that you select when you create the zone. • Traffic Isolation zones (TI zones) Isolate inter-switch traffic to a specific, dedicated path through the fabric. Refer to “Traffic Isolation zones” on page 916 for more information.
21 Zone database size Zoning naming conventions The naming rules for zone names, zone aliases, and zone configuration names vary with the type of fabric. The following conventions apply: • Names must start with an alphabetic character and may contain alphanumeric characters and the underscore ( _ ) character. • Names are not case-sensitive. • Zone, alias, and configuration names cannot begin with “bfa_”,“red_”, “lsan_red_”, or “d__efault__”. Zone configuration names cannot begin with “r_e_d_i_r_c__fg”.
Zoning configuration 21 Zoning configuration At a minimum, zoning configuration entails creating zones and zone members. However, you can also create zone aliases, zone configurations, and zone databases. You can define multiple zone configurations, deactivating and activating individual configurations as your needs change. Zoning configuration can also involve enabling or disabling the default zone.
21 Zoning configuration 2. Click the Zone DB tab if that tab is not automatically displayed. 3. Select a fabric from the Zoning Scope list. This identifies the target entity for all subsequent zoning actions and displays the zoning database for the selected entity. 4. Click New Zone. A new zone displays in the Zones list. 5. Type the name for the zone. For zone name requirements and limitations, refer to “Zoning naming conventions” on page 888. 6.
Zoning configuration 21 Adding members to a zone Use this procedure to add a member to a zone when the member is listed in the Potential Members list of the Zone DB tab. Enterprise and Professional Plus editions: For instructions to add a member to a zone when the member is not listed in the Potential Members list, refer to the procedure “Creating a member in a zone” on page 892. 1. Select Configure > Zoning > Fabric. The Zoning dialog box displays. 2.
21 Zoning configuration 9. Click OK or Apply to save your changes. Any zones or zone configurations you have changed are saved in the zone database. Creating a member in a zone Use this procedure to add a member to a zone when the member is not listed in the Potential Members list of the Zone DB tab. For instructions to add a member to a zone when the member is listed in the Potential Members list, refer to the procedure “Adding members to a zone” on page 891. 1. Select Configure > Zoning > Fabric.
Zoning configuration 21 Removing a member from a zone Use the following procedure to remove one or more members from a zone or zones. Note that the member is not deleted; it is only removed from the zone. 1. Select Configure > Zoning > Fabric. The Zoning dialog box displays. 2. Click the Zone DB tab if that tab is not automatically displayed. 3. Select a fabric from the Zoning Scope list.
21 Zoning configuration 7. Click OK or Apply to save your changes. Any zones or zone configurations you have changed are saved in the zone database. Deleting a zone 1. Select Configure > Zoning > Fabric. The Zoning dialog box displays. 2. Click the Zone DB tab if that tab is not automatically displayed. 3. Select a fabric from the Zoning Scope list. This identifies the target entity for all subsequent zoning actions and displays the zoning database for the selected entity. 4.
Zoning configuration 21 5. (Optional) Type a new name for the zone and press Enter to save the name. Depending on the characters included in the name you enter, a message may display informing you the name contains characters that are not accepted by some switch vendors. Click OK and enter a different name or accept the default name assigned to the zone. (For zone name requirements and limitations, refer to “Zoning naming conventions” on page 888.) 6. Click OK or Apply to save your changes.
21 Zoning configuration 6. Make sure the appropriate fabric is named on the Zoning Policies dialog box. 7. Perform one of the following actions based on the task you want to complete: • To enable the default zone, click Enable, and then click OK. • To disable the default zone, click Disable, and then click OK. The Zoning Policies dialog box closes and the Zone DB tab displays. 8. Click OK or Apply to save your changes. Any zones or zone configurations you have changed are saved in the zone database.
Zoning configuration 21 Editing a zone alias 1. Select Configure > Zoning > Fabric. The Zoning dialog box displays. 2. Click the Zone DB tab if that tab is not automatically displayed. 3. Select a fabric from the Zoning Scope list. 4. Select Alias from the Type list. 5. Select the alias you want to edit in the Alias list and click Edit. The Edit Alias dialog box displays. 6. Add members to the alias by completing the following steps. a.
21 Zoning configuration 6. Select one or more objects that you want to remove from the alias in the Alias list. (Press SHIFT or CTRL and click each member to select more than one member.) You can select objects from different zone aliases. 7. Right-click one of the selected objects and select Remove. The selected objects are removed from the associated zone aliases. 8. Click OK or Apply on the Zoning dialog box to save your changes. Exporting zone aliases 1. Select Configure > Zoning > Fabric.
Zoning configuration 21 3. Select a fabric from the Zoning Scope list. 4. Select Alias from the Type list. 5. Right-click the zone alias you want to delete and select Delete. 6. Click Yes on the confirmation message. The selected zone alias is deleted from the Alias list. 7. Click OK or Apply on the Zoning dialog box to save your changes. Duplicating a zone alias 1. Select Configure > Zoning > Fabric. The Zoning dialog box displays. 2. Click the Zone DB tab if that tab is not automatically displayed. 3.
21 Zoning configuration 7. Add zones to the zone configuration. For step-by-step instructions, refer to “Adding zones to a zone configuration” on page 900. 8. Click OK or Apply to save your changes. Any zones or zone configurations you have changed are saved in the zone database. Viewing zone configuration properties 1. Select Configure > Zoning > Fabric. The Zoning dialog box displays. 2. Click the Zone DB tab if that tab is not automatically displayed. 3.
Zoning configuration 21 Removing a zone from a zone configuration Use the following procedure to remove a zone from a zone configuration. Note that the zone is not deleted; it is only removed from the zone configuration. 1. Select Configure > Zoning > Fabric. The Zoning dialog box displays. 2. Click the Zone DB tab if that tab is not automatically displayed. 3. Select a fabric from the Zoning Scope list.
21 Zoning configuration 3. Select a fabric from the Zoning Scope list. This identifies the target entity for all subsequent zoning actions and displays the zoning database for the selected entity. 4. (Optional) Select a zone database from the Zone DB list (Enterprise and Professional Plus editions only). 5. Select the zone configuration you want to activate in the Zone Configurations list. 6. Click Activate. 7. Review the information in the Activate Zone Configuration dialog box. a.
Zoning configuration 21 • The selected fabric is not supported by the Management application. • The selected fabric is no longer discovered. 1. Select Configure > Zoning > Fabric. The Zoning dialog box displays. 2. Click the Active Zone Configuration tab. 3. Select a fabric from the Active Zone Configuration list. This identifies the target entity for all subsequent zoning actions and displays the zoning database for the selected entity. 4. Click Deactivate. 5. Click Yes on the confirmation message.
21 Zoning configuration 3. Select a fabric from the Zoning Scope list. This identifies the target entity for all subsequent zoning actions and displays the zoning database for the selected entity. 4. Select one or more zone configurations in the Zone Configurations list that you want to delete, then right-click and select Delete. A message displays asking you to confirm the deletion. 5. Click Yes to delete the selected zone configuration.
Zoning configuration 21 6. Click OK or Apply to save your changes. Any zones or zone configurations you have changed are saved in the zone database. Creating an offline zone database Offline zone databases are supported only in Enterprise and Professional Plus editions. Use this procedure to create a zone database and save it offline. 1. Select Configure > Zoning > Fabric. The Zoning dialog box displays. 2. Click the Zone DB tab if that tab is not automatically displayed. 3.
21 Zoning configuration Deleting an offline zone database 1. Select Configure > Zoning > Fabric. The Zoning dialog box displays. 2. Select a fabric from the Zoning Scope list. This identifies the target entity for all subsequent zoning actions and displays the zoning databases for the selected entity. 3. Select the offline zone database you want to delete in the Zone DB list. NOTE Only offline databases can be deleted. 4. Select Delete from the Zone DB Operation list. 5.
Zoning configuration 21 5. If the active zone configuration names are the same in each fabric, then load the offline repository, and activate the zone configuration on each fabric. 6. If the active configuration names are different in each fabric, rename the zone configurations to be the same, and copy the zones. 7. Ensure that the active configurations are the same. a. Load the newly created offline zone database. b.
21 Zoning configuration 4. Select a database from the Editable Zone DB list. The Reference Zone DB and Editable Zone DB areas display all available element types (zone configurations, zones, and aliases) for the two selected zone databases. In the Editable Zone DB area, each element type and element display with an icon indicator (Table 69) to show the differences between the two databases. 5. (Optional) Merge elements (zone configurations, zones, or aliases) by completing the following steps: a.
Zoning configuration 21 Creating a common active zone configuration in two fabrics Before you can merge two fabrics, the defined and active zone configurations in both fabrics must match. Refer to “Merging two zone databases” on page 907 for instructions on how to merge the zone databases in two fabrics. After you merge the two zone databases, you create a common active zone configuration before physically merging the fabrics. 1. Select Configure > Zoning > Fabric. The Zoning dialog box displays. 2.
21 Zoning configuration Exporting an offline zone database NOTE You cannot export an online zone database. 1. Select Configure > Zoning > Fabric. The Zoning dialog box displays. 2. Select an offline zone database from the Zone DB list. 3. Select Export from the Zone DB Operation list. The Export Zone DB dialog box displays. 4. Browse to the location where you want to export the zone database file (.xml format). 5. Click Export Zone DB. 6. Click OK to save your work and close the Zoning dialog box.
LSAN zones 21 LSAN zones Connecting to another network through a Fibre Channel (FC) router, you can create an LSAN zone to include zone objects on other fabrics. No merging takes place across the FC router when you create an LSAN zone. Supported configurations for LSAN zoning LSAN zoning is available only for backbone fabrics and any directly connected edge fabrics. A backbone fabric is a fabric that contains an FC router.
21 LSAN zones 8. Review the information in the Activate LSAN Zones dialog box. LSAN zones that contain online members are automatically included in the Destination Fabrics list. For LSAN zones that contain offline members, you can click the right arrow button to assign these zones to fabrics in the Destination Fabrics list. 9. Click OK to activate the LSAN zones and close the dialog box. A message displays informing you about the effects of LSAN zone activation and asking whether you want to proceed.
LSAN zones 21 9. Click OK to activate the LSAN zones. A message displays informing you about the effects of LSAN zone activation and asking whether you want to proceed. Click Yes to confirm the activation, or click No to cancel the activation. 10. Click OK to continue. All LSAN zones are activated on the selected fabrics and saved to their respective zone databases. 11. Click OK to close the Zoning dialog box.
21 LSAN zones 9. Click OK to activate the LSAN zones. A message displays informing you about the effects of LSAN zone activation and asking whether you want to proceed. Click Yes to confirm the activation, or click No to cancel the activation. 10. Click OK to continue. All LSAN zones are activated on the selected fabrics and saved to their respective zone databases. 11. Click OK to close the Zoning dialog box.
LSAN tagging 21 10. Click OK to continue. All LSAN zones are activated on the selected fabrics and saved to their respective zone databases. 11. Click OK to close the Zoning dialog box. Activating LSAN zones 1. Select a backbone fabric from the Connectivity Map or Product List. 2. Select Configure > Zoning > LSAN Zoning (Device Sharing). The Zoning dialog box displays, with the LSAN scope. 3. Click Activate. 4. Review the information in the Activate LSAN Zones dialog box.
21 Traffic Isolation zones Traffic Isolation zones A Traffic Isolation zone (TI zone) is a special zone that isolates inter-switch traffic to a specific, dedicated path through the fabric. A TI zone contains a list of E_Ports, followed by a list of N_Ports. When the TI zone is activated, the fabric attempts to isolate all inter-switch traffic between N_Ports to only those E_Ports that have been included in the zone.
Traffic Isolation zones • • • • • • 21 8 Gbps 40-port Switch (Brocade VA-40FC) 16 Gbps 4-slot Backbone Chassis (Brocade DCX 8510-4) 16 Gbps 8-slot Backbone Chassis (Brocade DCX 8510-8) 8-slot Backbone Chassis (Brocade DCX) 4-slot Backbone Chassis (Brocade DCX-4S) 8 Gbps Encryption Switch (Brocade Encryption Switch) Enhanced TI zones are supported only if the following conditions are met: • Every switch must be one of the previously listed supported platforms. • Every switch must be running Fabric OS 6.
21 Traffic Isolation zones 8. Click OK or Apply to save your changes. The Traffic Isolation zones are saved, but are not activated. The Traffic Isolation zones are activated when you activate a zone configuration in the same zone database. Creating a Traffic Isolation zone Traffic Isolation zones are configurable only on a Fabric OS device. The seed switch must be running Fabric OS 6.1.1 or later. 1. Select Configure > Zoning > Fabric. The Zoning dialog box displays. 2.
Traffic Isolation zones 21 4. (Optional) If you want to show all discovered fabrics in the Potential Members list, right-click in the Potential Members list and select Display All. 5. Select one or more Traffic Isolation zones to which you want to add members in the Zones list. (Press SHIFT or CTRL and click each zone name to select more than one zone.) 6. Select Domain, Port Index from the Type list. 7.
21 Traffic Isolation zones Disabling a Traffic Isolation zone NOTE Traffic Isolation zones are configurable only on a Fabric OS device. Traffic Isolation zones are enabled by default when you create them. Use this procedure to disable a Traffic Isolation zone. To apply the settings and deactivate the zone, you must activate a zone configuration in the same zone database. 1. Select Configure > Zoning > Fabric. The Zoning dialog box displays. 2.
Boot LUN zones 21 • If you create a TI zone with E_Ports only, failover must be enabled. If failover is disabled, the specified ISLs will not be able to route any traffic. • Ensure that there are multiple paths between switches. Disabling failover locks the specified route so that only TI zone traffic can use it. ATTENTION If failover is disabled, use care when planning your TI zones so that non-TI zone devices are not isolated.
21 Boot LUN zones 4. Launch the New Boot LUN Zone dialog box by performing one of the following options: • Select New Boot LUN Zone from the New Zone list. • Right-click a zone in the Zones list and select New Boot LUN Zone. The New Boot LUN Zone dialog box displays. The scope of the dialog box is either the selected fabric or the selected zone, depending on how you launch it. 5. Select a host port WWN from the list or enter an offline WWN.
Zoning administration 21 A message displays that a Boot LUN zone already exists and asks whether you want to overwrite the existing zone. 9. Click Yes. The existing Boot LUN zone is replaced by the version you just created. Deleting a Boot LUN zone Boot LUN zones are deleted the same way that standard zones are deleted. Refer to “Deleting a zone” on page 894 for instructions. Zoning administration This section provides instructions for performing administrative functions with zoning.
21 Zoning administration FIGURE 423 Compare/Merge Zone DBs dialog box 3. Select a database from the Reference Zone DB list. 4. Select a database from the Editable Zone DB list. The Reference Zone DB and Editable Zone DB areas display all available element types (zone configurations, zones, and aliases) for the two selected zone databases. In the Editable Zone DB area, each element type and element display with an icon indicator (Table 69) to show the differences between the two databases. 5.
Zoning administration 7. 21 Select the Differences only check box to display only the differences between the selected databases. 8. Select the Sync Scroll Enable check box to synchronize scrolling between the selected databases. 9. Click Previous or Next to navigate line-by-line in the Editable Zone DB area. 10. Click Close. To merge two zone databases, refer to “Merging two zone databases” on page 907.
21 Zoning administration 3. Enter the maximum number of zone database changes that can be made for that fabric before a zone configuration is activated. To set a limit, enter a positive integer. To allow unlimited changes, enter 0. 4. Repeat step 2 and step 3 for each fabric on which you want to set limits. 5. To set a limit for new, undiscovered fabrics, enter a value in the Default Change Count for New Fabrics field. This limit is enforced on all new fabrics as they are discovered.
Zoning administration 21 3. Select a zone database that you have checked out (your user name is in the Current User column) in the Zone DB list. 4. Select Undo CheckOut from the Zone DB Operation list. 5. Click Yes in the confirmation message. This removes the user names of users currently logged in to the client from the Current User column for this zone database. 6. Click OK to save your work and close the Zoning dialog box.
21 Zoning administration Finding zones in a zone configuration Use this procedure to locate all instances of a zone in the Zone Configurations list on the Zone DB tab. 1. Select Configure > Zoning > Fabric. The Zoning dialog box displays. 2. Click the Zone DB tab if that tab is not automatically displayed. 3. Select a fabric from the Zoning Scope list. This identifies the target entity for all subsequent zoning actions and displays the zoning database for the selected entity. 4.
Zoning administration 21 3. Select a fabric from the Zoning Scope list. This identifies the target entity for all subsequent zoning actions and displays the zoning database for the selected entity. 4. Right-click in the Potential Members list and select List Zone Members. The List Zone Members dialog box displays. If the port is a member of a zone, the fabric name, the port name, and WWN zone members display. 5. Select Historical Graph or Real-Time Graph from the Performance Graph drop-down list.
21 Zoning administration 5. Click OK on the Offline Device Management dialog box. A warning message displays informing you that the selected zone members will be replaced from all zones and aliases in the selected zone DB. 6. Click OK on the message. 7. Click OK or Apply on the Zoning dialog box to save your changes. Any zones or zone configurations you have changed are saved in the zone database.
Zoning administration 21 2. Select a fabric from the Zoning Scope list. This identifies the target entity for all subsequent zoning actions and displays the zoning database for the selected entity. 3. Select Offline Utility from the Zone DB Operation list. The Offline Device Management dialog box displays. 4. Clear the Remove column check box for the offline device you want to replace. 5. Select WWN (default) in the corresponding Replace Using list. 6.
21 Zoning administration 8. Click OK on the Offline Device Management dialog box. A warning message displays informing you that the selected zone members will be removed from all zones and aliases in the selected zone DB. 9. Click OK on the message. 10. Click OK or Apply on the Zoning dialog box to save your changes. Any zones or zone configurations you have changed are saved in the zone database.
Chapter 22 Fibre Channel over IP In this chapter • FCIP services licensing . . . . . . . . . . . . . . . . . . . . . . . . . . . . . . . . . . . . . . . . . • FCIP Concepts . . . . . . . . . . . . . . . . . . . . . . . . . . . . . . . . . . . . . . . . . . . . . . . . • IP network considerations. . . . . . . . . . . . . . . . . . . . . . . . . . . . . . . . . . . . . . . • FCIP platforms and supported features. . . . . . . . . . . . . . . . . . . . . . . . . . . . • FCIP trunking . . . . . . . . . . . .
22 FCIP services licensing FCIP services licensing Most of the FCIP extension services described in this chapter require the High Performance Extension over FCIP/FC license. FICON emulation features require additional licenses. The following features and licensing apply to the 8 Gbps Extension platforms. • FCIP Adaptive Rate Limiting requires the FTR_AE (Advanced Extension) license. • FCIP trunking requires FTR_AE license.
FCIP platforms and supported features 22 FCIP platforms and supported features The following Fabric OS platforms that support FCIP: • The 8 Gbps Extension Switch. • The 8 Gbps Extension blade (8-slot Backbone Chassis, 4-slot Backbone Chassis). NOTE The 8 Gbps Extension blade is supported in 16 Gbps Backbone and Director Chassis, IPv6 addressing is not supported in conjunction with IPsec on all platforms in Fabric OS version v7.0, but will be supported in a later version.
22 FCIP trunking The way FCIP tunnels and virtual ports map to the physical GbE ports depends on the switch or blade model. The 8 Gbps Extension Switch and 8 Gbps Extension Blade tunnels are not tied to a specific GbE port, and may be assigned to any virtual port within the allowed range. The mapping of GbE ports to tunnels and virtual port numbers is summarized in Table 71.
FCIP trunking 22 FCIP tunnel restrictions for FCP and FICON emulation features Multiple FCIP tunnels are not supported between pairs of Extension Switches and Blades when any of the FICON or FCP emulation features are enabled on the tunnel unless TI Zones or LS/LF configurations are used to provide deterministic flows between the switches. The emulation features require deterministic FC Frame routing between all initiators and devices over multiple tunnels.
22 FCIP trunking FCIP circuit failover capabilities Each FCIP circuit is assigned a metric, which is used in managing failover for FC traffic. Typically, the metric will be either 0 or 1. If a circuit fails, FCIP Trunking tries first to retransmit any pending send traffic over another lowest metric circuit. In Figure 425, circuit 1 and circuit 2 are both lowest metric circuits. Circuit 1 has failed, and transmission fails over to circuit 2, which has the same metric.
FCIP trunking 22 The following actions occur during circuit failures: • If either circuit 0 or circuit 1 fails, traffic flows over the remaining circuit while the failed circuit is being recovered. The available bandwidth is still considered to be 1.5 Gbps. • If both circuit 0 and circuit 1 fail, there is a failover to circuits 2 and 3, and the available bandwidth is updated as 2 Gbps.
22 FCIP trunking • A valid failover group requires at least one metric 0 circuit and at least one metric 1 circuit. If you do not configure these, a warning will display. If there is no metric 0 circuit and only a metric 1 circuit, the metric 1 circuit will be used, regardless of whether there are metric 0 circuits in another failover group. • The number of valid failover groups defined per tunnel is limited by the number of circuits that you can create for the switch model.
FCIP trunking 22 Table 74 illustrates circuit failover in a tunnel with circuits in failover groups and circuits that are not part of failover groups. In this configuration, all data is initially load balanced over circuit.1, circuit 2, and circuit 3 (when they are all active). The following occurs during circuit failover: • If circuit1 fails, circuit 4 becomes active and data is load balanced over circuit 2, circuit 3, and circuit 4.
22 Adaptive Rate Limiting Adaptive Rate Limiting Adaptive Rate Limiting (ARL) is performed on FCIP tunnel connections to change the rate in which the FCIP tunnel transmits data through the TCP connections. This feature is available only on the 8 Gbps Extension Switches and 8 Gbps Extension Blades. ARL uses information from the TCP connections to determine and adjust the rate limit for the FCIP tunnel dynamically.
QoS SID/DID priorities over an FCIP trunk 22 External User Perspective Internal Architecture VE Port Tunnel Circuit High Priority Med.
22 IPsec and IKE implementation over FCIP 4. Click Advanced Settings. The Advanced Settings dialog box is displayed. This dialog box has a Transmission tab, Security tab, and FICON Emulation tab. Configure QoS percentages on the Transmission tab (Figure 428). FIGURE 428 Advanced Settings Transmission Tab 5. Click the up or down arrows by QoS High, QoS Medium, and QoS Low to increment values by 1% and override the default values of 50% (high), 30% (medium), and 20% (low). The three values must equal 100%.
IPsec and IKE implementation over FCIP 22 IPsec for the 4 Gbps platforms IPsec uses some terms that you should be familiar with before beginning your configuration. These are standard terms, but are included here for your convenience. Term Definition AES Advanced Encryption Standard. FIPS 197 endorses the Rijndael encryption algorithm as the approved AES for use by US Government organizations and others to protect sensitive information. It replaces DES as the encryption standard.
22 QOS, DSCP, and VLANs IPSec for the 8 Gbps platforms The 8 Gbps platforms use AES-GCM-ESP as a single, pre-defined mode of operation for protecting all TCP traffic over an FCIP tunnel. AES-GCM-ESP is described in RFC-4106. Key features are listed below: • Encryption is provided by AES with 256 bit keys. • The IKEv2 key exchange protocol is used by peer switches and blades for mutual authentication. • IKEv2 uses UDP port 500 to communicate between the peer switches or blades.
QOS, DSCP, and VLANs 22 DSCP quality of service Layer three class of service DiffServ Code Points (DSCP) refers to a specific implementation for establishing QoS policies as defined by RFC2475. DSCP uses six bits of the Type of Service (TOS) field in the IP header to establish up to 64 different values to associate with data traffic priority. DSCP settings are useful only if IP routers are configured to enforce QoS policies uniformly within the network.
22 Open systems tape pipelining TABLE 75 Default Mapping of DSCP priorities to L2Cos Priorities (Continued) DSCP priority/bits L2CoS priority/bits Assigned to: 47 / 101111 4 / 100 High QoS 51 / 110011 4 / 100 High QoS 55 / 110111 4 / 100 High QoS 59 / 111011 4 / 100 High QoS 63 / 111111 0 / 000 - Open systems tape pipelining Open Systems Tape Pipelining (OSTP) can be used to enhance open systems SCSI tape write I/O performance.
FICON emulation features TABLE 76 22 OSTP constraints FCIP Fastwrite Tape Acceleration Class 3 traffic is accelerated with Fastwrite. Class 3 traffic is accelerated between host and sequential device. With sequential devices (tape drives), there are 1024 initiator-tape (IT) pairs per GbE port, but 2048 initiator-tape-LUN (ITL) pairs per GbE port. The ITL pairs are shared among the IT pairs. For example: Two ITL pairs for each IT pair as long as the target has two LUNs.
22 FICON emulation features Tape write pipelining FICON tape write pipelining improves performance for a variety of applications when writing to tape over extended distances. FICON tape write pipelining locally acknowledges write data records, enabling the host to generate more records while previous records are in transit across the IP WAN. If exception status is received from the device, the writing of data and emulation is terminated.
Connecting cascaded FICON fabrics over FCIP 22 Connecting cascaded FICON fabrics over FCIP This section provides a basic guide of IP best practices for connecting cascaded FICON fabrics over an IP network through FCIP and merging the fabrics. Included are planning considerations, steps for configuring an IP link between two Extension Switches and merging them into one fabric, and steps for configuring DWDM links to use R_RDYs.
22 Connecting cascaded FICON fabrics over FCIP Procedures in this section may refer to additional sections in this chapter or additional chapters in this manual for more detailed information. This section assumes that the switches in the fabrics to be merged have been configured for FICON operation using procedures under “Configuring a switch for FICON operation” Chapter 25, “FICON Environments”.
Connecting cascaded FICON fabrics over FCIP 22 Configuring IP links and merging the fabrics Use the following procedures to configure an IP connection between two Extension Switches or Blades, then merging the fabrics to which they belong. 1. Perform all tasks under “FCIP configuration guidelines” on page 957. 2. Configure tunnels circuits between the switches by following steps under “Configuring an FCIP tunnel” on page 958 3.
22 Connecting cascaded FICON fabrics over FCIP • Set only one type of acceleration feature per tunnel. Tape and XRC Emulation must not be enabled on the same tunnel. • Except for tape and XRC emulation, it is not necessary to isolate traffic for emulation features. 7. Configure circuits for tunnels using steps under and “Adding an FCIP circuit” on page 962 8. Follow these guidelines when configuring circuits through the Add FCIP Circuit dialog box.
Connecting cascaded FICON fabrics over FCIP 22 Configuring DWDM links to use R_RDYs TDM requires that you configure DWDM links to use R_RDYs and not VC_RDYs. The only way to turn off VC_RDYs is to start with QoS “OFF,” and then turn on ISL R_RDY mode. Execute the following Fabric OS commands on E_Ports (ISL connections). 1. Enter the following command to disable credit recovery on a port. portcfgcreditrecovery --disable slot/port speed 2. Enter the following command to set the speed for the link.
22 Connecting cascaded FICON fabrics over FCIP TABLE 77 Using Fast Write for extended applications Manufacturer RDR Application Platform Type Use Fast Write EMC MirrorView CLARiiON Sync Yes EMC SANcopy CLARiiON Async Yes HDS Universal Replicator (HUR) All Async No HDS TrueCopy All Async No HP Continuous Access EVA Hybrid No * OSTP Tape Tape Yes (required for OSTP) Compression mode More aggressive compression modes can be used for asynchronous mirroring.
FCIP configuration guidelines 22 FCIP configuration guidelines FCIP configuration always involves two or more Extension Switches. The following should take place first before you configure a working FCIP connection from the Management application: • • • • • The WAN link should be provisioned and tested for integrity. Cabling within the data center should be completed. Equipment should be physically installed and powered on.
22 Configuring an FCIP tunnel Configuring an FCIP tunnel When you configure an FCIP extension connection, you create FCIP tunnels and FCIP circuits between two Extension Switches. 1. Select Configure > FCIP Tunnels. The FCIP Tunnels dialog box is displayed (Figure 431). . FIGURE 431 FCIP Tunnels dialog box (fabric selected from Products tree) The dialog box displays a tree structure of all FCIP-capable switches in the discovered fabrics, Extension Switches, and configured tunnels.
Configuring an FCIP tunnel 22 FIGURE 432 Add FCIP Tunnel dialog box c. Click Select Switch Two under Switch Two on the Add FCIP Tunnel dialog box to display the Select Switch dialog box. The Select Switch dialog box displays discovered Extension Switches. d. Select the switch you want to connect to switch one and click OK. The switch and fabric names display in the Switch Two area of the Add FCIP Tunnel dialog box. e. Select the desired tunnel ID from the Tunnel list.
22 Configuring an FCIP tunnel NOTE VEx ports are not supported on Brocade 7840. 3. Select the desired compression mode. A Standard option provides hardware compression. The 8 Gbps Extension Switch and the 8 Gbps Extension Blade provide three additional options for compression. The Moderate option enables a combination of hardware and software compression that provides more compression than hardware compression alone. This option supports up to 8 Gbps of FC traffic.
Configuring an FCIP tunnel 22 - Select L2CoS and DSCP priorities. Refer to “QOS, DSCP, and VLANs” on page 946 for more information. - Select OK to save the settings and close the dialog box. 5. To edit the configuration for an existing FCIP tunnel and circuits between two switches, follow these steps: a. From the FCIP Tunnels dialog box (refer to step 1), select the FCIP tunnel that you want to configure under the Products tree. b. Click Edit The Edit FCIP Tunnel dialog box displays.
22 Adding an FCIP circuit Adding an FCIP circuit When adding a new FCIP tunnel, you can add an FCIP circuit by selecting the Add button to the right of the Circuits properties table on the Add FCIP Tunnel dialog box (Figure 432 on page 959). For 8 Gbps platforms, you can add multiple FCIP circuits to the tunnel with this button. You can add circuits to existing FCIP tunnels through the Edit FCIP Tunnel dialog box.
Adding an FCIP circuit 22 2. Select Cross port circuit to configure the 10 GigE port on an 8 Gbps Blade platform as a 10 Gbps lossless failover circuit. 3. Select the IP Address Type. The implementation is a dual IP layer operation implementation as described in RFC 4213. IPv6 addresses can exist with IPv4 addresses on the same interface, but the FCIP circuits must be configured as IPv6 to IPv6 and IPv4 to IPv4 connections. IPv6-to-IPv4 connections are not supported.
22 Adding an FCIP circuit 8. The Metric list is used to identify a failover circuit. By assigning a non-zero metric (1), you identify the circuit as a failover circuit. By default, a circuit is assigned a metric of 0. If a metric 0 circuit fails, FCIP trunking tries first to retransmit any pending send traffic over another circuit with a metric of 0. If no circuits with a metric of 0 are available, then the pending send traffic is retransmitted over any available circuit with a metric of 1.
Adding an FCIP circuit 22 If you select Advanced Settings, the Transmission tab of the FCIP Circuit Advanced Settings dialog box displays (Figure 435). FIGURE 435 FCIP Circuit Advanced Settings dialog box - Clear the Selective Ack check box to disable selective acknowledgement. Do not clear the check box if your system does not support selective acknowledgement.. - Enter a value in the Keep Alive Time Out (ms) field to override the default value of 10000 ms.
22 Adding an FCIP circuit Logical switch function in the Add FCIP Circuit dialog box The display and function of circuits created on logical switches and with shared GigE ports varies on the Add FCIP Circuit dialog box according to the discovery of the default switch and user-configured logical switches as follows.
Configuring FCIP tunnel advanced settings 22 Configuring FCIP tunnel advanced settings Compression, FCIP fast write and tape pipelining, IPsec and IKE policies, and FICON emulation features are configured as advanced settings. 1. Click Advanced Settings on the Add FCIP Tunnel or Edit FCIP Tunnel dialog box. The Advanced Settings dialog box is displayed. This dialog box has a Transmission tab, a Security tab, and a FICON Emulation tab. 2.
22 Configuring FCIP tunnel advanced settings Configuring QoS percentages For 8 Gbps platforms, you can adjust Quality of Service (QoS) priority percentages from the preset default values of 50 percent (High), 30 percent (Medium), and 20 percent (Low). Values for the three priority levels must equal 100 percent. A minimum of 10 percent is required for each level. You can adjust percentages in increments of 1 percent. To configure QoS percentages, complete the following steps: 1.
Configuring FCIP tunnel advanced settings 22 5. Assign IKE and IPsec policies. For the 4 Gbps Extension Switch and Blade, you must choose from a list of policies. The 8 Gbps Extension Switch and Blade have predefined IKE and IPsec policies. These policies are enabled by selecting the Enable IPSec check box. Matching policies are applied to the remote switch. Note that the Enable IPSec check box is unavailable while editing the tunnels because the IPsec settings cannot be edited for the secured tunnels.
22 Configuring FCIP tunnel advanced settings FIGURE 437 Advanced Settings FICON Emulation Tab 3. Select the check boxes for the FICON emulation features you want to implement. The primary FICON emulation features are FICON XRC Emulation (IBM z/OS Global Mirror emulation), tape write pipelining, tape read pipelining, TIN/TUR emulation and device level ACK emulation provide support for the primary features.
Viewing FCIP connection properties 22 - FICON Tape Write Timer defines a time limit for pipelined write chains. This value is be specified in milliseconds (ms). If a pipelined write chain takes longer than this value to complete, the ending status for the next write chain will be withheld from the channel. This limits processing to what the network and device can support. Too small a value limits pipelining performance. Too large a value results in too much data being accepted for one device on a path.
22 Viewing General FCIP properties FIGURE 439 FCIP connection properties (default switch not discovered) Viewing General FCIP properties Use the following steps to view general FCIP properties for a switch or blade. 1. Right click an Extension Blade or Switch from the Fabric Tree structure or on the Connectivity Map, and select Properties. 2. Select the Properties tab.
Viewing General FCIP properties 22 FIGURE 440 General FCIP properties tab (Extension Switch or Blade) Use the following steps to view the properties of a chassis where an Extension Blade is installed. 1. Right click the chassis in the Switch group in Fabric Tree structure or on the Connectivity Map where the Extension Blade is installed, and select Properties. 2. Select the Properties tab.
22 Viewing FCIP port properties FIGURE 441 General FCIP properties tab (blade chassis) Viewing FCIP port properties Take the following steps to view FCIP FC. VE/VEX, and GbE port properties. 1. Right click an Extension Blade or Switch from the Fabric Tree structure or on the Connectivity Map, and select Properties. 2. Select the Port tab. 3. To view FC port information, select the FC from the Type drop-down list (Figure 442).
Viewing FCIP port properties 22 FIGURE 442 FC ports properties 4. To view VE and VEX port information, select the VE/VEx from the Type drop-down list (Figure 443). FIGURE 443 VE/VEx port properties 5. To view GbE (Ethernet) port information, select the GigE from the Type drop-down list (Figure 444).
22 Editing FCIP circuits FIGURE 444 GbE port properties Editing FCIP circuits FCIP circuit settings may be edited from the Edit FCIP Circuit dialog box. The procedure for launching this dialog box for the 4 Gbps Extension Switch and Blade is different than the procedure for the 8 Gbps Extension Switch and the 8 Gbps Extension Blade.
Disabling FCIP tunnels 22 2. Select a circuit that you want to edit from the Circuits properties table at the bottom of the dialog box and select Edit. The Edit FCIP Circuit dialog box displays (Figure 445). FIGURE 445 Edit FCIP Circuit dialog box 3. Fields and parameters are as described in “Adding an FCIP circuit”. You can edit all editable fields and parameters. Disabling FCIP tunnels 1. From the FCIP Tunnels dialog box, select the tunnel you want to disable. 2. Select Disable.
22 Deleting FCIP tunnels Deleting FCIP tunnels 1. From the FCIP Tunnels dialog box, select the tunnel you want to delete. 2. Select the Delete. A confirmation dialog box displays, warning you of the consequences of deleting a tunnel. 3. Click OK to delete the tunnel. Disabling FCIP circuits 1. From the FCIP Tunnels dialog box, select the tunnel that contains the circuit. 2. Select Edit. The Edit FCIP Tunnel dialog box displays. 3.
Displaying FCIP performance graphs 22 4. Select Delete. 5. For tunnels with multiple circuits, select additional circuits from the table to delete and select Delete after each selection. 6. Click OK to delete the circuit(s). Displaying FCIP performance graphs You can display performance graphs by clicking the Performance button on the FCIP Tunnels dialog box. You can also display performance graphs from Properties, as described in the following sections. Displaying performance graphs for FC ports 1.
22 Displaying tunnel properties from the FCIP tunnels dialog box Displaying tunnel properties from the FCIP tunnels dialog box Tunnel properties can be displayed from the FCIP Tunnels dialog box. 1. Select a tunnel from the FCIP tunnels dialog box. 2. Select the Tunnel tab. Tunnel properties are displayed.
Displaying FCIP circuit properties from the FCIP tunnels dialog box 22 Displaying FCIP circuit properties from the FCIP tunnels dialog box Tunnel properties can be displayed from the FCIP Tunnels dialog box using the following procedure. 1. Select a tunnel from the FCIP tunnels dialog box. 2. Select the Circuit tab. Circuit properties are displayed (Figure 447).
22 Displaying switch properties from the FCIP Tunnels dialog box Displaying switch properties from the FCIP Tunnels dialog box Switch properties are displayed on the FCIP Tunnels dialog box when you select a switch (Figure 448).
Displaying fabric properties from the FCIP Tunnels dialog box 22 Displaying fabric properties from the FCIP Tunnels dialog box Fabric properties are displayed on the FCIP Tunnels dialog box when you select a fabric. (Figure 449). FIGURE 449 Fabric properties on the FCIP Tunnels dialog box Troubleshooting FCIP Ethernet connections 1. Right-click a blade an Extension Blade or Switch from the Fabric Tree structure or Connectivity Map, and select Properties. 2. Select the Port tab. 3.
22 984 Troubleshooting FCIP Ethernet connections Brocade Network Advisor SAN User Manual 53-1003154-01
Chapter Fabric Binding 23 In this chapter • Fabric Binding overview . . . . . . . . . . . . . . . . . . . . . . . . . . . . . . . . . . . . . . . . 985 • High Integrity Fabric overview . . . . . . . . . . . . . . . . . . . . . . . . . . . . . . . . . . . . 990 Fabric Binding overview The fabric binding feature enables you to configure whether switches can merge with a selected fabric.
23 Fabric Binding overview FIGURE 450 Fabric Binding dialog box 2. Review the fabric binding membership details. • Fabric List table — Lists the fabrics in your network. Fabric Name — The name of the fabric. Fabric WWN — The world wide name of the fabric. Binding Status — The binding status (enabled/disabled) of the fabric. Enable/Disable check box — Indicates whether fabric binding is enabled. Select to enable a fabric binding for the fabric.
Fabric Binding overview 23 • Membership List of Fabric_Name table — The current Fabric Membership List (FML) of the highlighted fabric, including the following details: Name — The name of the switch fabric. Node WWN — The node WWN of an available or member switch. Domain ID — The domain ID of an available or member switch. Fabric Name — The name of the fabric. Fabric WWN — The world wide name of the fabric. Attached — Whether or not the switch is attached.
23 Fabric Binding overview 2. In the Fabric List table, select the Enable/Disable check box for fabrics for which you want to configure fabric binding. For instructions on adding and removing switches from the membership list, refer to “Adding switches to the fabric binding membership list” on page 989 and “Removing switches from fabric binding membership” on page 990. 3. Click OK on the Fabric Binding dialog box.
Fabric Binding overview 23 • List of possible reasons that could cause Fabric Binding failure message — Refer to the Fabric OS Administrator’s Guide for detailed information. Adding switches to the fabric binding membership list Once you have enabled fabric binding (refer to “Enabling fabric binding” on page 987), you can add switches to the fabric binding membership list. NOTE Fabric binding is only supported on Fabric OS 5.2 or later. To add a switch to the fabric, complete the following steps. 1.
23 High Integrity Fabric overview Removing switches from fabric binding membership Once you have enabled fabric binding (refer to “Enabling fabric binding” on page 987), you can remove switches that are not part of the fabric from the membership list. NOTE Fabric binding is only supported on Fabric OS 5.2 or later. 1. Select Configure > Fabric Binding. The Fabric Binding dialog box displays (Figure 450). 2.
High Integrity Fabric overview 23 • A policy must be set that limits connectivity to only the switches within the same fabric. Fabric binding is a security method for restricting switches that may join a fabric. For Fabric OS switches, fabric binding is implemented by defining a Switch Connection Control (SCC) policy that prevents unauthorized switches from joining a fabric. • Dynamic Load Sharing (DLS) should be disabled.
23 High Integrity Fabric overview Deactivating high integrity fabrics NOTE Deactivating high integrity fabrics is not supported in a pure Fabric OS environment. NOTE A warning message is displayed when you disable HIF mode. To deactivate a HIF, complete the following steps. 1. Select Configure > High Integrity Fabric. The High Integrity Fabric dialog box displays (Figure 451). 2. Select the fabric on which you want to deactivate HIF from the Fabric Name list.
Chapter 24 Port Fencing In this chapter • About port fencing . . . . . . . . . . . . . . . . . . . . . . . . . . . . . . . . . . . . . . . . . . . . . 993 • Thresholds . . . . . . . . . . . . . . . . . . . . . . . . . . . . . . . . . . . . . . . . . . . . . . . . . . . 996 • Adding thresholds . . . . . . . . . . . . . . . . . . . . . . . . . . . . . . . . . . . . . . . . . . . . . 999 • Editing thresholds . . . . . . . . . . . . . . . . . . . . . . . . . . . . . . . . . . . . . . . . . . .
24 About port fencing Viewing port fencing configurations NOTE This feature is only available for Fabric OS devices. NOTE This feature requires a Trial or Licensed version. Port Fencing allows you to protect your SAN from repeated operational problems experienced by ports. Use Port Fencing to set threshold limits for the number of specific port events permitted during a given time period on the selected object.
About port fencing 24 • Thresholds table — List of configured thresholds based on the threshold type selected in the Violation Type list. Limit (Fabric OS) — The number of events allowed for the assigned threshold. If the object has no fencing support or no fencing changes, this field displays two hyphens separated by a space (- -). When the object is only partially managed by the management application, this field displays as inactive (grayed-out).
24 Thresholds Period (Fabric OS) — The time limit (in seconds or minutes) for the assigned threshold. This field displays as inactive (grayed-out) when the object is only partially managed by the management application. Operational State — The operational state of the port. Blocked Configuration — The current configuration of the port (Blocked or Unblocked). Port WWN — The port world wide name of the port. Connected Product — The device label of the connected object.
Thresholds 24 C3 Discard Frames threshold NOTE This threshold is only available for Fabric OS devices running 6.3 or later. Use this type of threshold to block a port when a C3 Discard Frames violation meets the Fabric OS switch threshold. This threshold is only supported on directors, switches, and blades with a 4 Gbps, 8 Gbps, or 16 Gbps ASIC.
24 Thresholds Invalid CRCs threshold NOTE This threshold is only available for Fabric OS devices. Use this type of threshold to block a port when an Invalid CRCs violation meets the Fabric OS switch threshold. Invalid words threshold NOTE This threshold is only available for Fabric OS devices. Use this type of threshold to block a port when an Invalid Words violation meets the Fabric OS switch threshold. Link Reset threshold NOTE This threshold is only available for Fabric OS devices.
Adding thresholds 24 Adding thresholds NOTE This feature requires a Trial or Licensed version. The Management application allows you to create Invalid CRCs, Invalid words, Link, Link Reset, Protocol Error, Security, and Sync Loss thresholds. Adding a C3 Discard Frames threshold NOTE This threshold is only available for Fabric OS devices running 6.3 or later. Use to block a port when a C3 Discard Frames violation type meets the Fabric OS switch threshold.
24 Adding thresholds FIGURE 454 Add C3 Discard Frames Threshold dialog box 4. Enter a name for the threshold in the Name field. 5. Select one of the following options: • Default — Uses device defaults. Go to step 8. • Custom — Uses your selections. Continue with step 6. 6. Enter the number of C3 discarded frames allowed for the threshold in the Threshold errors field. 7. Select the time period for the threshold from the errors per list.
Adding thresholds 24 Adding an Invalid CRCs threshold NOTE This threshold is only available for Fabric OS devices. NOTE This feature requires a Trial or Licensed version. Use to block a port when an Invalid CRC violation type meets the Fabric OS switch threshold. For default threshold values for Fabric OS devices, refer to Chapter 7 of the Fabric Watch Administrator's Guide. To add an Invalid CRCs threshold, complete the following steps. 1. Select Monitor > Fabric Watch > Port Fencing.
24 Adding thresholds 8. Click OK to add the Invalid CRCs threshold to the table and close the Add Invalid CRCs Threshold dialog box. To assign this threshold to fabrics, switches, or switch ports, refer to “Assigning thresholds” on page 1007. 9. Click OK on the Port Fencing dialog box. Adding an Invalid Words threshold NOTE This threshold is only available for Fabric OS devices. NOTE This feature requires a Trial or Licensed version.
Adding thresholds 24 • Minute — the port is blocked as soon as the specified number of invalid words allowed is reached within a minute. • Hour — the port is blocked as soon as the specified number of invalid words allowed is reached within a hour. • Day — the port is blocked as soon as the specified number of invalid words allowed is reached within a day. 8. Click OK to add the Invalid Words threshold to the table and close the Add Invalid Words Threshold dialog box.
24 Adding thresholds 7. Select the time period for the threshold from the errors per list. The following choices are available: • None — the port is blocked as soon as the specified number of link resets allowed is met. • Second — the port is blocked as soon as the specified number of link resets allowed is reached within a second. • Minute — the port is blocked as soon as the specified number of link resets allowed is reached within a minute.
Adding thresholds 24 FIGURE 458 Add Protocol Error Threshold dialog box 4. Enter a name for the threshold in the Name field. 5. Select the Fabric OS check box. a. Select one of the following options: • Default — Uses device defaults. Go to step 6. • Custom — Uses your selections. Continue with step b. b. Enter the number of protocol errors allowed for the threshold from the Threshold errors field. c. Select the time period for the threshold from the errors per list.
24 Adding thresholds Adding a State Change threshold NOTE This threshold is only available for Fabric OS devices running 6.3 or later. NOTE This feature requires a Trial or Licensed version. Use to block a port when a state change violation type meets the Fabric OS switch threshold. For 4 Gbps Router, Extension Switches and Blades only, when you apply this threshold on an E Port, the threshold is also applied to the VE Ports (internally by Fabric OS).
Adding thresholds 24 • Hour — the port is blocked as soon as the specified number of state changes allowed is reached within a hour. • Day — the port is blocked as soon as the specified number of state changes allowed is reached within a day. 8. Click OK to add the state changes threshold to the table and close the Add State Change Threshold dialog box. To assign this threshold to fabrics, switches, or switch ports, refer to “Assigning thresholds” on page 1007. 9. Click OK on the Port Fencing dialog box.
24 Adding thresholds Unblocking a port The Management application allows you to unblock a port (only if it was blocked by Port Fencing) once the problem that triggered the threshold is fixed. When a port is blocked an Attention icon ( ) displays next to the port node. To unblock a port, complete the following steps. 1. Select Monitor > Fabric Watch > Port Fencing. The Port Fencing dialog box displays. 2. Right-click anywhere in the Ports table and select Expand. 3.
Editing thresholds 24 Editing thresholds The Management application allows you to edit the name, number of events needed, and time period of ISL Protocol, Link, and Security thresholds. Editing a C3 Discard Frames threshold NOTE This threshold is only available for Fabric OS devices. NOTE This feature requires a Trial or Licensed version. Use to block a port when a C3 Discard Frames violation type meets the Fabric OS switch threshold. To edit a C3 Discard Frames threshold, complete the following steps.
24 Editing thresholds 3. Select the threshold you want to change and click Edit. The Edit Invalid CRCs Threshold dialog box displays. 4. Complete step 4 through step 7 in “Adding an Invalid CRCs threshold” on page 1001. 5. Click OK on the Edit Invalid CRCs Threshold dialog box. If the threshold has already been assigned to ports, an “Are you sure you want to make the requested changes to this threshold on “X” ports?” message displays. Click OK to close.
Editing thresholds 24 Editing a Link Reset threshold NOTE This threshold is only available for Fabric OS devices. NOTE This feature requires a Trial or Licensed version. Use to block a port when the Link Reset violation type meets the Fabric OS switch threshold. To edit a Link Reset threshold, complete the following steps. 1. Select Monitor > Fabric Watch > Port Fencing. The Port Fencing dialog box displays. 2. Select Link Reset (Fabric OS only) from the Violation Type list. 3.
24 Editing thresholds 3. Select the threshold you want to change and click Edit. The Edit Protocol Error Threshold dialog box displays. 4. Complete step 4 through step 5 in “Adding a Protocol Error threshold” on page 1004. 5. Click OK on the Edit Protocol Error Threshold dialog box. If the threshold has already been assigned to ports, an “Are you sure you want to make the requested changes to this threshold on “X” ports?” message displays. Click OK to close.
Editing thresholds 24 Finding assigned thresholds The Management application allows you to find all ports with a specific threshold applied. NOTE This search is performed on the threshold name. Since Fabric OS devices do not retain the threshold name, the ability to search for a threshold on a Fabric OS device is not available in most cases. To find assigned thresholds, complete the following steps. 1. Select Monitor > Fabric Watch > Port Fencing. The Port Fencing dialog box displays. 2.
24 Removing thresholds 4. Review the Thresholds table. • • • • • • • • • # (Number) — The line number for each threshold in the table. Status — The threshold status. Directly Assigned Indicator — Whether or not the threshold was directly assigned. Name — The threshold name. Limit — The number of events required to trigger the threshold. Period — The time limit required (for the number of events) to trigger a port blocking action. Area — The threshold type. Class — The port type.
Removing thresholds If an inherited threshold replaces the removed threshold, an added icon ( every instance where the threshold was replaced. 24 ) displays next to A directly assigned icon ( ) displays next to each object with an assigned threshold which does not inherit a threshold from higher in the tree. NOTE If you remove a threshold from All Fabrics, it removes the threshold from individual Fabrics, switches, and switch ports in all Fabrics except for a Chassis group.
24 1016 Removing thresholds Brocade Network Advisor SAN User Manual 53-1003154-01
Chapter FICON Environments 25 In this chapter • FICON configurations . . . . . . . . . . . . . . . . . . . . . . . . . . . . . . . . . . . . . . . . . 1017 • Configuring a switch for FICON operation . . . . . . . . . . . . . . . . . . . . . . . . . 1018 • Configuring an Allow/Prohibit Matrix . . . . . . . . . . . . . . . . . . . . . . . . . . . . 1025 • Configuring an Allow/Prohibit Matrix manually . . . . . . . . . . . . . . . . . . . . .
25 Configuring a switch for FICON operation FIGURE 461 Cascaded configuration, three domains, but only two in a path Configuring a switch for FICON operation This section provides a basic guide for configuring a switch for FICON operation. Procedures assume that the switch is installed and IP addresses are assigned to the switch for discovery and access by the Management application.
Configuring a switch for FICON operation 25 Observe the following best practices: • Always check the version of firmware on a switch • Unless otherwise advised by a certified Fabric OS support professional, always load the most recently qualified firmware. • Before upgrading or downgrading firmware read the upgrade and downgrade considerations in the firmware release notes. 4. If incorporating more than one switch into a fabric, refer to planning steps in “Cascaded FICON fabric” on page 1033. 5.
25 Configuring a switch for FICON operation • Required firmware for the switch. Refer to step 3. • Port addressing. The port address is important because it is implemented in HCD or IOCP. The easiest port addressing scheme is to start from 0x00 at the bottom left of the port card, increment on ports going up the card, then continue starting numbering from the bottom right of the next column of ports. Any port addressing scheme is possible however. 6.
Configuring a switch for FICON operation 25 • Add information for the switch in the IP Address tab and click OK. FIGURE 462 Add Fabric Discovery dialog box (IP Address tab) NOTE Selecting Automatic to use the SNMPv3 profile is recommended. • To manually configure SNMP for discovery, select Manual to activate the SNMP tab, then select the SNMP tab. Fill out the fields as required. .
25 Configuring a switch for FICON operation d. Click Add License. e. Repeat steps b through d for additional licenses. f. Click Refresh to display new licenses in the License tab. 8. As an optional step, manage switch users by selecting the User tab on the Web Works Switch Administration window. Use this tab to add users, change passwords, or perform other steps to manage switch users.
Configuring a switch for FICON operation 25 FIGURE 465 Firmware download 11. Select the switches in the Available Switches panel where you want to download firmware, and then click the right arrow to move them under Selected Switches. 12. Click Download. 13. Select the Repository tab to import new firmware files for downloads. Refer to the “Firmware management” section in Chapter 12, “SAN Device Configuration” for more information on importing firmware. 14.
25 Configuring a switch for FICON operation 18. Define port fencing parameters for the switch using the following steps (optional): NOTE Although this is an optional step, best practice is to configure port fencing. a. Configure thresholds that you require for the switch using steps under the “Adding thresholds” in Chapter 24, “Port Fencing”. Following are recommend parameters for the various thresholds: • C3 Discard Frames = 2 per minute. • Invalid Words = 25 per minute.
Configuring FICON display 25 23. Enable bottleneck detection using the following Fabric OS bottlneckmon commands: • bottleneckmon --cfgcredittools -intport -recover onLrOnly - This command monitors for lost credits on links. This is necessary because occasional errors on links can cause lost credits that can result in IFCCs and poor performance over time.
25 Configuring an Allow/Prohibit Matrix • Double-click a configuration file. • Select a configuration file and click the right arrow. A matrix displays in the Allow/Prohibit Matrix panel. The switch ports are displayed on both the vertical axis and horizontal axis. An Allow icon ( ) indicates communication is allowed between the ports, as shown in Figure 466 on page 1026. FIGURE 466 Active Configuration in Allow/Prohibit Matrix panel 4.
Configuring an Allow/Prohibit Matrix manually 25 Configuring an Allow/Prohibit Matrix manually To configure to allow or prohibit communication between specific ports manually, complete the following steps. 1. Select Configure > Allow/Prohibit Matrix. The Configure Allow/Prohibit Matrix dialog box displays. 2. Select a switch from Available Switches. Two default configurations (Active and IPL) are displayed in a tree structure under the switch. Existing configurations are also displayed. 3.
25 Saving or copying Allow/Prohibit Matrix configurations to another device To delete any of these manual configurations, select the configuration you want to delete in the Selected Ports for Modification list and click Remove. The Selected Ports for Modification list displays the following information: • Port Address 1 column — The port number of the first port for which you want to allow or prohibit communication.
Saving or copying Allow/Prohibit Matrix configurations to another device 25 Copying an Allow/Prohibit Matrix configuration To duplicate an existing Allow/Prohibit Matrix configuration, complete the following steps. 1. Select Configure > Allow/Prohibit Matrix. The Configure Allow/Prohibit Matrix dialog box displays. 2. Select the Allow/Prohibit Matrix configuration you want to copy.
25 Saving or copying Allow/Prohibit Matrix configurations to another device Saving an Allow/Prohibit Matrix configuration to another device To save an existing Allow/Prohibit Matrix configuration to another device, complete the following steps. 1. Select Configure > Allow/Prohibit Matrix. The Configure Allow/Prohibit Matrix dialog box displays. 2. Select the Allow/Prohibit Matrix configuration you want to save.
Activating an Allow/Prohibit Matrix configuration 25 Activating an Allow/Prohibit Matrix configuration You must have an active zone configuration before you can activate an Allow/Prohibit Matrix configuration. 1. Select Configure > Allow/Prohibit Matrix. The Configure Allow/Prohibit Matrix dialog box displays. 2. Select the Allow/Prohibit Matrix configuration you want to activate.
25 Deleting an Allow/Prohibit Matrix configuration Deleting an Allow/Prohibit Matrix configuration You cannot delete the active configuration, the IPL configuration, or a configuration that is marked as having uncommitted changes. 1. Select Configure > Allow/Prohibit Matrix. The Configure Allow/Prohibit Matrix dialog box displays. 2. Select the Allow/Prohibit Matrix configuration you want to delete.
Cascaded FICON fabric 25 Cascaded FICON fabric NOTE You must have FICON Management privileges to configure a fabric for cascaded FICON. NOTE If HIF mode is not enabled and the FMS mode is deployed, then the fabric will set the HIF key. The Management application enables you to easily configure a fabric for cascaded FICON. Note that configuring a fabric for cascaded FICON may be disruptive to current I/O operations in the fabric, as this involves disabling and enabling the switches in the fabric.
25 Cascaded FICON fabric Configuring a cascaded FICON fabric The FICON wizard automatically creates HIFC settings that support a cascaded FICON fabric. 1. Select Configure > FICON > Configure Fabric or right-click a fabric in the product tree and select FICON > Configure Fabric. The Configure Cascaded FICON Fabric screen of the FICON Configuration dialog box displays, as shown in Figure 471. FIGURE 471 Configure Cascaded FICON Fabric /Switch dialog box 2.
Cascaded FICON fabric 25 5. Select the DLS check box to enable Dynamic Load Sharing (DLS) or Lossless DLS only on switches that support lossless DLS. For more information, refer to “Enabling DLS” on page 1035. You must enable DLS to select routing policies. 6. Select one of the following options to enable port-based, exchange-based, or device-based routing on switches: • Port-Based enables port-based routing on 4 Gbps platform switches.
25 Cascaded FICON fabric merge Cascaded FICON fabric merge The Management application provides a wizard to help you merge two fabrics for cascaded FICON. Note that merging two cascaded FICON fabrics may be disruptive to current I/O operations in both fabrics as this involves disabling and enabling the switches in both fabrics. The merge process will not make any configuration changes on the primary (production) fabric that are disruptive.
Cascaded FICON fabric merge 25 • (Optional) Configures long distance settings on selected ports of primary and secondary fabrics (requires an Extended Fabric license). NOTE If the distance between the merged fabrics is 10 km or greater, you must configure the connection as a long distance connection. Note that the merge wizard does not enable primary fabric switches for DLS, In-Order Delivery (IOD), insistent domain ID flag (IDID), and Advanced Performance Tuning (APT).
25 Cascaded FICON fabric merge Merging two cascaded FICON fabrics If you want to join two cascaded FICON fabrics, they must be merged. If the distance between fabrics is 10 km or more, an Extended Fabrics license is required, and an extra step is required to configure the connection as a long distance connection. To successfully configure a long distance connection, use the same E_Ports and cable distance values used when configuring Extended Fabrics.
Cascaded FICON fabric merge 7. 25 Select a secondary fabric where AD, ACL, and zone databases, if defined, will be cleared. 8. Read the bulleted list of actions so you understand the actions that are taken to avoid conflicts when the fabrics are merged. 9. Click Next. The Check merge screen displays. A Status details table shows progress through merge check points. A rotating arrow under Status indicates a merge check step is in progress.
25 Cascaded FICON fabric merge Resolving merge conflicts You can resolve the following types of switch configuration conflicts: • • • • Domain ID TOV Buffer To Buffer Credit Disable Device Probe NOTE This test will be skipped if all primary and secondary fabric switches are found to be running Fabric OS 7.0 and later. • • • • • • Route Priority Per Frame Sequence Level Switching Suppress Class F Long Distance Setting Data Field Size VC Priority Note that not all tests support resolution.
Port groups 25 4. Repeat step 1 through step 3 until all resolvable tests pass. 5. Perform step 12 through step 15 of the procedure “Merging two cascaded FICON fabrics” on page 1038 to finish resolving a merge conflict. Port groups A port group is a group of FC ports from one or more switches within the same fabric. Port groups are user-specific; you can only view and manage port groups that you create. The ports display in the order in which you add them to the port group.
25 Port groups FIGURE 472 Port Groups dialog box 2. Click New. 3. Enter a name for the port group in the Name field. 4. Enter a description for the port group in the Description field. 5. Select one or more ports to add to the group in the Group Type - FC Ports list. A port group must have at least one port in the Membership List. All ports must be from switches in the same fabric. 6. Click the right arrow button. The selected ports display in the Membership List. 7. Click Update.
Port groups 25 Viewing port groups To view port groups, complete the following steps. 1. Select Configure > Port Groups. The Port Groups dialog box displays only port groups defined by you. If a fabric becomes un-monitored, any port groups associated with that fabric do not display in the Port Groups list. Once the fabric becomes monitored again, the associated port groups display in the Port Groups list.
25 Swapping blades 8. Click the left arrow button. The selected ports are removed from the Membership List. 9. Click Update. 10. Click OK. Deleting a port group To delete a port group, complete the following steps. 1. Select Configure > Port Groups. The Port Groups dialog box displays. 2. Select the port group you want to delete in the Port Groups list. 3. Click Remove. The selected ports are removed from the Port Groups list. 4. Click OK.
Swapping blades 25 1. Select a chassis that contains at least two of the same type of blades. 2. Select Configure > Switch > Swap Blades. The Swap Blades dialog box displays. 3. Select the blade you want to replace from the first Swap Blades list. Once you select a blade, the second list automatically filters out the selected blade and any blade types that do not match the selected blade. 4. Select the blade with which you want to replace the first blade from the second Swap Blades list. 5.
25 1046 Swapping blades Brocade Network Advisor SAN User Manual 53-1003154-01
Chapter 26 Deployment Manager In this chapter • Introduction to the Deployment Manager . . . . . . . . . . . . . . . . . . . . . . . . . • Editing a deployment configuration . . . . . . . . . . . . . . . . . . . . . . . . . . . . . • Duplicating a deployment configuration . . . . . . . . . . . . . . . . . . . . . . . . . • Deleting a deployment configuration . . . . . . . . . . . . . . . . . . . . . . . . . . . . • Deploying a configuration . . . . . . . . . . . . . . . . . . . . . . . . . . . . . . . .
26 Editing a deployment configuration Editing a deployment configuration 1. Select Configure > Task Scheduler. The Task Scheduler dialog box displays, as shown in Figure 473. FIGURE 473 Task Scheduler dialog box 2. Select a deployment configuration in the Saved or Scheduled tab. Policy-based routing configurations cannot be edited. 3. Click Edit. A dialog box specific to the type of deployment displays. This is the same dialog box that was used when the deployment was created. 4.
Duplicating a deployment configuration 26 Duplicating a deployment configuration 1. Select Configure > Task Scheduler. The Task Scheduler dialog box displays. 2. Select a deployment configuration in the Saved or Scheduled tab. NOTE VLAN configurations and policy-based routing configurations cannot be duplicated. 3. Click Duplicate. A dialog box specific to the type of deployment displays. This is the same dialog box that was used when the original deployment was created. 4.
26 Viewing deployment logs Viewing deployment logs 1. Select Configure > Task Scheduler. The Task Scheduler dialog box displays. 2. Click the Log tab. A list of deployment configurations that are executed and the status of each displays. Generating a deployment report 1. Select Configure > Task Scheduler. The Task Scheduler dialog box displays. 2. Select a deployment in the Saved, Scheduled, or Log tab. 3. Click Report. An HTML report displays.
Searching the configuration snapshots 26 Searching the configuration snapshots 1. Select Configure > Task Scheduler. The Task Scheduler dialog box displays. 2. Select a deployment in the Saved, Scheduled, or Log tab. 3. Click Snapshot. The Configuration Snapshot Search dialog box displays. 4. Identify the targets you want to search. Select a target in the Available Targets list and click the right arrow to move the target to the Selected Targets list. 5. Define search criteria.
26 1052 Searching the configuration snapshots Brocade Network Advisor SAN User Manual 53-1003154-01
Chapter Fibre Channel Troubleshooting 27 In this chapter • FC troubleshooting . . . . . . . . . . . . . . . . . . . . . . . . . . . . . . . . . . . . . . . . . . 1053 • FCIP troubleshooting . . . . . . . . . . . . . . . . . . . . . . . . . . . . . . . . . . . . . . . . . 1062 FC troubleshooting NOTE FC troubleshooting is only available for Fabric OS devices.
27 FC troubleshooting Tracing FC routes The Management application enables you to select a source port and a destination port and displays the detailed routing information from the source port or area on the local switch to the destination port or area on another switch. NOTE Trace route cannot be performed on offline devices. NOTE Trace route cannot be performed in a mixed (Fabric OS) fabric. Fabric OS trace route requirements • Fabric OS trace route is only supported in a pure-Fabric OS fabric.
FC troubleshooting 27 • Trace Route Summary — This table shows a brief summary of the trace including the following: Port WWN Port Name FC Address Switch Name (Fabric OS only) Whether ping was successful (Fabric OS only) (Fabric OS only) Round trip time (minimum, maximum, and average) (Fabric OS only) Whether the device ports are in active zones.
27 FC troubleshooting Troubleshooting device connectivity To troubleshoot device connectivity, complete the following steps. 1. Select Monitor > Troubleshooting > FC > Device Connectivity. The Device Connectivity Troubleshooting dialog box displays. 2.
FC troubleshooting 27 Adding a detached device To add a detached device to the Selected Device Ports table, complete the following steps. 1. Select Monitor > Troubleshooting > FC > Device Connectivity. The Device Connectivity Troubleshooting dialog box displays. 2. Click Add Detached. 3. Enter the port WWN of the detached device port in the Port WWN field. 4. Click OK. Confirming Fabric Device Sharing NOTE Fabric device sharing is only available with Trial or Licensed version.
27 FC troubleshooting Troubleshooting port diagnostics This feature allows you to run a diagnostic port test and a link traffic test on the selected ports. Port diagnostics requirements • Only supported on devices with 10 Gbps-capable D-ports or E-ports running Fabric OS 7.0 or later. The source and destinationports must be the same. • Only supported on devices with 16 Gbps-capable E-ports running Fabric OS 7.0 or later.
FC troubleshooting 27 5. Click Start. The Management application performs the following operations to enable diagnostic mode on the selected ports: 1. Disable the source port. 2. Disable the destination port. 3. Enable the diagnostic mode on source E-port. 4. Enable the diagnostic mode on destination E-port. 5. Enable the source port. 6. Enable the destination port.
27 FC troubleshooting The Status Details of the Selected Row table displays with the details of the port selected for diagnosis, the details of the tests performed, the results of the test, as well as short description of the test results. The following table details the messages that display depending on the success or failure of the operations and tests.
FC troubleshooting TABLE 80 27 Status Detail messages Operation/Test Possible message Distance between ports Approximate distance between the ports is numerical_value meters. Reverse Optical Loopback Test Successfully completed Reverse Optical Loopback Test. Reverse Optical Loopback Test failed. Roundtrip link latency Roundtrip link latency: numerical_value nano-seconds. Buffers required Buffers required: numerical_value Link Traffic Test Configuration used No.
27 FCIP troubleshooting 4. Choose one of the following options in the Payload Pattern area to configure the payload pattern to use in the traffic test • Select the Predefined option and select a pre-defined payload patteren from the list. Options include BYTE_NOT, WORD_NOT, QUAD_NOT, BYTE_RAMP, WORD_RAMP, QUAD_RAMP, BYTE_LFSR, RANDOM, CRPAT, CSPAT, CHALF_SQ, CQTR_SQ, RDRAM_PAT, jCRPAT, jCJTPAT, jCSPAT, PRED_RAND, SMI_TEST, CJPAT, QUAD_NOTP, JSPAT, and JTSPAT.
FCIP troubleshooting 27 1. Select Monitor > Troubleshooting > FCIP > Ping. The IP Ping dialog box displays. 2. Select a switch from the Available Switches table. 3. Select a port from the GigE Port list. 4. Select an IP address switch from the IP Interface list. 5. Enter the remote IP address in the Remote IP Address field. 6. Click OK. Ping sends four Internet Control Message Protocol (ICMP) Ping packets to the destination address and records the time until a response.
27 FCIP troubleshooting TABLE 82 7. IP Ping Details Field or Component Description Round Trip Time (ms) The time in milliseconds between sending the packet and receiving the response. This provides a rough indication of network congestion or latency. It is normal for the first packet to experience a higher round trip time than later packets, if the intermediate routers need to do ARP requests to locate the next hop. Time To Live (hops) The number of hops remaining in the received response.
FCIP troubleshooting TABLE 83 7. 27 IP Trace Details Field or Component Description Hop Number The TTL inserted in the transmitted probe packet. IP Address 1 The IP address of the system that responded to the first of the three probes, or 0.0.0.0 if there was no response. IP Address 2 The IP address of the system that responded to the second of the three probes, or 0.0.0.0 if there was no response. IP Address 3 The IP address of the system that responded to the third of the three probes, or 0.
27 FCIP troubleshooting IP Performance sends dummy data as fast as possible to the remote IP address and measures how much data can be sent over a given interval. IP Performance attempts to saturate the network link to see how much bandwidth is available. It will display the media link bandwidth only if no other traffic is flowing. The remote IP address must belong to a managed switch so that IP Performance can set up the receiving end on the remote switch.
Chapter 28 Performance Data In this chapter • SAN performance overview. . . . . . . . . . . . . . . . . . . . . . . . . . . . . . . . . . . . • SAN real-time performance data . . . . . . . . . . . . . . . . . . . . . . . . . . . . . . . . • SAN historical performance data . . . . . . . . . . . . . . . . . . . . . . . . . . . . . . . . • SAN end-to-end monitoring. . . . . . . . . . . . . . . . . . . . . . . . . . . . . . . . . . . . • SAN Top Talker monitoring . . . . . . . . . . . . . . . . . . . . . . .
28 SAN performance overview • Select a granularity for collecting data: - 5 minutes for last 8 days. - 30 minutes granularity for last 14 days - 2 hour granularity for last 30 days - 1 day granularity for last 730 days. • Provide enhanced performance reports. SAN performance measures Performance measures enable you to select one or more measures to define the graph or report. The measures available to you depend on the object type from which you want to gather performance data.
SAN performance overview • • • • • • • • • • • • • • • • • • • • • • • • • • • • • • • • • • Tx Link Resets — Available for FC ports. • • • • Dropped Frames — Available for managed HBA ports and managed CNA ports. 28 C3 Discard — Available for FC ports. C3 Discard RX Timeout — Available for FC ports C3 Discard Tx Timeout — Available for FC ports C3 Discard Unreachable — Available for FC ports. C3 Discard Others — Available for FC ports. Encode Error out — Available for FC ports.
28 SAN performance overview NOTE Under Sized Frames, Over Sized Frames, Bad EOF Frames, Dropped Frames, and Non Frame Coding Error measures are not supported for managed HBA and CNA ports on Emulex Adapters. SAN performance management requirements To collect performance data, make sure the following requirements have been met: • Make sure the SNMP access control list for the device is empty or the Management application server IP is in the access control list.
SAN performance overview 28 Trap recipient Severity level: 4 Community 4: public (ro) Trap recipient: 2.168.102.41 Trap port: 162 Trap recipient Severity level: 4 Community 5: common (ro) Trap recipient: 10.32.150.116 Trap port: 162 Trap recipient Severity level: 4 Community 6: FibreChannel (ro) Trap recipient: 1001:0:0:0:0:0:0:172 Trap port: 162 Trap recipient Severity level: 4 - To set the SNMP v1 credentials on the device, use the snmpconfig --set snmpv1 command.
28 SAN performance overview Priv User Auth Priv - Protocol: noPriv 6 (ro): admin Protocol: noAuth Protocol: noPriv To set the SNMP v3 credentials on the device, use the snmpconfig --set snmpv3 command. FM_4100_21:admin> snmpconfig --set snmpv3 SNMPv3 user configuration(SNMP users not configured in Fabric OS user database will have physical AD and admin role as the default): User (rw): [snmpadmin1] admin Auth Protocol [MD5(1)/SHA(2)/noAuth(3)]: (1..
SAN performance overview 28 3. Click Edit. The AddFabric Discovery dialog box displays. 4. Select the Manual option to view SNMP credentials. 5. Click the SNMP tab. 6. Select v1 or v3 from the SNMP Version list. 7. Make sure SNMP credentials match those on the device. 8. Click OK on the AddFabric Discovery dialog box. 9. Click Close on the Discover Fabrics dialog box. - To set SNMP credentials in the Management application, refer to “Discovery” on page 35.
28 SAN real-time performance data Example of Fabric OS user verification sw1:FID128:admin> userconfig --show Account name: admin Description: Administrator Enabled: Yes Password Last Change Date: Unknown Password Expiration Date: Not Applicable Locked: No Home LF Role: admin Role-LF List: admin: 1-128 Chassis Role: admin Home LF: 128 - Make sure I/O is running on the switch to obtain real statistics.
SAN real-time performance data 28 1. Select the fabric, device, or port for which you want to generate a performance graph. Right-click and select Performance > Real-Time Graph/Table or select Monitor > Performance > Real-Time Graph. The Real Time Graphs/Tables dialog box displays. If you selected a port, the Real Time Performance Graphs dialog box for the selected port displays.
28 SAN real-time performance data NOTE Devices with 10 GbE ports must be running Fabric OS 6.4.1 or later to obtain the correct TE_Port statistics (TX/RX). NOTE Devices with 10 GbE ports must have the RMON MIB enabled on the switch. For more information about the rmon collection command, refer to the Fabric OS Converged Enhanced Ethernet Command Reference.
SAN real-time performance data 28 6. Select Plot Events to display advanced monitoring service (AMS) violation events received during the chart time range and Master Log events logged on the same product as the measure being plotted. 7. Move the Row Height slider to the left to make the row height smaller or to the right to make it larger. 8. Select the Display tabular data only check box to show only text with no graphs or icons. The Source and Destination icons and the Graph column do not display. 9.
28 SAN historical performance data 4. Enter a name for the file and click Save. Clearing port counters To reset all port statistics counters to zero on a selected device or fabric, complete the following steps. 1. Right-click a device or a fabric on the Connectivity Map or Product List and select Monitor > Performance > Clear Counters. An attention message displays. 2. Click Yes on the message.
SAN historical performance data 28 Enabling SAN-wide historical performance collection To enable historical performance collection, select Monitor > Performance > Historical Data Collection. The Fabric Selector dialog box displays with Enable SAN Wide enabled by default. This enables historical performance data collection for all fabrics in the SAN. NOTE After enabling historical data collection, information for switches, ports, and FCIP tunnels also displays in the IP Historical Graph/Tables dialog box.
28 SAN historical performance data 5. Select the Include newly discovered fabrics check box to automatically add all newly discovered fabrics to the Selected list. 6. Click OK. Historical performance data collection is enabled for all selected fabrics. NOTE After enabling historical data collection, information for switches, ports, and FCIP tunnels also displays in the IP Historical Graph/Tables dialog box. If available, click the IP tab, then select Monitor > Performance > Historical Graphs/Tables.
SAN historical performance data 28 Disabling historical performance collection Perform the following steps to disable historical performance collection on all fabrics. 1. Select Monitor > Performance > Historical Data Collection. The Fabric Selector dialog box displays. 2. Select Disable All. Historical performance data collection is disabled for all fabrics in the SAN.
28 SAN historical performance data 3. Select a default or custom-saved port and time from the Favorites list or filter the historical data by completing the following steps. a. Select the number of results to display from the Display list. b. Select the type of port from which you want to gather performance data from the From list. NOTE Devices with 10GE ports must be running Fabric OS 6.4.1 or later to obtain the correct TE port statistics (TX/RX).
SAN historical performance data 28 The Source and Destination icons and the Graph column do not display. j. Add flow button - Select any of the column and click Add Flow to create Add flow defintion. For more information, refer to “Provisioning flows” on page 1816 k. Click Apply. The selected graph automatically displays in the Historical Performance Graph dialog box, if you do not select the Display tabular data only check box.
28 SAN historical performance data • Select Print to print the graph. Filtering data by ports To filter data for a historical performance graph by ports, complete the following steps. 1. Select Custom from the From list on the Historical Performance Graph dialog box. The Custom Port Selector dialog box displays. 2. Select the type of ports from the Show list, as shown in Figure 478 on page 1084. FIGURE 478 Custom Port Selector dialog box 3.
SAN historical performance data 28 1. Click Monitor > Performance > Historical Graph. The Historical Performance Graph dialog box displays. 2. Select Custom from the For list. The Custom Time Frame dialog box displays as shown in Figure 479 on page 1085. Perform one of the following steps: • Select the Last option and enter the number of minutes, hours, or days that you want to monitor.
28 SAN historical performance data Exporting historical performance data To export historical performance data, complete the following steps. 1. Generate a performance graph. To generate a performance graph, refer to “Generating and saving a historical performance graph” on page 1081. 2. Right-click anywhere in the graph table and select Export. The Save to a tab delimited file dialog box displays. 3. Browse to the file location where you want to save the performance data. 4.
SAN historical performance data 28 Performance database views The following view names are used to extract data similar to the 11.3.0 database schema from the server with the version greater than or equal to 12.0.2. NOTE The FC_PORT_STATS and FCIP_STATS views definition are available under the tree view of databases >dcmdb>Schemas>dcm>Views node hierarchy and can be extracted from the 12.0.
28 SAN historical performance data Performance statistics counters Table 84 details the formulas used to calculate performance statistics based on counter type and protocol. To calculate FC, GE, FCIP and TE port statistics, the Management application uses SNMP to query the respective object identifiers (OID) (listed in Table 84). To calculate HBA and CNA statistics, the Management application uses APIs provided by HCM.
SAN historical performance data TABLE 84 28 Performance statistic counters Counter name Type Protocol Source OID value Formula TX% / RX% FCIP N/A N/A TX% or RX% = ((bytes transferred) / (maximum bytes transmitted))*100 where maximum bytes transmitted = tunnel speed * 134217728 (maximum bytes transmitted 1 Gbps). If utilization is less than 1, the value is 0.0. TX% / RX% (Pre-Fabric OS 6.4.
28 SAN end-to-end monitoring TABLE 85 Performance counters Counter name Type Protocol Source OID value Current FC SNMP .1.3.6.1.4.1.1588.2.1.1.1.28.1.1.3 Rx Power FC SNMP .1.3.6.1.4.1.1588.2.1.1.1.28.1.1.4 Tx Power FC SNMP .1.3.6.1.4.1.1588.2.1.1.1.28.1.1.5 Invalid Oredered Set FC SNMP .1.3.6.1.3.94.4.5.1.45 BB Credit Zero FC SNMP 1.3.6.1.3.94.4.5.1.8 Truncated Frames FC SNMP 1.3.6.1.3.94.4.5.1.47 FEC Corrected Blocks FC SNMP 1.3.6.1.4.1.1588.2.1.1.1.27.1.
SAN end-to-end monitoring 28 • End-to-end monitoring on an Access Gateway device requires Fabric OS 7.0 or later with an Advanced Performance Monitor license. Performance monitoring enables you to provision end-to-end monitors of selected target and initiator pairs. These monitors are persisted in the database and are enabled on one of the F_Ports on the connected device (the Management application server determines the port).
28 SAN end-to-end monitoring Configuring an end-to-end monitor pair Procedures in this section pertain to configuring monitors on systems using the legacy End-to-End Monitor feature instead of using Flow Vision. For systems using Fabric OS version 7.2 or later, when you select a device or device port, and then select Monitor > Performance > End-to-End Monitors, a message displays that you can use Flow Vision to provide End-to-End monitoring.
SAN end-to-end monitoring 28 Before you apply end-to-end monitoring to ports moved to the Monitored Pairs list the Status column displays “Not Configured.” When you Apply the monitored pair, the Status column displays “Enabled”. If the end-to-end monitored pair fails, the Status column displays “Failed:Reason”. NOTE If the initiator or target port is part of a logical switch and you move it to another logical switch, the end-to-end monitor fails.
28 SAN end-to-end monitoring • Clicking OK, opens the legacy Set End-To-End Monitors dialog box.To use the legacy End-to-End Monitor feature, you must deactivate existing flows defined for the switch for Flow Vision. To display monitored pairs in a historical graph, data collection must be enabled for the selected fabric or enabled SAN-wide. To display an end-to-end monitor pair in a historical graph, complete the following steps. 1. Select Monitor > Performance > End-to-End Monitors.
SAN Top Talker monitoring 28 • To use Flow Vision, delete existing monitors, then use the Add Flow Definition dialog box to define an initiator and target port pair for monitoring. Refer to Chapter 29, “Flow Vision” for more information. • Clicking OK, opens the legacy Set End-To-End Monitors dialog box.To use the legacy End-to-End Monitor feature, you must deactivate existing flows defined for the switch for Flow Vision. To delete an end-to-end monitor pair, complete the following steps. 1.
28 SAN Top Talker monitoring NOTE If the Fabric OS device is configured for Fibre Channel routing (FCR), you can only configure a Top Talker monitor on the following devices: - 16 Gbps Backbone Chassis with a FC 16 Gbps 32-port or 48-port blade - 16 Gbps 48-port switch Configuring a fabric mode Top Talker monitor Procedures in this section pertain to configuring the legacy Top Talkers feature instead of using Flow Vision. For systems using Fabric OS version 7.
SAN Top Talker monitoring 28 FIGURE 481 Top Talker Selector dialog box 3. Select Fabric in the Top Talker Mode list to select a switch to monitor. 4. Select an available switch from a fabric in the left panel, and then the right arrow to move it to the right panel. You can select only one device on which to enable Top Talkers. 5. Click OK on the Top Talker Selector dialog box. Top Talkers is enabled on the selected device. The Top Talkers - Fabric Mode for Device_Name dialog box displays. 6.
28 SAN Top Talker monitoring Configuring an F_Port mode Top Talker monitor Procedures in this section pertain to configuring the legacy Top Talkers feature instead of using Flow Vision. For systems using Fabric OS version 7.2 or later, when you select a device or device port, and then select Monitor > Performance > Top Talkers, a message displays that you can use Flow Vision to provide Top Talkers monitoring.
SAN Top Talker monitoring 28 The top 20 conversations display in the Current Top Talkers list. The Top Talkers Summary list displays all Top Talkers that occurred since the Top Talker Selector dialog box was opened (displays a maximum of 360). When the maximum is reached, the oldest Top Talker drops as a new one occurs.
28 Bottleneck detection • Clicking OK opens the legacy Top Talkers dialog box. To use the legacy Top Talkers feature, you must deactivate existing flows defined for the switch for Flow Vision. To pause a Top Talker monitor on systems using Fabric OS before 7.2, complete the following steps. 1. Select the dialog box of the Top Talker monitor you want to pause.
Bottleneck detection 28 The bottleneck detection feature detects two types of bottlenecks: • Latency bottleneck • Congestion bottleneck A latency bottleneck is a port where the offered load exceeds the rate at which the other end of the link can continuously accept traffic, but does not exceed the physical capacity of the link. This condition can be caused by a device attached to the fabric that is slow to process received frames and send back credit returns.
28 Bottleneck detection NOTE A bottleneck cleared alert is sent if you disable bottleneck detection on a bottlenecked port, even though the port is still bottlenecked. Bottlenecks can be highlighted in the Connectivity Map and Product List. Select Monitor > Performance > View Bottlenecks. If a port is experiencing a bottleneck, a bottleneck icon is displayed in the Connectivity Map for the switch and fabric, and in the Product List for the port, switch, and fabric, as shown in Figure 482.
Bottleneck detection 28 When you enable bottleneck detection, you also determine whether alerts are to be sent when the bottleneck conditions at a port exceed a specified threshold. The alert parameters include whether alerts are sent and the threshold, time, and quiet time options. These alert parameters apply to all ports in the switch, unless you override them later. After you enable bottleneck detection, you can change the alert parameters on all eligible ports, switches, and fabrics.
28 Bottleneck detection • Threshold - Enter values between 1 and 100, which is the percentage of one-second intervals affected by congestion conditions within a specified time window that will trigger a latency alert. • Time Threshold - Enter the minimum fraction of a second (sub-second time) that must be affected by latency in order for that second to be considered affected by a latency bottleneck and trigger a latency alert. Values are in tenths of a second from 0 through 10 tenths, or 1 second.
Bottleneck detection 28 10. Click OK or Apply to save your changes. Inheriting alert parameters from a switch When you enable bottleneck detection on a switch, all eligible ports on that switch inherit the same bottleneck parameters as the switch. You can then change the parameters for specific ports or exclude specific ports from bottleneck detection. Use the following procedure if you want to restore the switch bottleneck parameters to a port that has direct assigned settings. 1.
28 Bottleneck detection You can display a graph showing the history of bottleneck conditions, for up to the last 150 minutes. 1. Select Monitor > Performance > Bottleneck Graph. The Bottleneck Graph Port Selector dialog box displays with bottlenecked ports shown in the Available list. 2. (Optional) Select All Ports from the Show list to display all ports in the Available list. 3.
Thresholds and event notification 28 5. Select a device in the table, then click the Show affected VM button to identify virtual machines with the same target ports aa the device port attached to the bottlenecked F_Port or FL_Port. Disabling bottleneck detection Use this procedure to exclude specific ports from bottleneck detection or to disable bottleneck detection on entire switches or fabrics. It is not recommended to disable bottleneck detection on a port except under special circumstances.
28 Thresholds and event notification FIGURE 484 Threshold example Creating and editing a threshold policy To create or edit a threshold policy, complete the following steps. 1. Select Monitor > Fabric Watch > Performance Thresholds. The Set Threshold Policies dialog box displays, as shown in Figure 485 on page 1108. FIGURE 485 Set Threshold Policies dialog box NOTE Policies set for switches enabled for Monitoring and Alerting Policy Suite (MAPS) also display in this dialog box. 2.
Thresholds and event notification 28 FIGURE 486 Edit Threshold Policy dialog box 3. To add a new policy, perform the following steps. a. Click Add. The New Threshold Policy dialog box displays as shown in Figure 487 on page 1109. FIGURE 487 New Threshold Policy dialog box b. Enter a name for the policy (100 characters maximum) in the Name field. 4. Select a policy type from the Policy Type list. You can only define policies for E_Port and F_Port, and FL_Ports. 5.
28 Thresholds and event notification Counters may fluctuate around the upper or lower boundary of a range threshold, and as a result cause numerous events in a short period of time. To reduce the number of events, configure a buffer (a range of values just below the upper boundary and just above the lower boundary) in which a counter does not register an event if it returns to a “normal” value. An event only registers if the counter returns to a “normal” value beyond the buffer. 9.
Thresholds and event notification 28 The Confirm Threshold Changes dialog box displays. 5. Make the threshold changes by selecting one of the following options: • To add only new thresholds, select the Keep currently set thresholds and only add new thresholds check box. • To overwrite all existing thresholds on all fabrics and devices, select the Overwrite all thresholds currently set on all switches check box. 6. Click OK on the Confirm Threshold Changes dialog box.
28 SAN connection utilization Deleting a threshold policy To delete a threshold policy, complete the following steps. 1. Select Monitor > Fabric Watch > Performance Thresholds. The Set Threshold Policies dialog box displays. 2. Select the threshold policy you want to delete in the Available Threshold Policies list. When you delete a policy from the M-EOS physical chassis, the policy is deleted from all logical switches in the physical chassis. 3. Click Delete.
SAN connection utilization 28 FIGURE 489 Utilization Legend The colors and their meanings are outlined in Table 86 on page 1113. TABLE 86 Utilization Legend Line color Utilization defaults Red line 80% to 100% utilization Yellow line 40% to 80% utilization Blue line 1% to 40% utilization Gray line 0% to 1% utilization Black line Utilization disabled Enabling connection utilization To display the connection utilization, complete the following steps. 1.
28 SAN connection utilization The Historical Data Collection dialog box displays. To select the fabrics on which you want to enable data collection, refer to “Enabling historical performance collection for selected fabrics” on page 1079. If you click Close on the Historical Data Collection message, Historical Data Collection is not enabled; however, the Utilization Legend still displays in the main window. There is a 5-minute delay before the values are displayed.
SAN connection utilization 28 2. Enter or select the end percentage you want for the blue line. When you make a change to the end percentage of a utilization line, you also change the start percentage for the utilization line immediately above the one you changed when you click apply. For example, if you change the blue line end percentage to 60 the yellow line start percentage changes to 60 when you click apply. 3. Enter or select the end percentage you want for the yellow line. 4. Click the apply link.
28 SAN connection utilization • 2. Click Options to launch the Graph Options dialog box. Refer to “Configuring graph options” on page 1116 for instructions on using this dialog box. 3. Select the Graph or Table option to display data in graphical or tabular format. 4. Select a time range relative to the present for the display of historical data from the For list. The options are incremental from the last 30 minutes to the last 24 hours. 5.
SAN connection utilization 28 FIGURE 491 Graph Options dialog box (Historical Graphs/Tables dialog box) NOTE Figure 491 illustrates the Graph Options dialog box available from the Historical Graphs/Tables dialog box. The Graph Options dialog box available from the Real Time Graphs/Tables dialog box is similar, but has fewer control options. 2. Select the type of chart style from the Chart Style list. Available chart styles include Line Chart, Area Chart, or Bar Chart. 3.
28 SAN connection utilization • (Historical graphs and monitors only) Plot Min/Max - Plots minimum and maximum values along with the average data. The range between the minimum and maximum values will be represented by the width of a color band surrounding the data points as shown in the following illustration. Note that this option is not available if you select Minimum Interval granularity. It also does not apply and is not available for real-time performance graphs.
SAN connection utilization a. 28 (Historical graphs and monitors only) Select the granularity of the data points to display on the graph from the Granularity list. Options are 5 minutes, 30 minutes, 2 hours, or 1 day. NOTE The graph will not update dynamically if the granularity is 30 minutes, 2 hours, or 1 day. To update, click Apply. The graph will update dynamically when Minimum Interval is selected. b. Select the duration of time for data display on the graph from the Select list.
28 SAN connection utilization Viewing Historical Graphs/Tables 1. Right-click a row in a performance monitor on the dashboard and select Show Graph/Table. The Historical Graphs/Tables dialog box displays. 2. Select the Data Monitoring tab. The main features are a tree structure and a graph area. You can collapse the tree structure to expand the graph area. 3. Use the Show selector to toggle the tree structure display in the left panel between Products and Collectibles.
SAN connection utilization 28 • SAN FCIP tunnel displayWireless access point devices and controllers displaySelect Collectibles and the left panel displays measures (MIB objects and expressions) currently being collected. Select a measure, and the targets (products or ports) from which the measure was collected display in the right panel. If SAN historical data collection is enabled, corresponding SAN products and ports display.
28 SAN connection utilization 7. Optional: To add the performance monitor published widget to the active dashboard, click Save As Widget. The Performance Dashboard Monitor Title dialog box displays. Select Add the Widget to active dashboard (Product status and Traffic) check box to enable the published widget. By default, the check box is enabled. Click OK. 8. Select the Collection Status Summary tab. The Collection Status Summary tab provides a high-level overview of all defined collectors.
SAN connection utilization 28 • Zoom: Use the mouse wheel to zoom in or zoom out of a graph. • Graph panning: Hold down the left mouse button and move the mouse left and right to pan through the graph. • Selective zooming: Select an area that you want to zoom by holding down the right mouse button at one edge of the area, then drag the mouse to the left or right to the other edge of the area. The area you selected changes color. Release the right mouse button to zoom the selected area.
28 1124 SAN connection utilization Brocade Network Advisor SAN User Manual 53-1003154-01
Chapter 29 Flow Vision In this chapter • Flow Vision overview . . . . . . . . . . . . . . . . . . . . . . . . . . . . . . . . . . . . . . . . . • Flow Vision features . . . . . . . . . . . . . . . . . . . . . . . . . . . . . . . . . . . . . . . . . • Flow Vision flows . . . . . . . . . . . . . . . . . . . . . . . . . . . . . . . . . . . . . . . . . . . . • Flow Monitor . . . . . . . . . . . . . . . . . . . . . . . . . . . . . . . . . . . . . . . . . . . . . . . • Flow Generator . . . . . . . . . . . . .
29 Flow Vision overview Supported port types Flow Vision is supported on the following 8 Gbps- or 16 Gbps-capable FC port types. For more information on support for a specific feature, such as Flow Monitor, Flow Mirror, or Flow Generator, refer to the appropriate sections on those features. • • • • • • • • E_Ports F_Ports EX_Ports E_Port trunk F_Port trunk M_Ports (Mirror ports) SIM-Ports Base E-port Flow Vision terminology Table 87 explains the terms used in the discussion of Flow Vision.
Flow Vision features 29 Flow Vision features Flow Vision has three features: Flow Monitor, Flow Generator, and Flow Mirror. The following sections describe each feature and provide links to a more detailed explanation and to step-by-step procedures for each feature. Flow Monitor Flow Monitor provides flow monitoring and the gathering of frame statistics for fabric application flows, including the ability to learn (discover) flows automatically.
29 Flow Vision flows Flow Vision flows A flow is a set of FC frames or packets that share similar traits, such as an ingress port or egress port identifier or any other data that can be used to differentiate one set of related frames or packets from a different set. You specify the following parameters as part of the flow definition: • Port parameter — Also called the Point of Interest, or where the data you want to examine is from. This consists of an ingress port or an egress port.
Flow Vision flows 29 Flow definitions To define a flow and configure Flow Vision to monitor that flow, you must provide a unique flow name and specify the flow parameters. These parameters identify the sets of related frames and can either be explicitly defined or Flow Vision can learn them through observation. Flow definitions are stored on the switch on which you create the flow, and are not distributed across the fabric.
29 Flow Vision flows TABLE 89 Supported frame type parameters (Continued) Frame type parameter Frames counted scsi2reserve Only SCSI 2 reserve command frames scsi3reserve Only SCSI 3 reserve command frames scsi2release Only SCSI 2 release command frames scsi3release Only SCSI 3 release command frames scsiresrel2 Only SCSI 2 reserve-release command frames scsiresrel3 Only SCSI 3 reserve-release command frames scsitur Only SCSI test unit ready frames scsicmdsts Only SCSI command status fr
Flow Vision flows 29 • Support for 16 Gbps F_Ports and F_Port trunks is provided on the following devices: - Switches: 24-port, 48-port, and 96-port 16 Gbps switches - Chassis: 4-slot and 8-slot 16 Gbps Backbone Chassis - Blades: FC8-32E, FC8-48E, FC16-32, FC16-48, and FC16-64 • Disabling a SIM-port that is receiving traffic may produce Class 3 discards for the simulated traffic; however, this will have no effect on other traffic flows.
29 Flow Vision flows Learned flows Flow Vision creates a learned flow by using an asterisk (*) for the source device, the destination device, or both devices. This allows Flow Vision to learn all of the source and destination device pairs passing through the switch using a specified ingress or egress port without having to identify all the devices. • Flow Vision uses an asterisk (*) to indicate a learned flow.
Flow Vision flows 29 4. Click Define Flow. The Create Flow Definition dialog box displays. 5. Enter a name for the new flow in the Name field. The name cannot be over 20 characters and can only include alphanumeric characters or underscores. NOTE For a physical switch, the name must be unique. However, for logical switches, the name does not have to be unique. 6. Select the Active check box to make this the active flow.
29 Flow Vision flows FIGURE 496 Flow Vision dialog box (Flow Definitions table) The Flow Definitions table has the following general characteristics and functions: • Data updates dynamically every 5 minutes. • You can sort the table by clicking any column head. You can reverse the sort order by clicking the column head again. Table 93 describes the data displayed in the Flow Definitions table.
Flow Vision flows TABLE 93 29 Flows Definitions table fields and components (Continued) Field and components Description Destination The port number of the destination device defined in the flow definition. An * (asterisk) indicates learned flows. Destination Info The icon and name for the destination device. The device name is a hyperlink. Click to launch the device property sheet. This field is empty if the destination device is not defined in the flow definition.
29 Flow Vision flows 9. Activate a flow by selecting one or more inactive flows and selecting Feature > feature_name > Activate (where feature_name is Monitor, Generator, or Mirror). 10. Deactivate a flow by selecting one or more active flows and selecting Feature > feature_name > Deactivate (where feature_name is Monitor, Generator, or Mirror). 11. Reset a flow by selecting one or more flows and selecting Feature > feature_name > Reset (where feature_name is Monitor, Generator, or Mirror). 12.
Flow Vision flows 29 2. Select one or more inactive flows that you want to activate in the Flow Definitions table. 3. Select feature_name > Activate (where feature_name is Monitor, Generator, or Mirror) from the Feature list. This activates the selected flow definitions. Deactivating flows You can deactivate Flow Monitor flows without deleting them. This allows you to create and store a “library” of flows that you can activate when needed without having to recreate them every time they are needed.
29 Flow Monitor Flow Monitor Flow Monitor enables you to monitor all the traffic passing through E_Ports, EX_Ports, F_Ports, and XISL_Ports using hardware-supported flow parameters. It also lets you define your own monitoring flows using combinations of ingress or egress ports, source and destination devices, logical unit numbers (LUNs), and frame types to create a flow definition for a specific use case.
Flow Monitor 29 Flow Monitor limitations The following limitations apply to all Flow Monitor flows: • Only one active learned flow is supported per ASIC. • Only supports learned flows on 16 Gbps-capable FC platforms. • For scsiread, scsiwrite, and scsirdwr frame type parameters, only monitors SCSI 6-, 10-, 12-, and 16-bit Read and Write values. Flow Monitor cannot monitor Read Long and Write Long values. • • • • • • Flow Monitor is not supported on ports with Encryption or Compression enabled.
29 Flow Monitor • They cannot show statistics for SIM-ports. • They do not support learned flows. Creating a Flow Monitor flow definition This procedure provides step-by-step instructions for configuring a Monitor flow definition. For more specific example procedures, refer to “Flow Monitor example procedures” on page 1153". 1. Select the object on which you want to configure a flow monitor from the Connectivity Map or Product List.
Flow Monitor 29 FIGURE 497 Add Flow Definition dialog box 3. Enter a name for the flow in the Name field. The name cannot be over 20 characters and can only include alphanumeric characters or underscores. NOTE For a physical switch, the name must be unique. However, for logical switches, the name does not have to be unique. 4. Select the Monitor check box. 5.
29 Flow Monitor The Select Switch dialog box displays. To manually set the Target Switch, refer to “Selecting the target switch from a list of Fabric Vision-capable switches” on page 1144". 9. Select one of the following format options for End Device mode: • Port Address (port ID) — Select to display the source and destination device address using the port ID. • WWN (world wide name) — Select to display the source and destination device address using the port WWN. 10.
Flow Monitor 29 15. Enter the egress port data in Port (slot/port) or D,I (domain ID,port number) format in the Egress field or click the ellipsis button to select a port from the list. Enter an asterisk (*) to use any port. To select the egress port from a list, refer to “Selecting an ingress or egress port from a list of available switch ports” on page 1146". NOTE You must enter the slot number and the port number for the chassis, the slot number cannot be 0 (zero).
29 Flow Monitor 22. Select OK to save the definition. When the flow definition activates, the Flow Vision dialog box displays with the new flow selected (highlighted) in the Flow Definitions table. To review the sub-flow data for the selected flow (refer to “Monitoring a Flow Monitor flow” on page 1149"). Selecting the target switch from a list of Fabric Vision-capable switches To change target switch for the flow definition, complete the following steps. 1.
Flow Monitor 29 FIGURE 498 Select Device Ports dialog box.
29 Flow Monitor 3. Select the Expand All check box to expand the Group/Product tree to show supported device ports for all discovered devices. 4. Select a device port in the Available Device Ports list and click the right arrow to move to the Selected Device Ports list. Select the Use Any Port (*) option to use any supported device port. If you already selected a device port, selecting this option clears the selection.
Flow Monitor 29 Selecting a fabric or virtual fabric ID from a list of available products To select the fabric or virtual fabric ID, complete the following steps. 1. Click the ellipses button to the right of the Source or Destination field. The Select Fabric ID dialog box displays expanded to display all supported fabrics in the Available Products list. Unsupported products do not display in the Available Products list. FIGURE 500 Select Fabric ID dialog box 2.
29 Flow Monitor Selecting a mirror port from a list of available ports Only supported on 16 Gbps-capable ports on devices running Fabric OS 7.3 or later. To select the mirror port, complete the following steps. 1. Click the ellipses button to the right of the Mirror Port field. The Select Mirror Port dialog box displays expanded to display all unoccupied, loopback, and mirror ports for the target switch in the Available list. Unsupported ports do not display in the Available list.
Flow Monitor 29 Selecting a LUN ID from a list of available LUNs 4. Use this dialog box to select the LUNs associated with discovered fabrics. To select the LUN ID, complete the following steps. 1. Click the ellipses button to the right of the LUN field. The Select LUN dialog box displays with a list of fabrics with associated LUNs. FIGURE 502 Select LUN dialog box 2. Select a LUN ID in the Available Products list and click the right arrow to move to the Selected Products list.
29 Flow Monitor 4. Click the right arrow button to display the selected flow in the Flows table. You can sort the Flows table by clicking any column head. You can reverse the sort order by clicking the column head again. 5. Select the SCSI check box to display SCSI-related measures. SCSI-related measures include SCSI read count, write count, read rate, write rate, read data, write data, and read and write frame data. Clear the check box to hide SCSI-related measures. 6.
Flow Monitor 29 FIGURE 503 Flow Vision dialog box (Monitor Flows table) Table 94 describes information on sub-flows displayed in the Flows table when you select Monitor from the Feature list above the Flows table. TABLE 94 Flows table fields and components (Monitor flow) Fields and components Description Violation MAPS violation for the flow over the time duration selected. This column gets updated dynamically for every 5 mins with the violation count receiving from MAPS.
29 Flow Monitor TABLE 94 1152 Flows table fields and components (Monitor flow) (Continued) Fields and components Description SCSI Read Frame Count (frames) The number of SCSI read frames as reported in the last data point for the flow. SCSI Write Frame Count (frames) The number of SCSI write frames as reported in the last data point for the flow. SCSI Read Frame Rate (f/s) The SCSI read frame rate in frames per second as reported in the last data point for the flow.
Flow Monitor TABLE 94 29 Flows table fields and components (Monitor flow) (Continued) Fields and components Description LUN Any LUN values defined in the flow definition. Bi-Directional Whether the flow is bidirectional (yes) or not (no). Flow Definition Persistence Whether the flow is configured to Persist over switch reboots (yes) or not (no). Last Updated Time The date and time the sub-flow was last updated.
29 Flow Monitor 1. Right-click an initiator port and select Fabric Vision > Flow > Add. The Add Flow Definition dialog box displays with the following criteria and flow identifiers pre-populated: • • • • • Feature — Monitor Direction — Bidirectional Source Device — Source identifier (0x010502) Destination Device — * (an asterisk allows you to use any port) Ingress port — port number (5) 2. Enter a name (lunFlow11) for the flow definition in the Name field.
Flow Monitor 29 2. Enter a name (summlow1) for the flow definition in the Name field. The name cannot be over 20 characters and can only include alphanumerics or underscores. NOTE For a physical switch, the name must be unique. However, for logical switches, the name does not have to be unique. 3. Select the Source to Destination option to gather flow data from the source device to the destination device. 4. Select the Persist over switch reboots check box to persist this flow definition over reboots.
29 Flow Monitor 5. Select the Activate all selected features check box to immediately activate the flow after creation. 6. Enter * in the Source and Destination fields to monitor frames on the ingress port (30) between all devices. 7. Click OK. The Flow Vision dialog box displays with the new flow definition highlighted. 8. Select OK to save the definition. When the flow definition activates, the Flow Vision dialog box displays with the new flow selected (highlighted) in the Flow Definitions table.
Flow Monitor 29 Configuring a frame monitor flow You can use the Frame Type field to create a frame monitor flow. For more information about frame monitoring, refer to “Frame Monitor” on page 1959". The following example creates a Flow Monitor flow that counts SCSI Read-Write (scsirw) frames egressing port 2 of the switch on which the flow is running. 1. Right-click a switch port (2) on which you want to monitor frames and select Fabric Vision > Flow > Add.
29 Flow Monitor Configuring a Top Talker monitor flow You can use the learn flow parameter (“*”) to create the equivalent to a Top Talker monitor. Use a Top Talker monitor to identify high volume flows passing a port. NOTE The Top Talker monitor is only supported on F_Ports. The following example creates an ingress Top Talker monitor.
Flow Monitor 29 Configuring a Flow Monitor flow for a trunk group NOTE You cannot create a learned flow in a trunk group. Flow Monitor supports monitoring trunk ports subject to the following conditions: • Although the flow created on the trunk master port monitors data traffic for the entire port, you must create the same flow on all trunk member ports.
29 Flow Monitor 7. Enter the egress port data in Port (slot/port) or D,I (domain ID,port number) format in the Egress field. NOTE You must enter the slot number and the port number. For Backbone chassis, the slot number cannot be 0 (zero). For switches, you must enter 0 (zero) as the slot number. For logical (virtual) switches, follow the rule for the physical chassis (either Backbone chassis or switch) from which you created the logical switch. 8. Click OK.
Flow Monitor 29 FC router fabric monitors using WWNs The following examples present the flow definitions with the End Device mode set to WWN. In Figure 505, the physical devices are A, B, and C, and have the port WWNs a, b, and c, respectively. FIGURE 505 FC router fabric example In Figure 506, provides the port WWN values for the following example procedures.
29 Flow Monitor Configuring an edge-to-edge flow through an ingress port using WWNs Figure 505, provides the values for and a diagram of the following example procedure which monitors a flow from Device A to Device B ingressing through EX_Port1 (traffic is running from left to right).
Flow Monitor 29 Configuring an edge-to-edge flow through an egress port using WWNs Figure 505, provides the values for and a diagram of the following example procedure which monitors a flow from Device B to Device A egressing through EX_Port1 (traffic is running from right to left).
29 Flow Monitor Configuring a backbone-to-edge flow through an egress port using WWNs Figure 505, provides the values for and a diagram of the following example procedure which monitors a flow from Device C to Device A egressing through EX_Port1 (traffic is running from right to left). The following procedure creates a flow (b2e_dst_dcx) that filters out frames passing from the backbone fabric (20:02:00:11:0d:51:00:00) to an edge fabric (10:00:00:05:1e:e8:e2:00) using a specific egress port (219). 1.
Flow Monitor 29 Configuring an edge-to-backbone flow through an ingress port using WWNs Figure 505, provides the values for and a diagram of the following example procedure which monitors a flow from Device A to Device C ingressing through EX_Port1 (traffic is running from left to right). The following procedure creates a flow (e2b_src_dcx) that filters out frames passing from the backbone fabric (10:00:00:05:1e:e8:e2:00) to an edge fabric (20:02:00:11:0d:51:00:00) using a specific egress port (219). 1.
29 Flow Monitor FC router fabric monitors using virtual port IDs The following examples present flow definitions configured with the End Device mode set to Port Address (port ID). In Figure 507, the physical devices are A, B, and C. The virtual devices are Device A′, B′, C′, A″, B″, and C″, representing the physical devices A, B, and C, respectively.
Flow Monitor 29 Configuring an edge-to-edge flow through an ingress port using virtual port IDs Figure 508, provides the values for and a diagram of the following example procedure which monitors a flow from Device A to Device B ingressing through EX_Port1, the source device is Device A, the destination device is Device B′, and the ingress port is EX_Port1 (traffic is running from left to right).
29 Flow Monitor Configuring an edge-to-edge flow through an egress port using virtual port IDs Figure 508, provides the values for and a diagram of the following example procedure which monitors a flow from Device B to Device A egressing through EX_Port1, the source device is Device B′, the destination device is Device A, and the egress port is EX_Port1 (traffic is running from right to left).
Flow Monitor 29 Configuring a backbone-to-edge flow through an egress port using virtual port IDs Figure 508, provides the values for and a diagram of the following example procedure which monitors a flow from Device C to Device A egressing through EX_Port1, the source device is Device C′, the destination device is Device A, and the egress port is EX_Port1 (traffic is running from right to left).
29 Flow Monitor Configuring a edge-to-backbone flow through an ingress port using virtual port IDs Figure 508, provides the values for and a diagram of the following example procedure which monitors a flow from Device A to Device C ingressing through EX_Port1, the source device is Device A, the destination device is Device C′, and the ingress port is EX_Port1 (traffic is running from left to right).
Flow Monitor 29 FC router fabric monitors using fabric IDs The following examples present flow definitions configured with the FCR/XISL mode set to Fabric ID (FC router fabric ID). NOTE This feature is only supported on 16 Gbps-capable platforms running Fabric OS 7.3 or later.
29 Flow Monitor 12. Select OK to save the definition. When the flow definition activates, the Flow Vision dialog box displays with the new flow selected (highlighted) in the Flow Definitions table. To review the sub-flow data for the selected flow, refer to “Monitoring a Flow Monitor flow” on page 1149".
Flow Monitor 29 When the flow definition activates, the Flow Vision dialog box displays with the new flow selected (highlighted) in the Flow Definitions table. To review the sub-flow data for the selected flow, refer to “Monitoring a Flow Monitor flow” on page 1149".
29 Flow Monitor XISL and backbone E_Port monitors Flow Monitor supports both static and learned monitoring of fabric-wide statistics on both XISL_Ports and backbone E_Ports. You can use this data to estimate the logical fabric or inter-fabric utilization of an XISL_Port or a Backbone E_Port. The following examples present flow definitions configured with the FCR/XISL mode set to VFID (virtual fabric ID). NOTE This feature is only supported on 16 Gbps-capable platforms running Fabric OS 7.3 or later.
Flow Monitor 7. 29 Select the VFID option for FCR/XISL mode. 8. Enter the source edge fabric ID in the Source field. To select the source from a list, refer to “Selecting a fabric or virtual fabric ID from a list of available products” on page 1147". 9. Enter the destination edge fabric ID in the Destination field. To select the destination from a list, refer to “Selecting a fabric or virtual fabric ID from a list of available products” on page 1147". 10. Select OK to save the definition.
29 Flow Monitor 11. Select OK to save the definition. When the flow definition activates, the Flow Vision dialog box displays with the new flow selected (highlighted) in the Flow Definitions table. To review the sub-flow data for the selected flow, refer to “Monitoring a Flow Monitor flow” on page 1149".
Flow Generator 29 Flow Generator Flow Generator is a test traffic generator for pre-testing the SAN infrastructure (including internal connections) for robustness before deploying it. Flow Generator provides you with the ability to: • Configure a 16 Gbps FC-capable port as a simulated device that can transmit frames at full 16 Gbps line rate. • Emulate a 16 Gbps SAN without actually having any 16 Gbps hosts or targets or SAN-testers.
29 Flow Generator FIGURE 509 Flow Generator flow structure Flow Generator limitations The following limitations apply specifically to Flow Generator: • If used on a live production system, Flow Generator traffic will compete with any existing traffic. Consequently, E_Ports and FCIP links can become congested when using Flow Generator, leading to throughput degradation. FCIP links are more prone to congestion than E_Ports. • Flow Generator is only supported on 16 Gbps-capable FC devices.
Flow Generator 29 SIM-Ports Before you create and activate a Flow Generator flow, you must set the source device and destination device ports in simulation mode (SIM-Port mode). Setting the port to SIM-Port mode sets an internal loopback on the port and creates a filter that discards all incoming Flow Generator frames. This ensures that test flows are not unintentionally transmitted to real devices. A SIM-Port simulates an F_Port on the switch using the port WWN or virtual WWN.
29 Flow Generator • SIM-Ports cannot be configured as any of the following port types; these restrictions also apply at the time a SIM-Port is enabled: - Any port running encryption or compression Any F_Port connected to a real device (unless the port is disabled) D_Port (Diagnostic Port) E_Port EX_Port F_Port trunk Fastwrite port FCoE port ICL port L_Port M_Port (Mirror Port) VE port • The following features of a SIM-Port are persistent across a reboot: - Each SIM-Port is assigned a PID.
Flow Generator 29 Disabling SIM-Port mode To disable SIM-Port mode, use the following steps. 1. Select the SIM-Port for the source device in the Product List, and then select Monitor > Fabric Vision > Flow > SIM Mode > Disable. 2. Select the SIM-Port for the destination device in the Product List, and then select Monitor > Fabric Vision > Flow > SIM Mode > Disable. Creating a Flow Generator flow definition This procedure provides step-by-step instructions for configuring a Generator flow definition.
29 Flow Generator 10. Select one of the following format options for End Device mode: • Port Address (port ID) — Select to display the source and destination device address using the port ID. • WWN (world wide name) — Select to display the source and destination device address using the port WWN. 11. Enter the address or WWN of the source port in the Source field or click the ellipsis button to select a port from the list. Enter an asterisk (*) to use any port.
Flow Generator 29 16. Enter the egress port in Port (slot/port) or D,I (domain ID,port number) format for the SIM-Port in the Egress field or click the ellipsis button to select a port from the list. Enter an asterisk (*) to use any port. To select the egress port from a list, refer to “Selecting an ingress or egress port from a list of available switch ports” on page 1146". NOTE You must enter the slot number and the port number. For Backbone chassis, the slot number cannot be 0 (zero).
29 Flow Generator 3. Select Generator > Configure from the Feature list. The Configure Generator dialog box displays. FIGURE 510 Configure Generator dialog box 4. Define the frame payload size by choosing one of the following options: • To configure a specific frame payload size in bytes, select the Bytes option and enter the size you want in the Bytes field. The frame payload size value must be a multiple of 4 in the range from 64 through 2048. (64, 120, 140, 320, 512 and so on).
Flow Generator 29 5. Select the SCSI check box to display SCSI-related measures. SCSI-related measures include SCSI read count, write count, read rate, write rate, read data, write data, and read and write frame data. Clear the check box to hide SCSI-related measures. 6. Select the Frame check box to display frame-related measures.
29 Flow Generator FIGURE 511 Flow Vision dialog box (Generator Flows table) Table 94 describes information on sub-flows displayed in the Flows table when you select Generator from the Feature list above the Flows table. TABLE 96 1186 Flows panel information (Generator flow) Column Information Displayed Sub Flow Id The sub-flow database identifier. Target Switch The switch on which you created the flow definition. Frame Type All frame types defined in the flow definition.
Flow Generator TABLE 96 29 Flows panel information (Generator flow) (Continued) Column Information Displayed Generator Number of complete runs (count) The number of complete runs reported in the last data point received for the flow. Generator Percent Complete of the Curent run (percentage) The percentage completion of the current run reported in the last data point received for the flow. Ingress Port The ingress port defined in the flow definition. The port name is a hyperlink.
29 Flow Generator The Add Flow Definition dialog box displays with the following criteria and flow identifiers pre-populated: • • • • • Feature — Monitor Direction — Bidirectional Source Device — Source identifier (0x040100) Destination Device — * (an asterisk allows you to use any port) Ingress port — SIM-Port number (1/1) 3. Enter a name (flowcase1) for the flow definition in the Name field. The name cannot be over 20 characters and can only include alphanumeric characters or underscores.
Flow Mirror • • • • • 29 Feature — Monitor Direction — Bidirectional Source Device — Source identifier (0x010100) Destination Device — * (an asterisk allows you to use any port) Ingress port — SIM-Port number (1/1) 3. Enter a name (flowCase3Src) for the flow definition in the Name field. The name cannot be over 20 characters and can only include alphanumeric characters or underscores. NOTE For a physical switch, the name must be unique.
29 Flow Mirror Flow Mirror duplicates the specified frames in a user-defined flow, and sends them to a mirror port. There are two types of mirrors: • CPU Mirroring — Sends the duplicated frames to the local switch Control Processor Unit (CPU); however, CPU Mirroring has a limit of 256 frames per second. • Local Flow Mirroring (LFM) — Sends the duplicated frames to an unoccupied, loopback, or mirror port on the same physical switch on which you defined the flow.
Flow Mirror 29 Flow Mirror limitations • • • • Flow Mirror is only supported on 16 Gbps-capable FC devices. Flow Mirror is only supported on F_Ports or F_Port trunks operating at 8 Gbps or less. Flow Generator flows can only be mirrored at the ingress port. Flow Mirror requires a Fabric Vision license on the device where you are creating a mirrored flow. • Flow Mirror only supports one active flow per device. • Flow Mirroring is supported in Virtual Fabric and non-Virtual Fabric mode.
29 Flow Mirror 5. Select one of the following options: • CPU Mirroring Select to mirror traffic to the switch CPU, which enables you perform debugging without disturbing existing connections. By default, CPU Mirroring is enabled. • Local Flow Mirror Select to mirror traffic to an unoccupied, loopback, or mirror port on the selected target switch, which enables you to mirror a flow to a specific port, which is present on the same physical switch on which you defined the flow.
Flow Mirror 29 13. Select one of the following format options for Switch mode: • Port (slot/port) — Select to display the switch ingress or egress port using the slot and port number. • D,I (domain ID, port number) — Select to display the switch ingress or egress port using the domain ID and port number. 14. Enter the ingress port in Port (slot/port) or D,I (domain ID,port number) format in the Ingress field or click the ellipsis button to select a port from the list.
29 Flow Mirror 17. For FCR or virtual fabrics, enter the fabric ID or virtual fabric ID in the Source field. Enter an asterisk (*) to use any port. To select the source from a list, refer to “Selecting a fabric or virtual fabric ID from a list of available products” on page 1147". 18. For FCR or virtual fabrics, enter the fabric ID or virtual fabric ID in the Destination field. Enter an asterisk (*) to use any port.
Flow Mirror 29 3. Select a time interval for monitoring the flow in the Time duration list. Possible values are 30 minutes, 1 hour, 6 hours, 12 hours, 1 day, 3 days, 1 week, and 1 month. 4. Click the right arrow button to display the selected flow in the Flows table. You can sort the Flows table by clicking any column head. You can reverse the sort order by clicking the column head again. 5. Select the SCSI check box to display SCSI-related measures.
29 Flow Mirror • Each unique sub-flow for the flow definition displays in the Flows table if it was reported within the selected time duration. If the last data point did not report that flow, the reported values may be 0. • The measures that display are based on the flow definition. Therefore, not all columns may be populated for the selected flows.
Flow Mirror TABLE 97 29 Flows table fields and components (Mirror Flow) (Continued) Field and components Description Mirrored Frames Count (frames) The number of mirrored frames as reported in the last data point received for the flow. Mirrored Transmit Frames (frames) The number of transmitted mirrored frames as reported in the last data point received for the flow. Mirrored Receive Frames (frames) The number of received mirrored frames as reported in the last data point received for the flow.
29 Flow Mirror 2. Enter a name (flow_scsi) for the flow definition in the Name field. The name cannot be over 20 characters and can only include alphanumeric characters or underscores. NOTE For a physical switch, the name must be unique. However, for logical switches, the name does not have to be unique. 3. Clear the Monitor check box. 4. Select the Mirror check box. 5. Select the CPU Mirroring or Local Flow Mirror option. By default, CPU Mirroring is enabled. 6.
Flow Mirror 29 2. Enter a name (flow_protocol) for the flow definition in the Name field. The name cannot be over 20 characters and can only include alphanumeric characters or underscores. NOTE For a physical switch, the name must be unique. However, for logical switches, the name does not have to be unique. 3. Clear the Monitor check box. 4. Select the Mirror check box. 5. Select the CPU Mirroring or Local Flow Mirror option. By default, CPU Mirroring is enabled. 6.
29 Flow Mirror 1. Right-click a target port (15) and select Fabric Vision > Flow > Add. The Add Flow Definition dialog box displays with the following criteria and flow identifiers pre-populated: • • • • • Feature — Monitor Direction — Bidirectional Source Device — Source identifier Destination Device — * (an asterisk allows you to use any port) Egress port — port number (1/20) 2. Enter a name (flow_slowdrain) for the flow definition in the Name field.
Flow Mirror • • • • 29 Direction — Bidirectional Source Device — Source identifier Destination Device — * (an asterisk allows you to use any port) Ingress port — port number (F1) 2. Enter a name (mirror_scsismd) for the flow definition in the Name field. The name cannot be over 20 characters and can only include alphanumeric characters or underscores. NOTE For a physical switch, the name must be unique. However, for logical switches, the name does not have to be unique. 3. Clear the Monitor check box.
29 Flow Mirror • Destination Device — * (an asterisk allows you to use any port) • Ingress port — port number (F1) 2. Enter a name (cpu_mirror_scsicmdsts) for the flow definition in the Name field. The name cannot be over 20 characters and can only include alphanumeric characters or underscores. NOTE For a physical switch, the name must be unique. However, for logical switches, the name does not have to be unique. 3. Clear the Monitor check box. 4. Select the Mirror check box. 5.
Flow Mirror 29 3. Clear the Monitor check box. 4. Select the Mirror check box. 5. Select the Local Flow Mirror option. By default, CPU Mirroring is enabled. 6. Select the Persist over switch reboots check box to persist this flow definition over reboots. 7. Select the Activate all selected features check box to immediately activate the flow after creation. 8. Enter the source device (H1) in the Source field. 9. Enter an asterisk (*) in the Destination field. 10.
29 Predefined flow definition templates Predefined flow definition templates The Management application provides predefined flow templates that are available when you select a switch port, an initiator port, or a target port. NOTE The predefined flow templates are not supported on switches, storage arrays, or host groups. Table 98 lists the predefined flow templates available by port type.
Predefined flow definition templates TABLE 98 29 Predefined templates (Continued) Port type Template name Platform support Required Fabric OS version 16 Gbps-capable port blade 8 Gbps-capable port blade F_Ports (connected to an initiator or target) Learn Flows from Host Supported Not Supported v7.2.0 or later Learn Flows on Port Supported Not Supported v7.2.0 or later Monitor All Flows from Host Supported Supported v7.2.0 or later Monitor Flows to LUN Supported Supported v7.2.
29 Predefined flow definition templates FIGURE 517 Sample Add Flow - predefined_monitor dialog box 3. Enter a name for the flow definition in the Flow Name field. 4. Select one of the following format options from the Device View list: • Port Address (port ID) — Select to display the source and destination device address using the port ID. • WWN (world wide name) — Select to display the source and destination device address using the port WWN. 5.
Predefined flow definition templates 29 FIGURE 518 Deployment Status dialog box Table 93 describes the data displayed in the Flow Definitions Status table. TABLE 99 Flows Definitions table fields and components Field and components Description Name The user-defined name for the flow definition. Target Switch The switch on which you created the flow definition. Source The source identifiers defined in the flow definition.
29 Predefined flow definition templates Predefined flow definition templates for initiator group and storage array The predefined flow templates only display when you select a Flow Vision-capable initiator, or initiator group, or storage, or storage array. 1. Right-click an initiator, or initiator group, or storage, or storage array from the Connectivity Map or Product List and select Flow > Static Flow or Aggregated Flow or Frame Type Monitoring or LUN Monitoring. 2.
Predefined flow definition templates 29 Configuring Static Flow template The Static Flow predefined template receives the source device details from the storage array, searches all the zones where the source device is a member, iterates through all the zone members and receives each initiator or initiator with target port details, and creates flow definition row using the device port and source port details as shown in Figure 519.
29 Predefined flow definition templates FIGURE 521 Deployment Status dialog box 5. Click Start to deploy the flow definitions. 6. View additional details for a deployed flow definition by selecting the flow defintion in the Flow Definitions Status table. The reason for sucess or failure displays in the Details area. To review the sub-flow data for the selected flow, refer to “Monitoring flows” on page 1133".
Predefined flow definition templates 29 Configuring Aggregated Flow template The Aggregated Flow predefined template creates flow rows for all the ports in the storage array with the source device and empty destination device details as shown in Figure 522. FIGURE 522 Add Flow Definition - Aggregated Flow template dialog box Perfom the following steps, in the Add Flow Definition - Aggregated Flow dialog box: The default Device View is Port Address. 1.
29 Predefined flow definition templates Configuring Frame Type Monitoring template The Frame Type Monitoring template creates flow rows like Static Flow template with frame types as shown in Figure 523. FIGURE 523 Add Flow Definition - Frame Type Monitoring template dialog box Perfom the following steps, in the Add Flow Definition - Frame Type Monitoring dialog box: The default Device View is Port Address. 1.
Flow Vision interoperability with other features 29 Configuring LUN Monitoring predefined template The LUN Monitoring template creates flow rows like Static Flow template including the LUN ID field. You can configure LUN ID for the flows as shown in Figure 524. FIGURE 524 Add Flow Definition - LUN Monitoring template dialog box Perfom the following steps, in the Add Flow Definition - LUN Monitoring dialog box: The default Device View is Port Address. 1.
29 Flow Vision interoperability with other features Creating a Frame Viewer flow definition 1. Select a frame from the Discarded Frame Log for the Selected Product list in the Discarded Frames dialog box. 2. Click Add Flow. 3.
Flow Vision interoperability with other features 29 Bottleneck Detection integration with Flow Vision You can create a flow definition for a single bottlenecked port. For more information about Bottleneck Detection, refer to “Bottleneck detection” on page 1765". Creating a bottlenecked port flow definition 1. Select a port from the Products/Ports list in the Bottlenecks dialog box. 2. Click Add Flow.
29 Flow Vision interoperability with other features FC Trace Route integration with Flow Vision You can create a flow definition based on trace route data (forward routes, reverse routes, and FC ping). For more information about trace route and ping, refer to “Tracing FC routes” on page 1714". Creating a Forward Route flow definition You can create a flow definition based on forward route data. 1. Select a row on the Forward Route tab in the Trace Route Summary dialog box. 2. Click Add Flow.
Flow Vision interoperability with other features 29 Creating a Reverse Route flow definition You can create a flow definition based on reverse route data. For more information about trace route and ping, refer to “Tracing FC routes” on page 1714". 1. Select a row on the Reverse Route tab in the Trace Route Summary dialog box. 2. Click Add Flow. The Add Flow Definition dialog box displays with fields and options populated based on the selected row.
29 Flow Vision interoperability with other features Creating a FC Ping flow definition You can create a flow definition based on FC ping data. For more information about trace route and ping, refer to “Tracing FC routes” on page 1714". 1. Select a row on the FC Ping tab in the Trace Route Summary dialog box. 2. Click Add Flow.
Flow Vision interoperability with other features TABLE 103 29 Add Flow Definition dialog box options populated per port connectivity row selection Row selected Options populated Target Target Switch = Selected port's connected switch Source Device = * if port is on a 16-Gbps switch, otherwise empty Destination Device = Target port ID Ingress Port = Selected port's connected switch port number Direction = Bidirectional Row other than the first or last row Target Switch = Selected switch Source Devic
29 Flow Vision interoperability with other features Performance integration with Flow Vision You can use the performance graphs (historical or real-time) to monitor flows. For platforms running Fabric OS 7.2 or later, Flow Vision replaces Top Talker and End-to-End monitoring. Monitoring flows using a performance graph 1. Select Monitor > Fabric Vision > Flow > Monitor. The Flow Vision dialog box displays. 2. Select a row in the Flows list. 3.
Flow Vision interoperability with other features 29 5. Select the measures you want to display in the graph in the Select Network Objects and Measures list and click the right arrow button. Select multiple measures by holding down the CTRL key and clicking more than one measure. Select all measures for a flow by selecting the flow. 6. Remove measures from the graph by selecting the measure beneath the graph and clicking the left arrow button. 7.
29 Flow Vision interoperability with other features To continue using the legacy End-to-End feature, you must deactivate existing flows defined for the switch (refer to “Deactivating flows” on page 1137").
Chapter 30 Frame Monitor In this chapter • Frame Monitor . . . . . . . . . . . . . . . . . . . . . . . . . . . . . . . . . . . . . . . . . . . . . . • Creating a custom frame monitor . . . . . . . . . . . . . . . . . . . . . . . . . . . . . . • Editing a frame monitor . . . . . . . . . . . . . . . . . . . . . . . . . . . . . . . . . . . . . . • Assigning a frame monitor to a port. . . . . . . . . . . . . . . . . . . . . . . . . . . . . • Finding frame monitor assignments . . . . . . . . . . . . . . . . .
30 Frame Monitor Pre-defined frame types Pre-defined frame types include the following: • • • • • • • • • ABTS (Abort Sequence Basic Link Service command) BA_ACC (Abort Accept) IP SCSI SCSI Read SCSI Write SCSI RW SCSI-2 Reserve SCSI-3 Reserve Custom frame types In addition to the standard frame types, you can create custom frame types to gather statistics that fit your needs. To define a custom frame type, you must specify a series of offsets, bitmasks, and values.
Creating a custom frame monitor 30 Frame Monitoring requirements To configure Frame Monitoring, the following requirements must be met: • The switch must be running Fabric OS 7.0.0 or later. • Frame Monitoring requires the Advanced Performance Monitoring license and the Fabric Watch license. NOTE The Advanced Performance Monitoring license is required to configure frame monitors. The monitoring functionality requires the Fabric Watch license.
30 Creating a custom frame monitor 2. Select the Switch option. The Products / Monitors list displays the switches that support Frame Monitoring. 3. Enter the monitor data in the Configure Monitor area. 4. Select one or more switches in the Products / Monitors list, and click the right arrow button to assign the frame monitor to those switches. 5. Select the Port option. 6. Expand the switch in the Products / Ports list. The Monitors list displays all of the frame monitors defined for that switch. 7.
Editing a frame monitor 30 11. Click Start. The frame monitor configuration is applied to the switches. 12. Click Close after configuration is complete (indicated by “Completed” in the Progress column). Editing a frame monitor 1. Select Monitor > Fabric Watch > Frame Monitor. The Frame Monitor dialog box displays. 2. Select the Switch option. 3. Expand the Products / Monitors list to display the frame monitors for each switch. 4. Select a frame monitor and click the left arrow button.
30 Finding frame monitor assignments 6. Click the right arrow button to move the frame monitor to the selected ports. The Monitor Details list displays the monitors that are assigned to a selected port. If no monitors are assigned, or if more than one port is selected, the Monitor Details list does not display. 7. Click OK. The Frame Monitor Configuration Status dialog box displays. 8. Click Start. The frame monitor configuration is applied to the ports. 9.
Removing a frame monitor from a switch 30 8. Click Start. The frame monitor configuration is applied to the ports. 9. Click Close after configuration is complete (indicated by “Completed” in the Progress column). Removing a frame monitor from a switch When you remove a frame monitor from a switch, the frame monitor is automatically removed from all assigned ports in the switch. You can remove only custom frame types; you cannot remove the pre-defined frame types. 1.
30 1230 Removing a frame monitor from a switch Brocade Network Advisor SAN User Manual 53-1003154-01
Chapter 31 Policy Monitor In this chapter • Policy monitor overview. . . . . . . . . . . . . . . . . . . . . . . . . . . . . . . . . . . . . . . • Preconfigured configuration policy managers. . . . . . . . . . . . . . . . . . . . . • Viewing configuration policy manager status . . . . . . . . . . . . . . . . . . . . . • Viewing existing configuration policy managers . . . . . . . . . . . . . . . . . . . • Adding a configuration policy manager . . . . . . . . . . . . . . . . . . . . . . . . . .
31 Policy monitor overview Fabric policy monitors Fabric policy monitors enable you to set the following policy monitors on SAN (refer to “Adding a configuration policy manager” on page 1240): • Check zoning status — This fabric policy monitor enables you to determine if zoning is enabled or disabled on the fabric. Zoning plays a key role in the management of device communication. When you enforce zoning, devices not in the same zone cannot communicate.
Policy monitor overview 31 Some devices can function as both initiator and target. If the application finds this type of device as one of the active zone members, this device port is treated as both initiator and target: - Target (storage port) — The application counts the number of initiator ports zoned to this storage port. - Initiator — The application counts this device as an initiator port for other storage ports in the same zone.
31 Policy monitor overview Rule Violation Fix — If the configuration policy manager report shows a violation, the SAN Administrator can add redundant ISLs between the source and the target switch. • Check for HTTPS (secure HTTP) configuration — This switch and router configuration policy manager enables you to check each target to see if HTTPS is active for device data transmission. The preferred Management application product communication must be HTTPS for this check to pass.
Policy monitor overview 31 • Check for SSH (secure Telnet) configuration — This switch and router configuration policy manager enables you to check each target to see if SSH is enabled for device data transmission. The preferred Management application product communication must be SSH for this check to pass. For Fabric OS products, verifies SSH access is enabled and telnet access is disabled through the IP ACL active or applied policy rules.
31 Policy monitor overview Depending on how you discover the hosts, there are recommended configurations you should complete to avoid inaccuracy: - Fabric discovery for manual host enclosures to fabric connections (refer to “Discovering fabrics” on page 37) Make sure there are Brocade HBAs on the host. Make sure to configure the host port mapping. (refer to “Host port mapping overview” on page 553) - Host adapter discovery with 2.
Preconfigured configuration policy managers - 31 Fabric plus VM Manager discovery (refer to “Discovering fabrics” on page 37) Make sure there are Brocade HBAs (with a 2.1 or later driver) on the host connected to the fabric. - VM Manager plus Host discovery (refer to “VM Manager discovery” on page 67) Make sure there are Brocade HBAs (with a 2.1 or later driver) on the host. Make sure you discover the associated fabrics.
31 Viewing configuration policy manager status • Rule — The default SAN policy is configured with the following rules: - Zoning status - Fan in Ratio - Event registration - Redundant connection - Management application backup enabled • Targets — The default SAN policy is configured with the following targets: - Fabric Checks — All Fabrics - Switch/Router Checks — All SAN Switches product group Viewing configuration policy manager status You can view configuration policy manager status from the main Manag
Viewing existing configuration policy managers 31 Viewing existing configuration policy managers To view existing configuration policy managers, complete the following steps. 1. Select Monitor > Configuration Policy Manager (Figure 529). The Configuration Policy Manager dialog box displays. FIGURE 529 Configuration Policy Manager dialog box 2. Review the configuration policy manager details: • Name — The user-defined name of the policy. • Description — A description of the policy.
31 Adding a configuration policy manager 5. To delete the selected configuration policy manager, click Delete (refer to “Deleting a configuration policy manager” on page 1248). 6. To run the selected policy and view the report, click Run (refer to “Running a configuration policy manager” on page 1248). 7.
Adding a configuration policy manager 31 FIGURE 530 Add Configuration Policy dialog box, Fabric Checks tab 3. Enter a user-defined name for the policy in the Name field. The name must be unique. It cannot be over 64 characters, nor can the field be empty. It cannot include asterisks. 4. Enter a description of the policy in the Description field. The description cannot be over 128 characters. It cannot include asterisks. 5.
31 Adding a configuration policy manager • To configure the frequency, click the ellipsis button and choose one of the following options to configure the frequency at which deployment runs for the configuration policy manager: To configure deployment to run only once, refer to “Configuring a one-time configuration policy manager schedule” on page 1246. To configure hourly deployment, refer to “Configuring an hourly configuration policy manager schedule” on page 1246.
Adding a configuration policy manager 31 The selected fabrics display in the Selected Fabrics list. 7. To set configuration policy managers for switches, select the Switch/Router Checks tab (Figure 531) and complete the following steps. FIGURE 531 Add Configuration Policy Manager dialog box, Switch/Router Checks tab a.
31 Adding a configuration policy manager • Select the Check for SNMPv3 (secure SNMP) configuration check box to check each target to see if SNMPv3 is active for device data transmission and SNMPv1 and SNMPv2 are not configured. • Select the Check for MAPS action enabled (SAN only) check box to determine whether the MAPS actions are enabled over the selected switches. b. Click the right arrow button to move the selected checks to the Selected Checks list. c.
Adding a configuration policy manager a. 31 Select the Check for redundant connections to attached fabrics check box to determine if there are at least the minimum number of configured physical connections between the host and the attached fabric. The default is 2. For more information about this check and a fix for rule violations, refer to “Host configuration policy managers” on page 1235. b.
31 Configuration policy manager scheduling Configuration policy manager scheduling You can schedule a configuration policy manager to run automatically.
Editing a configuration policy manager 31 3. Click OK on the Schedule Properties dialog box. To finish configuring the configuration policy manager, return to step 6 of “Adding a configuration policy manager” on page 1240. Configuring a weekly configuration policy manager schedule To configure a weekly schedule, complete the following steps. 1. Select Weekly from the Frequency list. 2. Select the time of day you want deployment to run from the Time (hh:mm) lists.
31 Deleting a configuration policy manager 4. Change the description of the policy in the Description field. The description cannot be over 128 characters. It cannot include asterisks. 5. To edit the configuration policy manager checks, repeat step 5 through step 9 of “Adding a configuration policy manager” on page 1240. 6. Click OK on the Edit Monitor dialog box. The updated configuration policy manager displays in the Monitors list of the Configuration Policy Manager dialog box. 7.
Viewing a configuration policy manager report 31 FIGURE 534 Policy_Name - Configuration Policy Manager Report 4. Review the report details (refer to “Viewing a configuration policy manager report” on page 1249). To export a report, refer to “Exporting a configuration policy manager report” on page 1252. To e-mail a report, refer to “Exporting SAN reports” on page 1404. 5. Click the close button (X) on the Policy_Name - Configuration Policy Manager Report browser window. 6.
31 Viewing a configuration policy manager report 3. Click Report. NOTE If you have run this policy more than once, the latest report displays. The Policy_Name - Configuration Policy Manager Report displays (Figure 534) in a web browser. 4. Review the report details: • Name — Name of the configuration policy manager report. • Date — Date and time the report was finished. • Export button — To export a report, refer to “Exporting a configuration policy manager report” on page 1252.
Viewing a configuration policy manager report 31 Switch Checks — Switch checks provide the following information for each selected check: Name — Product name. Status — Result of the check and reason for failure if known. Valid results include Passed, Partially Failed, Failed, Not Applicable, and Unknown. Switch Checks include the following options: Switch — Check for at least Configured_Minimum_Value connections to neighboring switches.
31 Viewing a configuration policy manager report - Matched Block — Name of the matched block. - Condition Details — Details about the condition. Status — Whether the configurations matched (Passed) or did not match (Failed). Failed Condition — Name of the failed condition. Match/Not Match — Whether the configurations matched (Match) or did not match (Not Match). Remediation — Details how to correct the failure, if the condition fails.
Viewing historical reports for all configuration policy managers 31 Viewing historical reports for all configuration policy managers 1. Select Monitor > Configuration Policy Manager. The Configuration Policy Manager dialog box displays. 2. Click History. The Report History dialog box displays the last 10 reports run for all monitors. The Report History dialog box retains up to 10 reports for each configuration policy manager. • Name — Name of the configuration policy manager.
31 1254 Viewing historical reports for a configuration policy manager Brocade Network Advisor SAN User Manual 53-1003154-01
Chapter 32 Fault Management In this chapter • Fault management overview. . . . . . . . . . . . . . . . . . . . . . . . . . . . . . . . . . . • Event notification. . . . . . . . . . . . . . . . . . . . . . . . . . . . . . . . . . . . . . . . . . . . • Defining filters . . . . . . . . . . . . . . . . . . . . . . . . . . . . . . . . . . . . . . . . . . . . . . • SNMP traps . . . . . . . . . . . . . . . . . . . . . . . . . . . . . . . . . . . . . . . . . . . . . . . . • SNMP informs . . . . . . . . . . . . .
32 Event notification Restrictions The following items affect Fault Management operation. Supported IP address types The Management application receives traps and syslog messages for physical IP addresses only. Event Purging The default maximum number of days that historical events are stored is 365. You can select a different default (from 1 to 365 ) in the Options dialog box under Event Storage. Event Archiving The default number of days that purged events are archived is 30.
Event notification 32 2. Select the Enable E-mail Event Notification check box to enable the application to send e-mail messages in case of event notifications. 3. Enter the IP address or the name of the SMTP mail server that the server can use to send the e-mail notifications in the E-mail Server field. The Management application accepts IP addresses in IPv4 and IPv6 formats. The IPv4 format is valid when the operating system has IPv4 mode only or dual stack mode.
32 Defining filters Defining filters The Define Filter dialog box, shown in Figure 536, allows you to define event filters by product, event category, and severity. You can define event filters on SAN products, IP products, or hosts. Setting up basic event filtering To set up basic event filtering on the selected events for a user, complete the following steps. 1. Select Server > Users. The Users dialog box displays. 2. Select a user in the Users list and click Edit. The Edit User dialog box displays. 3.
Defining filters 32 6. Select the Allow All Products check box to control whether or not all products are always displayed. • When selected (the default), all products, even newly-added products, are added to the Selected Products to be displayed list. • If the check box is cleared, only the products listed in the Selected Products to be displayed list are shown in the Master Log and all newly-added products are added to the Available Products list.
32 Defining filters FIGURE 537 Define Filter dialog box - Advanced tab 5. Select the Start Date check box to display only the events that were logged after the specified start date. The default start date and time is the current date and time. 6. To include events in the event filter, complete the following steps. a. Select the event type you want to include from the Event Category list. All event types are listed in alphabetical order. b.
SNMP traps a. 32 Select the event type you want to remove from the Event Category list. All event types are listed in alphabetical order. b. Select the event column for the event from the Event Column list. All event columns are listed in alphabetical order. c. Enter all or part of the event type value in the Value Contains field. d. Click the right arrow button to move the event type to the Additional Filters - Exclude these Events list. e.
32 SNMP traps • “Customizing a registered trap definition” on page 1274 • “Reverting the customization of a registered trap to default” on page 1274 Adding a trap recipient to one or more switches The SNMP Trap Recipients dialog box allows you to register any recipient as a trap recipient on selected products. You can register different recipients for different products. NOTE You can register and unregister other recipient servers on the Fabric OS switches on a per-switch basis.
SNMP traps 32 6. If the selected product is a SAN or Network OS device, select a severity from the Severity list. Severity levels can be one of the following: None, Critical, Error, Warning, Info, or Debug. The Severity list is disabled for IP products. None is the default. 7. Click the View Recipients button to list the recipients that correspond to a selected fabric or product from the Available list.
32 SNMP traps FIGURE 539 SNMP Trap Forwarding dialog box Adding a trap destination The Add Trap Destination dialog box allows you to configure destinations for forwarding SNMP traps. To add a trap destination, complete the following steps. 1. Select Monitor > SNMP Setup > Trap Forwarding. The SNMP Trap Forwarding dialog box, shown in Figure 539, displays. 2. Select the Enable trap forwarding check box. 3. Click Add in the Destinations area of the SNMP Trap Forwarding dialog box.
SNMP traps 32 FIGURE 540 Add Trap Destination dialog box 4. Enter a general description of the trap destination in the Description field. 5. Enter the IP address of the trap destination in the IP Address field. This is a mandatory field. IPv4 and IPv6 addresses are accepted, but a DNS name is not accepted. 6. Enter the SNMP trap listening port of the recipient in the Port # field. This is a mandatory field. Valid numeric values range from 1 through 65535.
32 SNMP traps FIGURE 541 Add Trap Filter dialog box 3. Enter a unique name for the trap filter in the Filter Name field. 4. Enter a general description of the trap filter in the Description field. 5. Select the Forward Application Messages check box to forward application events. 6. Select the Forward pseudo events check box to forward pseudo events. 7. Select a severity level from the Severity pulldown menu. The severity level can be one of the following, and appear in descending order of severity.
SNMP traps 32 Traps with the selected severity and those with higher severity levels are forwarded. For example, by default, Critical severity is selected. Therefore, traps with Critical, Alert, and Emergency severity levels are forwarded. To have all traps forwarded, select Debug, the lowest severity level. 8. Select the SAN, IP, or Hosts tab. Depending on the tab selected, the products available to which you can add a trap filter display in the Available Products list. 9.
32 SNMP traps FIGURE 542 Event Reception dialog box - Trap Credentials tab By default, the Management application receives SNMP v1 and v2c traps from IronWare OS and Network OS IP products that have any SNMP community strings. You can accept or restrict SNMP v1 and v2c traps by selecting one of the following check boxes in the Event Reception dialog box: • Do not accept SNMP v1/v2c traps Use this option to turn off receiving SNMP v1 and v2c traps.
SNMP traps TABLE 106 32 SNMP security and authentication SNMP credential type Privacy protocol Authentication Result v1 No authentication No privacy protocol Community string Uses a community string to match for authentication. v2c No authentication No privacy protocol Community string Uses a community string to match for authentication. v3 No authentication No privacy protocol User name Uses a user name to match for authentication.
32 SNMP traps 5. Select an authentication protocol from the Auth Protocol list. You can select -None-, HMAC-MD5, or HMAC_SHA. HMAC_MD5 is the default. If you select no authentication, the Management application uses the user name to match for authentication. 6. Type a password in the Auth Password field and re-type the password in the Auth Confirm Password field. 7. Select a privacy protocol from the Priv Protocol list. You can select -None-, CBC_DES, or CFB_AES_128.
SNMP traps 32 Importing a new MIB into the Management application The SNMP traps that the Management application receives must be registered in the Management application in order for these traps to be available. To register a trap, you must first identify the MIB file that contains the trap information in the mibs_to_compile.txt file. Then, you must register the traps using the Event Reception dialog box. To add the MIB file that contains the trap you want to register to mibs_to_compile.
32 SNMP traps Trap customization The Trap Configuration tab of the Event Reception dialog box enables you to configure the following settings: • Register and unregister various Management Information Bases (MIBs) • Customize trap description messages based on varbinds and severity and specify alias names Registering traps Traps must be registered in the Event Reception dialog box to make them available. To register traps, complete the following steps. 1. Select Monitor > SNMP Setup > Event Reception. 2.
SNMP traps 32 4. Select the trap you want to register. The SNMP name and Object Identification (OID) of the trap appear at the top line of the configuration pane. Also, the status of the trap shows Not Registered, which is the default definition of the trap. Details about the trap appear in the fields beneath the MIB Name field. Trap details supply the following information: • The name of the MIB to which the trap belongs • Information about the trap • Any variable bindings (varbinds) that the trap uses.
32 SNMP informs Customizing a registered trap definition To modify the definitions of registered traps, complete the following steps. 1. Click the Trap Configuration tab. 2. Click the Registered button. The Trap tree displays the MIBs that contain the registered traps. 3. Expand a MIB folder to display the traps that have been registered for that MIB. 4. Select a trap to display its current definition. You can change the severity, message, or alias of the trap. 5.
Syslogs 32 Enabling or disabling SNMP informs To enable or disable SNMP informs, complete the following steps. 1. Select Monitor > SNMP Setup > Informs. The SNMP Informs dialog box displays. 2. Select a product group from the Fabric / Products list. The products display in the SNMP Informs Capable Products list, where you can determine if the product’s status is enabled or disabled. 3.
32 Syslogs FIGURE 546 Syslog Recipients dialog box 2. Select Add from the Action list. 3. Enter the IP address of the syslog port (the recipient server) in the Recipient IP Address field. This is a mandatory field. IPv4 addresses are accepted, but a DNS name is not accepted. 4. Enter the syslog port of the recipient in the Recipient Port field. Valid numeric values range from 1 through 65535. The default value is 514. NOTE For Network OS and Fabric OS products, non-default ports cannot be registered. 5.
Syslogs 32 Syslog forwarding The Syslog Forwarding dialog box enables the Management application to forward syslog events to a destination on another host. You can use the Syslog Forwarding feature to set up filters to determine which syslog events will be forwarded. Adding a syslog forwarding destination The Add Syslog Destination dialog box allows you to configure destinations for forwarding syslog events. To add a syslog destination, complete the following steps. 1.
32 Syslogs FIGURE 548 Add Syslog Destination dialog box 4. Enter a general description of the syslog destination in the Description field. 5. Enter the IP address of the syslog destination in the IP Address field. This is a mandatory field. IPv4 and IPv6 addresses are accepted, but a DNS name is not accepted. 6. Enter the syslog listening port of the recipient in the Port # field. This is a mandatory field. Valid numeric values range from 1 through 65535. The default is 514. 7.
Syslogs 32 FIGURE 549 Add Syslog Filter dialog box 4. Enter a unique name for the syslog filter in the Filter Name field. 5. Enter a general description of the syslog filter in the Description field. 6. (Optional) For additional filtering, enter a text string using from 1 through 512 characters or wild card symbols in the Regular Expression field. The regular expression is used to describe a pattern in text.
32 Event action definitions 10. Select the product from the Available Products list and click the right arrow button to move it to the Selected Products list. 11. Click OK. Snort message forwarding Snort is a third-party tool that monitors network traffic in real time. When Snort detects dangerous payloads or other abnormal behavior, it sends an alert to the syslog in real time.
Event action definitions 32 FIGURE 550 Event Actions dialog box 2. Click Add to display the Identification pane of the Add Event Action dialog box. 3. Enter a name and description for the event action and select the Enabled check box. 4. Click Next to advance to the Events pane. Selecting an event for an event action To select an event for an event action, complete the following steps. 1. Select Monitor > Event Processing > Event Actions. The Event Actions dialog box displays. 2.
32 Event action definitions FIGURE 551 Add Event Action dialog box - Events pane 4. Select one of the following event types from the Show list: • • • • • Traps (default) Application Events Pseudo Events Custom Events Snort® Message Depending on what the event type you select, a box listing the available events or pseudo events displays. 5. By default, the traps are grouped under the Fabric OS, root nodes and listed in the Available Traps list, under the folders for the MIB to which they belong.
Event action definitions 32 9. If you selected Custom Events in step 4, click Next to accept the defaults; otherwise, select the Event Category, Severity, Message ID, and Description Contains, as required. 10. If you selected Snort® Message in step 4, select the Snort® messages in the left table and use the arrow button to move them to the right. To import Snort® rules, click the Import Snort® Rules button. 11.
32 Event action definitions • • • • • • • < – Less than > – Greater than >= – Greater than or equal to <= – Less than or equal to In – Matches collection Not_in – Does not match collection ~ – Arbitrary Unicode regular expression 5. Enter the value of the varbind. The value you enter must conform to the data type required by the varbind. For example, if the varbind expects an integer and you enter a text string, your entry will be rejected.
Event action definitions 32 2. Click Next to advance to the Sources pane. 3. Click the Provide the IP Address / Node WWN / Name of the source button if you want to manually enter the IP address, the world wide name (WWN), or the name of the source in the IP Address field. 4. Click the Select from the available list of sources button as an alternative to manually entering the IP address, WWN, or name of the source.
32 Event action definitions Configuring event action policies The Policy pane of the Add Event Action dialog box, shown in Figure 554, allows you to define the frequency of the event, enter a message for an event that will be displayed in the event log, and specify the event severity. FIGURE 554 Policy pane of the Add Event Action dialog box To configure the event action policies, complete the following steps. 1.
Event action definitions 32 4. Indicate how often the policy is to be reset. You can choose one of the following options: • Reset immediately - Repeats the policy as soon as the specified action has been applied. • Wait until ____ seconds or minutes - If this parameter is selected, the policy will not be applied to the product for the specified duration of time. Enter the duration in minutes or hours.
32 Event action definitions Editing event actions The Action Group - Actions pane of the Edit Event Action dialog box, shown in Figure 555, defines what action the Management application takes when the criteria are met. FIGURE 555 Action Group - Actions pane of the Edit Event Action dialog box To configure the policies for the event action, complete the following steps. 1.
Event action definitions 32 NOTE Auto Acknowledge is enabled only when Take actions for the selected events when they occur is selected in the Policy step of the Event Actions Wizard. If you edit an Event Action that has Auto Acknowledge selected and change this option in the Policy step to Time-bound or Frequency-bound, you will be required to confirm your choice. 3. Select the Alert by E-mail check box if you want an e-mail message to be sent to an administrator if the policy criteria have been met. 4.
32 Event action definitions See step 7 of “Editing event actions” on page 1288 for information on enabling special events handling for an event using the Actions pane of the Edit Event Action dialog box. Acknowledging special events When the Management application receives and processes events selected as special events, the following Special status bar icon displays: FIGURE 556 Status bar with highlighted special events icon To configure special event acknowledgements, complete the following steps. 1.
Event action definitions 32 Configuring event action e-mail settings The Action Group - E-Mail Settings pane of the Add Event Action dialog box, shown in Figure 558, allows you to select e-mail recipients from a list, add new e-mail recipients, and compose e-mail messages. FIGURE 558 Action Group - E-Mail Settings pane of the Add Event Action dialog box To configure the e-mail settings for the event action, complete the following steps. 1.
32 Event action definitions 4. If you want a prologue to be inserted at the beginning of the e-mail message, enter up to 255 characters in the Body Prologue field. The event action message follows the prologue. 5. If you want to customize and include dynamic content in the body of the e-mail message, click Configure.
Event action definitions 32 5. Change the description of the definition, if needed. You can perform this action in any of the panes of the Add Event Action dialog box. 6. Click Finish to save the new definition. Modifying an event action definition CAUTION Use caution when you modify an event action. Saving changes to an event action definition resets the runtime information for the events in the definition. To modify an existing event action definition, complete the following steps. 1.
32 Event action definitions FIGURE 559 Events pane of the Add Event Action dialog box 2. Click the Import Snort® Rule button. The Import Snort® Rule File dialog box displays, shown in Figure 560. FIGURE 560 Import Snort® Rule File dialog box 3. Enter the complete path of the Snort rule file located on the Syslog server. 4. Click OK to import the Snort rules. 5. While still in the Add Event Action dialog box, continue to click Next until you advance to the Action Group - Actions pane. 6.
Pseudo events 32 8. Continue to advance through the Add Event Action dialog box. The Summary pane of the Edit Event Action dialog box displays an overview of the e-mail configuration you are creating. 9. Review your entries and take one of the following actions: - Click Finish to approve the configuration. Click Previous to return to the Action Group - E-Mail Settings pane of the dialog box. Click Cancel to cancel the operation.
32 Pseudo events 2. Click Add. 3. The Identification pane of the Add Pseudo Event dialog box displays. 4. Type a unique name for the pseudo event. Duplicate names are not allowed. 5. Select the Enabled check box to enable the pseudo event or clear the check box to disable the pseudo event. 6. Click Next. The Policy pane of the Add Pseudo Event dialog box, shown in Figure 562, displays.
Pseudo events 32 2. Click the Resolve button to create a resolve policy, and then enter the duration of time the Event Processor waits before generating the pseudo event. Specify the resolve time in minutes or seconds. When a down event occurs, a resolving policy waits for a specified duration to see if the event remains in that state by checking if an up event occurs. If an up event occurs, a resolving pseudo event is generated by the Event Processor.
32 Pseudo events FIGURE 563 Events pane of the Add Pseudo Event dialog box 3. From the Available Traps list, select the trap for the down state of a product or interface. By default, all the traps known to the Management application are grouped under the Fabric OS, root nodes and are included in the Available Traps list, which is a list of all traps that are available based on the MIB and filter criteria. 4. Select a trap for the Selected Down Trap list and a trap for the Selected Up Trap list.
Pseudo events 32 The Pseudo Events dialog box, shown in Figure 561, displays. The name of the event action is the name of the selected action with the word “copy” appended. For example, “Event1” becomes “Event1 copy”. 4. Enter a new name for the pseudo event definition. 5. Make the changes you want to make to the definition. Refer to “Creating pseudo event definitions” on page 1295 for details. 6. Click Finish to save your definition.
32 Pseudo events 1. Select Monitor > Event Processing > Pseudo Events. The Pseudo Events dialog box displays. 2. Select one or more pseudo events and click Actions. The Source pane of the Add Event Action dialog box displays. The field values of the Identification pane and the Events pane will be automatically populated based on the selected pseudo events. For more information about adding an event action, refer to “Creating an event action definition” on page 1280.
Pseudo events • • • • • 32 “Creating an event action definition” on page 1280 “Creating a new event action definition by copying an existing definition” on page 1292 “Creating an event action with a pseudo event on the escalation policy” on page 1301 “Creating an event action with a pseudo event on the resolving policy” on page 1303 “Creating an event action with a pseudo event on the flapping policy” on page 1304 Creating an event action with a pseudo event on the escalation policy To create an event a
32 Pseudo events 14. Add additional e-mail recipient addresses in the Other Recipients field. Separate multiple e-mail addresses with a semicolon. 15. If you want the e-mail message for the alert to display a description on the subject line, enter the text in the Subject Line field. 16. If you want a prologue to be inserted at the beginning of the e-mail message, enter up to 255 characters in the Body Prologue field. The event action message follows the prologue. 17.
Pseudo events 32 9. Click Finish to complete the pseudo event configuration. Now, you must create a new event action definition using the Add Event Actions dialog box. Creating an event action with a pseudo event on the resolving policy To create an event action with a pseudo event on the resolving policy, complete the following steps. 1. Select Monitor > Event Processing > Event Actions. The Event Actions dialog box displays. 2.
32 Pseudo events Adding a pseudo event on the flapping policy The flapping policy checks to see if the event consistently transitions between two opposite states during a specified length of time. If it does, then the specified action in the definition is performed. The following two-part procedure uses both the Add Pseudo Events dialog box and the Add Event Actions dialog box to create an event action with the flapping policy. To add a pseudo event on the flapping policy, complete the following steps. 1.
Pseudo events 32 6. Select the pseudo event you created and click Next. The Sources pane of the Add Event Action dialog box displays. 7. Select the source that you will use to monitor this event from the Selected Sources list. 8. Click Next to advance to the Policy pane of the Add Event Action dialog box. The Policy pane of the Add Event Action dialog box displays. 9. Click the Take actions for the selected events when they occur button if you want to take action for the selected events when they occur.
32 Event custom reports 14. Select the Apply as a Logging Policy check box to indicate whether or not you want the event occurrence to be logged in the Management application database: • Select Log to log the occurrence in the Management application database. • Select Drop to not log the occurrence in the Management application database. 15. Click Next to advance to the Summary pane. 16. Click Finish. For more information about adding an event action, refer to “Event action definitions” on page 1280.
Event custom reports 32 Defining report settings You can configure report settings so that you see only a restricted set of information in a report. NOTE You must first enter a name and title on the Identification tab before you can run the result settings. To configure report settings, complete the following steps. 1. Select Reports > Event Custom Reports. The Event Custom Reports dialog box displays. 2. Click the Add button. 3.
32 Event custom reports • If you selected the Count column, the Management application adds the First Seen and Last Seen columns to a report. • For products that support stacking, the Port column shows the port. 6. Data for all attributes is sorted in ascending order and is sorted in the sequence that the attributes appear in the Sort By Columns list. In the Selected Columns list, select which attribute will be used to sort the generated report.
Event custom reports 32 5. In the Name field, enter a name for the definition. This name appears under the Name column on the Report Definitions tab of the Event Custom Reports dialog box. This name must be unique for each report group. This is a required parameter. 6. In the Title field, enter a title for the definition, which will be used as the title of a generated report. This is a required parameter. 7.
32 Event custom reports To filter a report definition, complete the following steps. 1. Select Reports > Event Custom Reports. The Event Custom Reports dialog box displays. 2. Click the Add button. 3. The Add/Edit Report Definition dialog box - Product tab, shown in Figure 567, displays. FIGURE 567 Add/Edit Report Definition dialog box - Product tab 4. Click the Filter tab. The Add/Edit Report Definition dialog box - Filter tab, shown in Figure 568, displays.
Event custom reports 32 FIGURE 568 Add/Edit Report Definition dialog box - Filter tab 5. To limit the search results to traps, syslog, and pseudo event messages with a specific text string, enter the text string in the Description field.
32 Event custom reports 9. Select the event type you want to include in the report from the Available Event Category list. Click the right arrow button to move your selection to the Selected Event Category list. 10. Select the event action you want to include in the report from the Available Event Actions list. Click the right arrow button to move your selection to the Selected Event Actions list. 11.
Event custom reports 32 • Click Relative Time if you want to filter traffic based on when the report is generated, and then select a relative time from the Range list. Relative time is calculated based on the date and time the report is generated. • Click Absolute Time if you want to filter traffic sent at a specific date and time. a. Select the specific start date from the Start Date list. b. Select the specific hour time for the start time from the Start Time list, and select AM or PM. c.
32 Event custom report schedules 3. When the Add/Edit Report Definition dialog box displays, modify the definition. (Refer to “Filtering a report definition” on page 1309.) 4. When you have finished, perform one of the following tasks: • If you own this definition, the OK button is available. Click OK to save your changes. • Click Run to generate the report. • Click Cancel to discard your changes and exit the Report Definitions tab of the Event Custom Reports dialog box.
Event custom report schedules 32 From the Schedules tab of the Event Custom Reports dialog box, you can perform the following tasks: • View — Displays the report data of the scheduled report definition. The View button is not enabled for a report that is listed as Not Available. • Add — Launches the Add Schedule dialog box. • Edit — Launches the Edit Schedule dialog box with the selected schedule information pre-populated. • • • • Duplicate — Creates a copy of the selected report schedule.
32 Event custom report schedules 4. Enter the name of the new schedule in the Name field. You must enter a unique name for the schedule. The name can be up to 64 characters in length and it is case-sensitive. 5. Select the Suspend schedule check box if you want to disable the schedule. For example, you may want to temporarily prevent a report from being generated until further notice. You can clear the check mark to resume the automatic generation of the report. 6.
Event logs 32 18. If you want introductory text to be included at the beginning of the e-mail message, enter the text in the Body Prologue field. The maximum number of characters supported by the Body Prologue field is 256. 19. If you want specific text to be included at the end of the e-mail message, enter that text in the Body Epilogue field. The maximum number of characters supported by the Body Epilogue field is 256.
32 Event logs Copying part of a log entry You can copy data from logs to other applications. Use this method to analyze or store the data using another tool. To copy part of an event log, complete the following steps. 1. Select Monitor > Logs > . The Logs dialog box displays the type of log you selected. 2. Select the rows you want to copy: • To select contiguous rows, select the first row you want to copy, press Shift, and click the contiguous row or rows you want to copy.
Event logs 32 2. Right-click a row and select Export Table. The Save table to a tab delimited file dialog box displays. 3. Browse to the location where you want to export the data. 4. Enter a name for the file in the File Name field. 5. Click Save. All data and column headings are exported to the text file. 6. Click Close to close the dialog box. E-mailing all event details from the Master Log NOTE You must configure e-mail notification before you can e-mail event details from the Master Log.
32 Event logs To display event details from the Master Log, complete the following steps. 1. Right-click an entry in the Master Log. 2. Select Properties. The Event Properties dialog box, shown in Table 107, displays. 3. Review the information. TABLE 107 Event Properties Event Field Description Probable Cause The most likely reason the event occurred. Description A description of the event. Count Number of times this event occurred on the host.
Event logs 32 Finding the device associated with an event You can locate a device on which an event was triggered by right-clicking the event and selecting Locate. The device displays highlighted in the Product List and Topology Map. NOTE Locate does not locate devices in automatically collapsed fabrics. You must expand the fabric (right-click and select Expand) and repeat the locate command. Copying part of the Master Log You can copy data from logs to other applications.
32 Event logs Exporting the Master Log You can export the Master Log to a tab-delimited text file. Use this method to analyze or store the data using another tool. To export the Master Log, complete the following steps. 1. Right-click an entry in the Master Log. 2. Select Table > Export Table. The Save table to a tab delimited file dialog box displays. 3. Browse to the location where you want to export the data. 4. Enter a name for the file in the File Name field. 5. Click Save.
Event logs 32 The Define Filters dialog box displays. FIGURE 573 Define Filter dialog box - Basic tab, IP tab selected 3. Use the following to include or exclude products. • To include an event type in the filter, select the event from the Available Products list and click the right arrow. • To exclude an event type from the filter, select the event from the Selected Products to be displayed list and click the left arrow. • To include all products, select the Allow All Products check box. 4.
32 Event logs • Debug • Unknown Clear the severity level check boxes to turn off the filter for the selected events. 6. (Optional) To filter events based on a string (such as telnet or login) that appears in the event description, select the Events Description check box and enter the string that the filter is to use in the associated text box. 7. Enter a name for the filter in the Name field. The Filter name length is limited to 128 alphanumeric characters.
Event logs 32 Notes on filters • Changing the filter in one client session does not alter the filter selection on other clients. However, if the currently selected filter is updated, once the filter is saved, the Master Log is reloaded to reflect the changes to that filter. This affects all your client sessions. • If the currently selected filter is deleted, the Master Log is reloaded, and changes the selected filter to none for all your client sessions.
32 1326 Event logs Brocade Network Advisor SAN User Manual 53-1003154-01
Chapter 33 Monitoring and Alerting Policy Suite In this chapter • Monitoring and Alerting Policy Suite overview. . . . . . . . . . . . . . . . . . . . . • MAPS interoperability with other features . . . . . . . . . . . . . . . . . . . . . . . . • MAPS category, object, and measure hierarchy . . . . . . . . . . . . . . . . . . . • MAPS monitoring categories. . . . . . . . . . . . . . . . . . . . . . . . . . . . . . . . . . . • MAPS policies . . . . . . . . . . . . . . . . . . . . . . . . . . . . . . . . .
33 Monitoring and Alerting Policy Suite overview Supported hardware MAPS is only supported on Fabric OS devices running Fabric OS 7.2.0 or later. NOTE MAPS is not supported on DCB devices. MAPS license requirements MAPS is supported on all versions of the Management application with SAN management. MAPS is supported on Fabric OS devices running 7.1 or earlier with the Fabric Watch and Performance Monitor license. MAPS is supported on Fabric OS devices running 7.2 or later with the Fabric Vision license.
Monitoring and Alerting Policy Suite overview 33 Enabling MAPS on a device You can enable MAPS on one or more devices at the same time. Enabling MAPS on a device converts existing Fabric Watch thresholds to MAPS policies and the active thresholds currently monitored by Fabric Watch will continue to be monitored through MAPS. 1. Select Monitor > Fabric Vision > MAPS > Enable. The Enable MAPS dialog box displays (Figure 574).
33 MAPS interoperability with other features MAPS interoperability with other features Virtual Fabrics MAPS is a logical switch-specific feature. Different logical switches can have different MAPS configurations for the needs of the specific logical switch. When you enable MAPS on the Virtual Fabric-enabled switch, MAPS is enabled, with the same active policy, on all Fabric Identifiers (FIDs). Configuration upload and download MAPS configuration is stored in separate configuration files.
MAPS interoperability with other features 33 Launch Fabric Watch — A “None of the Fabric Watch specific operations can be performed on this switch because the MAPS (Monitoring and Alerting Policy Suite) are enabled.” error message displays. • Replicate Fabric Watch configuration — If you select a Fabric Watch configuration to replicate, the Management application filters the MAPs-enabled switches from Source Configuration and Destination Switches steps of the replicate configuration wizard.
33 MAPS interoperability with other features TABLE 108 Fabric Watch supported RAS event IDs Category Measure Unit label RAS event ID Port Health CRC — CRC errors Count 1182 ITW — Invalid transmit words Count 1178 LOSS_SYNC — Loss of synchronization Count 1166 LF — Link failure Count 1162 LOSS_SIGNAL — Signal loss Count 1170 PE — Protocol errors Count 1174 LR — Link reset Count 1198 C3TXTO — Class 3 timeout Count 1202 STATE_CHG — State changes Count 1194 CURRENT — SFP tran
33 MAPS interoperability with other features TABLE 108 Fabric Watch supported RAS event IDs (Continued) Category Measure Unit label RAS event ID Fabric State Changes DID_CHG — Domain ID change Count 1123 FLOGI — Fabric login Count 1135 FAB_CFG — Fabric reconfigurations Count 1119 EPORT_DOWN — E_Ports down Count 1115 FAB_SEG — Fabric segmentation Count 1127 ZONE_CHG — Zone changes Count 1131 L2_DEVCNT_PER — Layer 2 device count Count N/A LSAN_DEVCNT_PER — LSAN device count Coun
33 MAPS category, object, and measure hierarchy TABLE 108 Fabric Watch supported RAS event IDs (Continued) Category Measure Unit label RAS event ID Switch Resources TEMP — Temperature sensor N/A 1002 1003 1004 FLASH_USAGE — Flash usage % 1402 CPU — CPU usage % 1404 MEMORY_USAGE — Memory usage % 1404 1406 ETH_MGMT_PORT_STATE — Ethernet management port state % N/A CIR_STATE — FCIP circuit state changes N/A 3020 CIR_UTIL — FCIP circuit utilization % 3012 CIR_PKTLOSS — FCIP packet
MAPS category, object, and measure hierarchy 33 MAPS structural elements MAPS has the following structural elements: categories, groups, rules, and policies. Table 109 provides a brief description of each structural element. TABLE 109 MAPS structural elements Element Description Action What MAPS is to do if a condition defined in a rule evaluates to true. For more information, refer to “MAPS actions” on page 1347.
33 MAPS category, object, and measure hierarchy TABLE 110 Monitors and actions by category (Continued) Category Objects Measures Possible actions Switch Policy Status Chassis • • • • • • • • • • • • • • • • • • • • • • • • • • • • • • • • • • • • • • • BAD_PWR — Absent or faulty power supply BAD_TEMP — Temperature sensors outside range BAD_FAN — Absent or faulty fans FLASH_USAGE2 — Flash usage WWN_DOWN — WWN faulty or down DOWN_Core — Core blade monitoring FAULTY_BLADE — Faulty blades HA_SYNC — H
MAPS monitoring categories TABLE 110 33 Monitors and actions by category (Continued) Category Objects Measures Possible actions FCIP Circuit CIR_STATE — FCIP circuit state changes CIR_UTIL — FCIP circuit utilization CIR_PKTLOSS — FCIP packet loss PKTLOSS — FCIP tunnel packet loss3 RTT — Round-trip time of the circuit Jitter — The variance in round-trip time of the circuit TUNNEL_UTIL — Tunnel utilization TUNNEL_STATE — FCIP tunnel status • • • • RAS Log Event Fence (CIR_STATE) SNMP Trap E-mail
33 MAPS monitoring categories TABLE 111 Port measures Measure Description Cyclic redundancy check (CRC) The number of times an invalid cyclic redundancy check error occurs on a port or a frame that computes to an invalid CRC. Invalid CRCs can represent noise on the network. Such frames are recoverable by retransmission. Invalid CRCs can indicate a potential hardware problem. Invalid transmission words (ITW) The number of times an invalid transmission word error occurs on a port.
MAPS monitoring categories 33 Switch Status monitoring category The Switch Status category enables you to monitor the health of the switch by defining the number of types of errors that transitions the overall switch state into a state that is not healthy. For example, you can specify a switch policy so that if a switch has two port failures, it is considered to be in a marginal state; if it has four failures, it is in a down state.
33 MAPS monitoring categories TABLE 113 1340 Fabric measures (Continued) Measure Description Fabric reconfigurations (FAB_CFG) Tracks the number of reconfigurations of the fabric. Fabric reconfiguration occurs when: • Two fabrics with the same domain ID are connected. • Two fabrics are joined. • An E_Port or VE_Port goes offline. • A principal link segments from the fabric. Down E_Port (EPORT_DOWN) Tracks the number of times that an E_Port or VE_Port goes down.
MAPS monitoring categories TABLE 113 33 Fabric measures (Continued) Measure Description BB_FCR_CNT Tracks the number of Fibre Channel routers present on the backbone fabric. ZONE_CFGSZ_PER Tracks the zone configuration size limit per switch. FRU monitoring category The FRU category enables you to define rules for field replaceable units (FRU), including ports, power supplies, and flash memory. Table 114 lists measures in the FRU category and describes each measure.
33 MAPS monitoring categories TABLE 115 Security measures (Continued) Measure Description Telnet violations (SEC_TELNET) Telnet violations that occur when a Telnet connection request reaches a secure switch from an unauthorized IP address. TS out of sync (SEC_TS) Time Server (TS) violations that occur when an out-of-synchronization error has been detected. Resource monitoring category The Resource category monitors the system RAM, flash, CPU, and memory.
MAPS monitoring categories TABLE 117 FCIP measures (Continued) Measure Description FCIP circuit packet loss (CIR_PKTLOSS) The number of packets routed through a port exceeds the port bandwidth. FCIP tunnel packet loss (PKTLOSS)1 Monitors the number of retransmitted packets in the tunnel. Round trip time (RTT) 1 Monitors the round-trip time of the circuit. 1 Monitors the variance in round-trip time of the circuit. Jitter 1 Monitors throughput in the channel.
33 MAPS policies FPI monitoring category The FPI category groups areas that measures the thresholds on the performance of the fabric. Table 119 lists measures in the FPI category and describes the measure. TABLE 119 FPI measures Measure Description Device Latency Impact (DEV_LATENCY_IMPACT) The Latency impact of the device. MAPS policies A MAPS policy is a set of rules that define thresholds for measures and action to take when a threshold is triggered.
MAPS policies 33 User-defined policies MAPS allows you to define your own policies. You can create a policy and add rules to it, or you can clone one of the default policies and modify the cloned policy. For information on configuring a user-defined policies, refer to “Configuring a MAPS policy” on page 1353. Fabric Watch legacy policies You cannot return Fabric Watch once you activate MAPS (or migrate to MAPS).
33 MAPS rules MAPS rules A rule associates a condition with actions that need to be triggered when the specified condition is evaluated to be true. Each rule specifies the following items: • A group of objects to be evaluated. Refer to “MAPS groups” on page 1365 for additional information. • The measure to be monitored. Refer to “MAPS monitoring categories” on page 1337 for additional information. • The condition. Each rule specifies a single condition. A condition includes a time base and a threshold.
MAPS actions 33 MAPS actions MAPS provides actions (event notifications) in several different formats to ensure that event details are accessible from all platforms and operating systems. In response to an event, MAPS can record event data as any (or all) of the following alarm options. To enable MAPS actions, refer to “Enabling or disabling policy actions for all policies” on page 1349.
33 MAPS actions E-mail An e-mail alert sends information about a switch event to a specified e-mail address. An e-mail alert can send information about any error from any element, area, and class (only one e-mail recipient can be configured per class). The e-mail alert specifies the threshold and describes the event, much like an error message. To configure multiple e-mail recipients, refer to “Configuring e-mail notification” on page 1350.
MAPS actions 33 SNMP MIB support MAPS requires SNMP management information base (MIB) support on the device for management information collection. For a list of required MIBs, refer to Table 120.
33 MAPS actions • Switch Status Critical — Use to set the switch status to critical • Switch Status Marginal. — Use to set the switch status to marginal. For a complete list of categories and the associated measures and actions, refer to “MAPS categories, measures, and actions” on page 1335. 4. Click OK on the MAPS Policy Actions dialog box. 5. Click Close on the MAPS Configuration dialog box.
MAPS actions 33 5. Enter the domain name in the Domain Name field. Domain name is a physical chassis setting. This setting affects all logical switches in the physical chassis. 6. Click OK on the MAPS E-Mail Setup dialog box. 7. Click Close on the MAPS Configuration dialog box. Viewing MAPS policy data You can view the MAPS-capable devices and the associated MAPS policies and actions. 1. Right-click a device in the Product List or Connectivity Map and select Fabric Vision > MAPS > Configure.
33 MAPS actions NOTE The active policy indicates an active status icon in the Policies column of the Switch row and Active Policy row. - RAS Log Event — If check mark displays, logs a RAS event when triggered. - Port Decommission — If check mark displays, decommissions the port , when triggered. - Switch Status Marginal. — If check mark displays, sets the switch status to marginal when triggered. - Switch Status Critical — If check mark displays, sets the switch status to critical when triggered.
MAPS actions 33 • Distribute button — Select a policy and click to replicate the policy to all devices in a fabric or SAN. For more information, refer to “Replicating a policy to other devices” on page 1359. • Manage button in the Groups area — Select the fabric or switch for which you want to edit groups and click to open the Manage Groups - MAPS dialog box. For more information, refer to “Editing multiple groups” on page 1373. • Compare button — Click to compare two policies across the fabric.
33 MAPS actions 4. Select one of the following category tabs to configure the policy measures. For a complete list of categories and the associated measures and actions, refer to “MAPS categories, measures, and actions” on page 1335. Options include: • Port tab — Rules defined on this tab measure thresholds on ports or SFPs to determine if an out of range violation is sent for the port.
MAPS actions 33 • Select the Custom option to provide a user-defined name and enter a name in the Custom field. The rule name can be up to 40 characters and can only contain of alphanumeric and underscore characters. 6. Select a measure from the Measure list. Available measures depend on the selected category. For a complete list of categories and the associated measures and actions, refer to “MAPS categories, measures, and actions” on page 1335. 7. Select a logical operator from the Threshold list.
33 MAPS actions Editing a MAPS policy 1. Right-click a device in the Product List or Connectivity Map and select Fabric Vision > MAPS > Configure. The MAPS Configuration dialog box displays. 2. Select any non-default policy in the list and select Edit. You can also select the switch in the list and select Edit to edit the active policy. When you edit the active policy on the switch, updated rules activate on the switch automatically. NOTE You cannot edit a default policy.
MAPS actions 33 Importing Flow definitions You can import a flow definition into MAPS for threshold monitoring. 1. Right-click a device in the Product List or Connectivity Map and select Fabric Vision > MAPS > Configure. The MAPS Configuration dialog box displays. 2. Select a policy in the list and click Add. The Add Policy dialog box displays. 3. Click the Traffic / Flows tab. 4. Click Import. The Import Flow Definitions dialog box displays.
33 MAPS actions • • • • • • • • • • • LUN — The LUN values defined in the flow. Bi-direction — Whether or not the flow is bi-directional. Zone Check — The zone checks defined in the flow Flow Definition Persistence — Whether or not to persist flow definition over device reboot. Data Type — The data type defined for the flow. Routing Control — The routing control defined in the flow. QOS — The Quality of Service (QOS) defined for the flow. Offset — The offset value defined in the flow.
MAPS actions 33 Activating a MAPS policy 1. Right-click a device in the Product List or Connectivity Map and select Fabric Vision > MAPS > Configure. The MAPS Configuration dialog box displays. 2. Select an inactive policy in the list and click Activate. Only one policy can be active on a switch at a time. You can activate policies for multiple switches at once by selecting the policy you want to activate for each switch and clicking Activate.
33 MAPS actions 5. Click OK on the Distribution Options dialog box. The selected policy is replicated on all MAPS-capable devices in the selected fabric or SAN. If you chose to activate the policy after distribution, the selected policy is activated on the target devices and the source device, if necessary. NOTE If the fabric contains a switch running an earlier version of Fabric OS, the rules supporting the earlier version are discarded.
MAPS actions 33 Deleting a MAPS policy NOTE You cannot delete default or active policies. 1. Right-click a device in the Product List or Connectivity Map and select Fabric Vision > MAPS > Configure. The MAPS Configuration dialog box displays. 2. Select the policies you want to delete in the list and select the Delete. You can delete one or more policies from the same switch or multiple switches. A confirmation message displays. 3. Click Yes on the confirmation message. 4.
33 MAPS actions FIGURE 577 View Policy dialog box 3. Select one of the category tabs to view the rules defined for the policy. For a complete list of categories and the associated measures and actions, refer to “MAPS categories, measures, and actions” on page 1335. Options include: • Port tab — Rules defined on this tab measure thresholds on ports or SFPs to determine if an out of range violation is sent for the port.
MAPS actions 33 Each tab contains the following fields and components: • Rules list — Lists the rules defined for the selected policy. • Groups/Rules — Displays the default groups (under the System Groups node) and user-defined groups (under the Custom Groups node) for the selected switch. The available groups in the Rules table depend on the measure you selected in the Add/Edit Threshold area. For example, if you selected an SFP measure, only SFP groups become available.
33 MAPS actions trfgt FIGURE 578 Compare MAPS dialog box The Compare dialog box displays the following information: • Switch - Displays the switch containing the selected policy. • Policy -Displays the name of the selected policy. • Change Navigator buttons - These buttons help to navigate between the differences in the policy contents. • Differences Legend - Displays the color legend for differences in policy contents.
MAPS groups 33 MAPS groups A MAPS group is a collection of similar objects that you can monitor as a single entity. You can create a group of objects and then use that group in rules, thus simplifying rule configuration and management. For example, you can create a group of UNIX ports, and then create specific rules for monitoring this group. Preconfigured groups MAPS provides several preconfigured groups. You cannot edit or delete a preconfigured group.
33 MAPS groups TABLE 121 Pre-configured groups Pre-configured group name Element type Description ALL_TUNNEL_F_QOS Tunnel All tunnel F QoS monitors bandwidth at the expense of the lowest priority. SWITCH Switch Default group used to define rules on global parameters for the entire switch; for example, security violations or fabric health. CHASSIS Chassis Default group used to define rules on global parameters for the entire chassis; for example, CPU, Flash, and so on.
MAPS groups 33 FIGURE 579 Add Port Group dialog box i. Enter a unique name for the group in the Name field. The name can be up to 32 characters and can only contain alphanumeric and underscore characters. ii. Add objects to the group by selecting the object (port or circuit) in the Available Ports/Circuits list and clicking the right arrow button. The selected objects move from the Available Ports/Circuits list to the Force Include list. iii.
33 MAPS groups FIGURE 580 Add Group dialog box i. Enter a unique name for the group in the Name field. The name can be up to 32 characters and can only contain alphanumeric and underscore characters. ii. Add objects to the group by selecting the object (port or circuit) in the Available Ports/Circuits list and clicking the right arrow button. The selected objects move from the Available Ports/Circuits list to the Selected Ports/Circuits list. iii.
MAPS groups 33 Editing a group If a new object, such as host, target, or SFP transceiver is added to a fabric, you can monitor the object using existing rules for similar objects. The group must be the same type as the new object you want to monitor (port, circuit, or SFP). The object is automatically monitored using the existing rules that have been set up for the group, as long as the rules are in the active policy. You do not need to re-enable the active policy. 1.
33 MAPS groups 7. Configure policies and rules for the group. For more information, refer to “Configuring a MAPS policy” on page 1353. 8. Click OK on the Edit Policy dialog box. 9. Click Close on the MAPS Configuration dialog box. Deleting a group NOTE You cannot delete a default group or any group that contains a rule. 1. Right-click a device in the Product List or Connectivity Map and select Fabric Vision > MAPS > Configure. The MAPS Configuration dialog box displays. 2.
MAPS groups 33 FIGURE 582 Fabric/Device_Name - Manage MAPS Groups dialog box b. The Fabric/Device _Name - Manage MAPS Groups dialog box displays (Figure 583) with a list of all configured Port groups on the selected fabric or device in the Groups area. FIGURE 583 Fabric/Device_Name - Manage MAPS Groups dialog box 3. Review the group details: Sort the contents by clicking the column header (Name or Type). Click the same column header again to reverse the sort order.
33 MAPS groups • Available Ports/Circuits list — List of available ports, SFPs, or circuits and the associated products for the selected group. Group/Product — Available devices and ports Name — Device name, port name, or circuit name IP Address — IP address of the device Product Type — Product type (such as switch or blade) Left and right arrow buttons — Click to move ports, SFPs, or circuits between the Selected Ports/Circuits list and Selected Ports/Circuits list.
MAPS groups 33 8. Click OK on the Fabric/Device _Name - Manage MAPS Groups dialog box. 9. Click Close on the MAPS Configuration dialog box. Editing multiple groups You can edit one or more groups that are in the same fabric or device. 1. Right-click a device in the Product List or Connectivity Map and select Fabric Vision > MAPS > Configure. The MAPS Configuration dialog box displays. 2. Select a fabric or device in the SAN/Fabric/Switch list and click Manage.
33 MAPS violations 3. Select the group you want to delete in the Groups list. A confirmation message displays. 4. Click Yes on the confirmation message. The selected group is deleted from Groups list. 5. Repeat step 3 and step 4 for each group you want to delete. 6. Click OK on the Fabric/Device _Name - Manage MAPS Groups dialog box. 7. Click Close on the MAPS Configuration dialog box. MAPS violations MAPS violation data is stored in the database for 30 days.
MAPS violations 33 • 12 Hours — Displays data for the previous 12 hours beginning when the Violations dialog box is displayed. • 1 Day — Displays data for the previous day beginning when the Violations dialog box is displayed. • 3 Days — Displays data for the previous 3 days beginning when the Violations dialog box is displayed. • 1 Week — Displays data for the previous week beginning when the Violations dialog box is displayed.
33 MAPS events E-mail SFP Marginal (Port SFP status) Measure Value (MAPS and Fabric Watch support) — Value of the measure when the violation occurred. • • Units (MAPS and Fabric Watch support) — The units description of the measure value. • Recommended Action (MAPS and Fabric Watch support) — Fabric OS recommended action for the violation. You can wrap text in this column by right-clicking the column header and selecting the Wrap check box. 4.
MAPS events 33 1. Right-click a device in the Product List or Connectivity Map and select Fabric Vision > MAPS > Violations. The Violations dialog box displays. 2. Display data for a specific duration by selecting one of the following options from the Range list: • 30 Minutes (default) — Displays data for the previous half hour beginning when the Violations dialog box is displayed. • 1 Hour — Displays data for the previous hour beginning when the Violations dialog box is displayed.
33 MAPS events If the number of events within the selected the time range exceeds the maximum number of events (200), the time range changes for the maximum number of events. For example, if you selected 1 hour as the time range but the maximum number of events occurred within 30 minutes, then events display for 15 minutes before and after the selected violations. 4. Review the detailed data.
MAPS integration with other features 33 MAPS integration with other features Dashboard MAPS widgets The MAPS widgets display on the main Dashboard tab (refer to “Monitoring and Alerting Policy Suite widgets” on page 292). The Management application provides the following preconfigured MAPS widgets: • Out of Range Violations widget — Table view of all out of range threshold violations reported in your SAN (refer to “Out of Range Violations widget” on page 293).
33 1380 MAPS integration with other features Brocade Network Advisor SAN User Manual 53-1003154-01
Chapter Technical Support 34 In this chapter • Server and client support save. . . . . . . . . . . . . . . . . . . . . . . . . . . . . . . . . 1381 • Device technical support . . . . . . . . . . . . . . . . . . . . . . . . . . . . . . . . . . . . . 1385 • Upload failure data capture . . . . . . . . . . . . . . . . . . . . . . . . . . . . . . . . . . . 1392 Server and client support save You can use Technical Support to collect SupportSave data for the Management server and clients.
34 Server and client support save 4. Select the Include Database check box to include the database in the support save and choose one of the following options. • Select the Partial (Excludes historical performance data and events) option to exclude historical performance data and events from the database capture. • Select the Full option to capture the entire database. Clear the Include Database check box to exclude the database in the support save. 5.
Server and client support save 34 4. Enter a file name for the server support save file in the File Name field. The default file name is DCM-SS-Time_Stamp. 5. Select the Include Database check box to include the database in the support save and choose one of the following options. • Select the Partial (Excludes historical performance data and events) option to exclude historical performance data and events from the database capture. • Select the Full option to capture the entire database.
34 Server and client support save Client support save using a command line interface Use the following procedures to capture client support save files through the command line interface (CLI). Capturing client support save using the CLI (Windows) To capture client support save files through the CLI, complete the following steps. 1. Go to the following location: • (Local client) User_Home/Management_Application_Name/localhost • (Remote client) User_Home/Management_Application_Name/Server IP 2.
Device technical support 34 Device technical support You can use Technical Support to collect SupportSave data (such as RASLOG, TRACE, and so on) and switch events from Fabric OS devices. To gather technical support information for the Management application server, refer to “Capturing technical support information” on page 455. Scheduling technical support information collection You can capture technical support and event information for up to 50 devices.
34 Device technical support 7. Click the SAN Products tab, if necessary, and complete the following steps. The Available SAN Products table displays the following information: • • • • • • • • • • • • • • • • • All Levels — All discovered devices and ports as both text and icons. a. Right-click in the Available SAN Products table and select Expand All. b.
Device technical support 34 The Selected Products and Hosts table displays the following information: IP Address — The IP address of the selected product or host. Name — The name of the selected product or host. WWN — The world wide name of the selected product or host. Firmware Type — The type of firmware: FOS (Fabric OS). Firmware version — The firmware version of the selected product or host. Support Save Credentials — Whether the product or host has supportSave credentials or not.
34 Device technical support a. Right-click in the Available SAN Products table and select Expand All. b. Select the switches you want to collect data for in the Available SAN Products table and click the right arrow to move them to the Selected Products and Hosts table.
Device technical support 34 Viewing the technical support repository You can only view technical support save files that are captured in the default location. Table 122 details the default locations for the technical support save files.
34 Device technical support Saving technical support information to another location To save technical support information to a location other than the default, complete the following steps. 1. Select Monitor > Technical Support > View Repository. The Technical Support Repository dialog box displays. 2. Select a device support save file and click Save. The Save dialog box displays. 3. Browse to the location where you want to save the support file. 4. Click Save on the Save dialog box. 5.
Device technical support 34 Copying technical support information to an external FTP server NOTE You cannot copy technical support information to an external FTP server collected from the remote client. To copy the SupportSave data located in the built-in FTP server to an external FTP server, complete the following steps. 1. Select Monitor > Technical Support > View Repository. The Technical Support Repository dialog box displays. 2. Select the file you want to copy in the table. 3.
34 Upload failure data capture Upload failure data capture You can use upload failure data capture to enable, disable, and purge failure data capture files as well as configure the FTP Host for the switch. NOTE Upload failure data capture is only supported on Fabric OS devices. Enabling upload failure data capture 1. Select Monitor > Technical Support > Upload Failure Data Capture. The Upload Failure Data Capture dialog box displays. FIGURE 586 Upload Failure Data Capture dialog box 2.
Upload failure data capture • • • • • 34 Location — The customer site location. Contact — The primary contact at the customer site. Description — A description of the customer site. State — The switch state, for example, online or offline. Status — The operational status of the switch, for example, unknown or marginal. 3. Click the right arrow button.
34 Upload failure data capture Purging upload failure data capture files NOTE Upload Failure Data Capture is only supported on Fabric OS devices. 1. Select Monitor > Technical Support > Upload Failure Data Capture. The Upload Failure Data Capture dialog box displays. 2. Select the Purge Upload Failure Data Capture Files check box to enable purging the trace dump files. 3. Select how often (days) you want to purge the trace dump data from the Purge Upload Failure Data Capture Files list. 4.
Upload failure data capture 34 Saving the upload failure data capture repository NOTE Upload Failure Data Capture is only supported on Fabric OS devices. 1. Select Monitor > Technical Support > View Repository. The Repository dialog box displays. 2. Select the Switches tab to view upload failure data capture information. 3. Select the trace dump file you want to save and click Save. 4. Browse to the location you want to save the file and click OK. 5. Click OK on the Repository dialog box.
34 1396 Upload failure data capture Brocade Network Advisor SAN User Manual 53-1003154-01
Chapter 35 Reports In this chapter • Reports overview . . . . . . . . . . . . . . . . . . . . . . . . . . . . . . . . . . . . . . . . . . . . . • SAN report types . . . . . . . . . . . . . . . . . . . . . . . . . . . . . . . . . . . . . . . . . . . . • Generating SAN reports . . . . . . . . . . . . . . . . . . . . . . . . . . . . . . . . . . . . . . • Viewing SAN reports . . . . . . . . . . . . . . . . . . . . . . . . . . . . . . . . . . . . . . . . . • Exporting SAN reports . . . . . . . . . . . . . . .
35 SAN report types SAN report types Presenting and archiving data about a SAN is equally as important as gathering the data. Through the Management application, you can generate reports about the SAN. You can send the reports to network administrators, support consultants, and others interested in the SAN’s architecture, or archive the reports for future reference.
Viewing SAN reports 35 Viewing SAN reports You can view any report generated in the SAN. To view reports, complete the following steps. 1. Select Reports > View or click the View Report icon. The View Reports dialog box displays. 2. Select the report you want to view in the All Reports list. If you do not see the report you want to view, generate it first by following the instructions in “Generating SAN reports” on page 1398. You can select reports by Time, Report Type, or User. 3.
35 Viewing SAN reports Fabric Summary Report The Fabric Summary Report (Figure 587) provides a summary of the discovered fabrics as well as Switch and Access Gateway devices associated with the fabric. FIGURE 587 Fabric Summary Report Table 123 describes the fields and components of the Fabric Summary Report. TABLE 123 Fabric Summary Report fields and components Field/Component Description Server The name of the Management application server.
Viewing SAN reports TABLE 123 35 Fabric Summary Report fields and components (Continued) Field/Component Description Switch WWN The world wide name of the switch. Firmware Version The firmware version of the switch. Switch Type The type of the switch. For example, Encryption SAN switch. Serial # The serial number of the switch. Factory Serial # The factory serial number of the switch. # of Ports The number of ports on the switch. Total number of AGs The number of AGs in the fabric.
35 Viewing SAN reports TABLE 123 Fabric Summary Report fields and components (Continued) Field/Component Description Switch Name The name of the switch. Domain ID The Domain ID of the switch. Port # The port number. ISL/Trunk Whether it is an ISL or Trunk. Fabric Ports Report The Fabric Ports Report (Figure 588) provides a summary of the discovered ports including used and unused ports.
Viewing SAN reports TABLE 124 35 Fabric Ports Report fields and components (Continued) Field/Component Description Director Utilization Total Number of Ports The total number of director ports. Number of Ports connected The number of connected ports on a director. Number of Ports Free The number of free ports on a director. Number of Ports allocated The number of allocated ports on a director. Switch Utilization Total Number of Ports The total number of switch ports.
35 Exporting SAN reports Exporting SAN reports To export reports, complete the following steps. 1. Select Reports > View or click the View Report icon. The View Reports dialog box displays. 2. Select the report you want to export in the All Reports list. If you do not see the report you want to export, generate it first by following the instructions in “Generating SAN reports” on page 1398. You can select reports by Time, Report Type, or User. 3.
Deleting SAN reports 35 Deleting SAN reports To delete reports, complete the following steps. 1. Select Reports > View or click the View Report icon. The View Reports dialog box displays. 2. Select the report you want to delete in the All Reports list. You can select reports by Time, Report Type, or User. 3. Click Delete Report. ATTENTION Once you click Delete Report, the report is deleted without confirmation. 4. Click Close to close the View Reports dialog box. 5.
35 Generating SAN performance reports iii. Select the ports (Ctrl or Shift + click to select multiple ports) from which you want to gather performance data from the Available table and click the right arrow button. The selected ports move to the Select Ports table. iv. Click OK. c. Select the historical period from which you want to gather performance data from the For list. If you select Custom, complete the following steps. d. i.
Generating SAN zoning reports 35 Generating SAN zoning reports The Management application enables you to generate a report for the current zone DB in the fabric. To generate a report for the edited zone DB, you must save it to the fabric first. Make sure no one else is making changes to the same area prior to submitting or your changes may be lost. To generate zoning reports, complete the following steps. 1. Select Configure > Zoning or right-click the device and select Zoning.
35 Host adapter reports 2. Select the report you want to generate: • Host Adapter Inventory • Host Adapter Faulty SFP 3. Select the fabrics for which you want to generate reports. 4. Click OK. The selected report displays in the View Reports dialog box. This report includes data for all Hosts discovered through Host Adapter discovery. Adapters Inventory report The Adapters Inventory report only displays adapters and ports discovered through Host Adapter discovery.
Host adapter reports TABLE 125 35 Adapters Inventory report fields and components (Continued) Field/Component Description Node WWN/MAC The port’s WWN or MAC address. Port WWN/MAC The node’s (parent device) WWN or MAC address. Type The type of port, for example, IP-Port, N, or NL. QoS Enabled Whether QoS is enabled (True) or disabled (False). Frame Field Size (Bytes) The frame field size in bytes. Media The type of media; for example, 8G-sw (8 Gbps software).
35 Host adapter reports TABLE 126 1410 Adapters Faulty SFP report fields and components (Continued) Field/Component Description Encoding Displays how the extended link is encoded, for example, 8B10B. Baud Rate The transmission rate, roughly equivalent to the number of bits per second. Length 9U1 The length of the single-mode fiber-optic cable, used in situations where gigabit performance is not required (for distances greater than 100 meters).
Appendix A Application menus In this appendix • Dashboard main menus . . . . . . . . . . . . . . . . . . . . . . . . . . . . . . . . . . . . . . . 1411 • SAN main menus . . . . . . . . . . . . . . . . . . . . . . . . . . . . . . . . . . . . . . . . . . . . . 1412 • SAN shortcut menus . . . . . . . . . . . . . . . . . . . . . . . . . . . . . . . . . . . . . . . . . 1422 Dashboard main menus The menu bar is located at the top of the main window.
A SAN main menus Menu Command Command Options License — Select to view or change your License information. About Management_Application_Name — Select to view the application information, such as the company information and release number. SAN main menus The menu bar is located at the top of the main window. The following table outlines the many functions available on each menu. Menu Command Command Options Server Menu Users — Select to configure users and user groups.
SAN main menus Menu Command A Command Options View Menu Show Main Tab — Select to choose which tab to display. Dashboard — Select to show the dashboard. SAN — Select to show the SAN tab. IP — Select to show the IP tab. Show Panels — Select to select which panels to display. All Panels — Select to show all panels. Topology Map — Select to only show the topology map. Product List — Select to only show the Product List. Master Log — Select to only show the Master Log.
A SAN main menus Menu Command Command Options Map Display — Select to customize a group's layout to make it easier to view the SAN and manage its devices. Domain ID/Port # — Select to set the display domain IDs and port numbers in decimal or hex format. Decimal — Select to display all domain IDs and port numbers in decimal format. Hex — Select to display all domain IDs in hex format. Product Label — Select to configure which product labels display.
SAN main menus Menu Command A Command Options Host Adapters — Select to discover hosts. VM Managers — Select to discover VM managers. VCEM Managers — Select to discover Virtual Connect Enterprise Managers. Host Port Mapping — (Trial and Licensed version Only) Select to manually map HBA ports to a host. Storage Port Mapping — (Trial and Licensed version Only) Select to manually map Storage Ports to a Storage Device or other Storage Ports.
A Menu SAN main menus Command Command Options Configuration File Manager— (Trial and Licensed version Only) Select to manage device configurations from the repository. Schedule Backup — (Trial and Licensed version Only) Select to schedule configuration backup. Replicate — (Trial and Licensed version Only) Select to replicate the switch Configuration or Security. Task Scheduler — Select to manage deployment. DCB — Select to manage a DCB switch, port, or link aggregation group (LAG).
SAN main menus Menu Command A Command Options Recommission — Select to recommission an individual port or all ports on a blade or switch. Routing — (Trial and Licensed version Only) Select to manage a selected router. Configuration — (Trial and Licensed version Only) Select to view the R_Ports on a router. Domain IDs — (Trial and Licensed version Only) Select to configure the router domain IDs. Security — Select to manage security.
A SAN main menus Menu Command Command Options Monitor Menu Fabric Vision — Select to configure MAPS or Flow Vision. Flow Vision — Select to define or monitor network traffic by choosing one of the following options: • Monitor — Select to monitor network traffic and provide statistics for the defined flows. • Performance Graph — Select to monitor performance through a graph, which displays transmit and receive data. The graphs show historical data. • Add — Select to define a traffic flow.
SAN main menus Menu Command A Command Options Top Talkers — (Trial and Licensed version Only) Select to monitor performance through a real-time list of top conversations for a switch or port along with related information. Real-Time Graph — Select to monitor performance through a graph, which displays transmit and receive data. The graphs show real-time data. Historical Graph — (Trial and Licensed version Only) Select to monitor performance through a graph, which displays transmit and receive data.
A Menu SAN main menus Command Command Options FICON — Select to display the FICON events related to the selected device or fabric. Product Event — Select to display errors related to SNMP traps and Client-Server communications. Product Status — Select to display operational status changes of managed products. Security — Select to display security information. Syslog — Select to display Syslog events related to the selected device or fabric.
SAN main menus Menu Command A Command Options FC — Select how to troubleshoot FC by choosing one of the following options: • FC Trace Route — Select to view the route information between two device ports. • Device Connectivity — Select to view the connectivity information for two devices. • Fabric Device Sharing. (Trial and Licensed version Only) Select to determine if the selected fabrics are configured to share devices. • Diagnostic Port Test — Select to run a diagnostic port test.
A SAN shortcut menus SAN shortcut menus You can use the Management application interface main menu to configure, monitor, and troubleshoot your SAN components. The instructions for using these features are documented in the subsequent chapters of this manual. For each SAN component, you can optionally right-click the component and a shortcut menu displays. The table below details the command options available for each component.
SAN shortcut menus Component Menu/Submenu Commands A Comments Technical Support > SupportSave Product/Host SupportSave Upload Failure Data Capture View Repository FC Trace Route Create Meta SAN View Only available for Backbone fabrics. Automatically creates a view with the selected fabric. View name is same as the current label. Map Display Port Display > Occupied Product Ports UnOccupied Product Ports Attached Ports Switch to Switch Connections Only available from Product List.
A SAN shortcut menus Component Menu/Submenu Commands Comments Table > Copy 'Device_Name Group' Copy Row Copy Table Export Row Export Table Search Select All Size All Columns To Fit Expand All Collapse All Customize Only available from Product List.
SAN shortcut menus Component Menu/Submenu Commands A Comments Recommission > All Ports on the Switch All Ports on the Blade Swap Blades Virtual Fabric > Disable Logical Switches Locate Logical Switches > List_of_Logical_Switches (Fabric OS only) (Virtual Fabric-capable switches only) Zoning > Fabric Does not display when switch is in a Core Switch group, Chassis group or Isolated device group, or when it is in Access Gateway mode.
A SAN shortcut menus Component Menu/Submenu Commands Comments Setup Tools Trial and Licensed version Only Product Only enabled when the fabric is tracked, and the product is removed and joins another fabric. Other Ports > Does not display when an Access Gateway mode device is attached to multiple fabrics.
SAN shortcut menus Component Menu/Submenu Commands Comments Virtual Fabric > Enable Disable Logical Switches Locate Chassis Only available from Product List. A Events Technical Support > (Fabric OS only) Product/Host SupportSave Upload Failure Data Capture View Repository Port Display > Occupied Product Ports UnOccupied Product Ports Attached Ports Switch to Switch Connections Only available from Product List.
A SAN shortcut menus Component Menu/Submenu Commands Comments Enable / Disable > Enable Disable Persistent Enable Persistent Disable Firmware Management Swap Blades Only available from chassis.
SAN shortcut menus Component Menu/Submenu Commands A Comments Show Ports Accept Changes Show Connections Port Display > Occupied Product Ports UnOccupied Product Ports Attached Ports Switch to Switch Connections Only available from Product List. Properties Table > Copy 'Device_Name Group' Copy Row Copy Table Export Row Export Table Search Select All Size All Columns To Fit Expand All Collapse All Customize Only available from Product List.
A SAN shortcut menus Component Menu/Submenu Commands Comments Fabric > Fabric1 Fabric2 Only available for HBAs under the Host node. Origin Only available for HBAs under the Host node or devices routed in. Not available for enclosures. Destination Only available for devices routed out. Not available for enclosures. Port Display > Occupied Product Ports UnOccupied Product Ports Attached Ports Switch to Switch Connections Only available from Product List.
SAN shortcut menus Component Menu/Submenu Commands A Comments Router Phantom Domains Accept Change Trial and Licensed version Only Only available for tracked FC Fabrics. Only enabled when a plus or minus icon is present. Show Connections Displays as disabled because this component does not display in the Connectivity Map. Origin Port Display > Occupied Product Ports UnOccupied Product Ports Attached Ports Switch to Switch Connections Only available from Product List.
A SAN shortcut menus Component Menu/Submenu Commands Comments Port Display > Occupied Product Ports UnOccupied Product Ports Attached Ports Switch to Switch Connections Only available from Product List. Table > Copy 'Device_Name Group' Copy Row Copy Table Export Row Export Table Search Select All Size All Columns To Fit Expand All Collapse All Customize Only available from Product List. Collapse All Only available from Product List.
SAN shortcut menus Component Menu/Submenu Commands A Comments Properties HBA Port Host Port Mapping Does not display for routed devices. Performance > Real Time Graphs Only available for occupied, managed ports. Disabled when all ports are offline. FC Security Protocol Only available for Managed JSON HBA Ports. Only available when you have the Security Privilege.
A SAN shortcut menus Component Menu/Submenu Commands Comments Table > Copy 'Device_Name Group' Copy Row Copy Table Export Row Export Table Search Select All Size All Columns To Fit Expand All Collapse All Customize Only available from Product List. Properties Giga-Bit Ethernet Port Performance > Real-Time Graph Enable / Disable > Enable Disable Persistent Enable Persistent Disable Modify Launches Element Manager.
SAN shortcut menus Component Menu/Submenu Commands A Comments Properties Trunk Port Display > Occupied Product Ports UnOccupied Product Ports Attached Ports Switch to Switch Connections Only available from Product List. Table > Copy 'Device_Name Group' Copy Row Copy Table Export Row Export Table Search Select All Size All Columns To Fit Expand All Collapse All Customize Only available from Product List.
A SAN shortcut menus Component Menu/Submenu Commands Comments Table > Copy 'Device_Name Group' Copy Row Copy Table Export Row Export Table Search Select All Size All Columns To Fit Expand All Collapse All Customize Only available from Product List.
SAN shortcut menus Component A Menu/Submenu Commands Comments Table > Copy 'Component' Copy Table Export Table Search Select All Size All Columns To Fit Expand All Collapse All Customize Some form of this shortcut menu is available for all tables in the Management interface.
A 1438 SAN shortcut menus Brocade Network Advisor SAN User Manual 53-1003154-01
Appendix B Call Home Event Tables In this appendix This appendix provides information about the specific events that display when using Call Home. This information is shown in the following Event Tables. • # CONSRV Events . . . . . . . . . . . . . . . . . . . . . . . . . . . . . . . . . . . . . . . . . . . 1439 • # Thermal Events. . . . . . . . . . . . . . . . . . . . . . . . . . . . . . . . . . . . . . . . . . . . 1440 • Fabric OS Events . . . . . . . . . . . . . . . . . . . . . . . . . . . . . . . . .
B Call Home Event Tables TABLE 128 # Thermal Events Event reason code FRU code/Event type Description Severity 800 DVP/LIM/HW High temperature warning. 3 801 DVP/LIM/HW Critically hot temperature warning. 3 802 DVP/LIM/HW Port card shutdown due to thermal violations. 3 805 SWM/SBAR/HW High temperature warning. 3 806 SWM/SBAR/HW Critically hot temperature warning. 3 807 SWM/SBAR/HW SBAR module shutdown due to thermal violations. 3 810 CTP/HW High temperature warning.
B Call Home Event Tables TABLE 129 Fabric OS Events (Continued) Event reason code FRU code/Event type Description Severity 1426 FW-1426 Faulty or missing power supply. 3 1427 FW-1427 Faulty power supply. 3 1428 FW-1428 Missing power supply. 3 1429 FW-1429 Problem in power supply arrangement. 3 1430 FW-1430 Faulty temperature sensors. 3 1431 FW-1431 Faulty fans. 3 1432 FW-1432 Faulty WWN cards. 3 1433 FW-1433 Faulty CPs. 3 1434 FW-1434 Faulty blades.
B 1442 Call Home Event Tables Brocade Network Advisor SAN User Manual 53-1003154-01
Appendix C Event Categories In this appendix This section provides information about the events that display in each of the following categories: • Link incident events . . . . . . . . . . . . . . . . . . . . . . . . . . . . . . . . . . . . . . . . . • Product status events . . . . . . . . . . . . . . . . . . . . . . . . . . . . . . . . . . . . . . . . • Product audit events . . . . . . . . . . . . . . . . . . . . . . . . . . . . . . . . . . . . . . . . . • Security events . . . . . . . . . . . . . . .
C Product audit events If the event is a RASLOG and if the RASLOG ID matches any of the RASLOGS listed below, then the event is categorized as a product status event. • • • • • • • • • • • • • • • • • • • • • FW-1424 FW-1425 FW-1426 FW-1427 FW-1428 FW-1429 FW-1430 FW-1431 FW-1432 FW-1433 FW-1434 FW-1435 FW-1436 FW-1437 FW-1438 FW-1439 FW-1440 FW-1441 FW-1442 FW-1443 FW-1444 Product audit events Events that are used to track audit information are categorized as product audit events.
Security events C Security events Security events are those that indicate authentication success or failure, a security violation, or user login and logout. Security events for FC devices For FOS switches, if the event is a RASLOG event and the RASLOG ID contains 'SEC', then the event is categorized as a security event. Security events for IP devices For IOS devices, if the event OID starts with any of the following OIDs, then the event is categorized as a security event.
C User action events • • • • • • • • • • • • • • • • • 1.3.6.1.4.1.1991.1.6.1.7.4.2.13 [localMacAddrAuthFail] 1.3.6.1.4.1.1991.1.6.1.7.4.2.14 [pppLogonFail] 1.3.6.1.4.1.1991.1.6.1.7.4.2.18 [dot1xSupplicantAuthenticated] 1.3.6.1.4.1.1991.1.7.2.2.2.9 [apAuthFailureTooMany] 1.3.6.1.4.1.1991.1.8.2.1.4.0.2 [userLoginNotification] 1.3.6.1.4.1.1991.1.8.2.1.4.0.3 [userLogOffNotification] 1.3.6.1.4.1.1991.1.8.2.1.4.0.4 [userLoginFailNotification] 1.3.6.1.4.1.1991.1.11.1.1.2.2.2.32 [mwlAuthFailure] 1.3.6.1.4.1.
Product events C Product events All other events originating from the product are categorized as product events. IP Performance monitoring events IP performance monitoring events, listed in Table 130, occur when users select the option to forward events to the vCenter during VM Manager discovery. TABLE 130 Performance monitoring IP threshold events Trap name OID Description bnaRisingThresholdCrossed 1.3.6.1.4.1.1991.1.13.2.0.
C RASLog Events TABLE 131 1448 Configuration change events (Continued) Event ID Type Description CONF-1031 LOG configDefault completed successfully. CONF-1032 LOG configRemove completed successfully. CONF-1042 LOG | AUDIT Indicates that the fabric configuration parameter value has been changed. CONF-1043 LOG | AUDIT Indicates that the fabric configuration parameter value has been changed.
RASLog Events TABLE 131 C Configuration change events (Continued) Event ID Type Description FCR-1102 LOG ICL EX_Port need to be present in base switch to make a recommended topology. FICU-1008 LOG FMS mode enabled. FICU-1012 LOG FMS mode disabled. FV-3000 AUDIT Flow definition created. FV-3001 AUDIT Flow definition deleted. FV-3002 AUDIT Flow definition activated. FV-3003 AUDIT Flow definition de-activated. FV-3004 AUDIT Flow definition modified.
C RASLog Events TABLE 131 1450 Configuration change events (Continued) Event ID Type Description PMGR-1001 LOG | AUDIT Attempt to create switch ID succeded. PMGR-1003 LOG Attempt to delete switch ID succeded. PMGR-1005 LOG Attempt to move port on slot succeded. PMGR-1007 LOG Attempt to change switch succeded. PMGR-1009 LOG Attempt to change the base switch to software succeded. PMGR-1011 LOG Attempt to move port to switch succeeded. SEC-1319 LOG FCS Policy changed.
Appendix User Privileges D In this appendix • About user privileges . . . . . . . . . . . . . . . . . . . . . . . . . . . . . . . . . . . . . . . . . . 1451 • About Roles and Access Levels . . . . . . . . . . . . . . . . . . . . . . . . . . . . . . . . 1469 About user privileges The Management application provides the User Administrator with a high level of control over what functions individual users can see and use.
D About user privileges TABLE 132 Application privileges and behavior Privilege Description No Privilege Read-Only Read/Write Active Session Management Allows you view active client sessions and disconnect an unwanted user. Disables the Active Sessions command from the Server menu. Enables the Active Sessions command from the Server menu. Disables all commands and functions on the dialog box except the Close and Help. Enables the Active Sessions command from the Server menu.
About user privileges TABLE 132 D Application privileges and behavior (Continued) Privilege Description No Privilege Read-Only Read/Write Dashboard Management Allows you to access the Dashboard Management. • Allows you to perform the following operations on the dashboard: • Show or hide the default status and performance widgets to the dashboard. • Customize Network Scope and Time Scope. • Dashboard Playback operation. • Sharing the dashboard. • Dashboard creation and deletion.
D About user privileges TABLE 132 Application privileges and behavior (Continued) Privilege Description No Privilege Read-Only Read/Write E-mail Event Notification Setup Allows you to define the e-mail server used to send e-mail. Disables Event Notification E-mail command on the Monitor menu and the E-mail Event Notification Setup button in the Users dialog box. Disables the E-mail option in the Master Log shortcut menu.
About user privileges TABLE 132 D Application privileges and behavior (Continued) Privilege Description No Privilege Read-Only Read/Write Fault Management Allows you to control access to the SNMP Trap Registration and Forwarding dialog box, the Event Storage option of the Options dialog box, the Syslog Registration and Forwarding dialog box, as well as the Export and Clear functions in the Event Log dialog box and the Show and Hide functions in the Customize Columns dialog box.
D About user privileges TABLE 132 Application privileges and behavior (Continued) Privilege Description No Privilege Read-Only Read/Write Firmware Management Allows you to download firmware to selected switches and manage the firmware repository. Disables the Firmware Management command from the Configure menu and right-click menu. Enables the Firmware Management command from the Configure menu and right-click menu. Disables all commands and functions on the dialog box except the Close and Help.
About user privileges TABLE 132 D Application privileges and behavior (Continued) Privilege Description No Privilege Read-Only Read/Write Policy Monitor Allows you to configure policy monitors. Disables Policy Monitor command on the Monitor menu. Enables Policy Monitor command on the Monitor menu. Allows you to open the Policy Monitor dialog box; however, disables the Add, Delete, and Run buttons. No changes can be made. Enables you to use the Edit, Report, and History buttons to view content.
D About user privileges TABLE 132 Application privileges and behavior (Continued) Privilege Description No Privilege Read-Only Read/Write Security Allows you to enable and configure SANtegrity features. Disables the Security command from the Configure > Switch > Replicate menu. Disables the Security Log command on the Monitor > Logs menu. Disables the Security Misc command from the Server > Options menu. Disables the Security command from the Configure > Switch > Replicate menu.
About user privileges TABLE 132 D Application privileges and behavior (Continued) Privilege Description No Privilege Read-Only Read/Write Technical Support Data Collection Allows you to capture support data from Fabric OS switches. Disables the SupportSave, Upload Failure Data Capture, and View Repository commands from the Monitor > Technical Support menu and right-click menu. Enables the View Repository command from the Monitor > Technical Support menu and right-click menu.
D About user privileges TABLE 132 Application privileges and behavior (Continued) Privilege Description Web Services Allows you to use Web Services API. Zoning Activation (Fabric and offline zone database) Allows you to activate a zone configuration selected in the Zoning dialog box. NOTE You must also have the Zoning Offline and Zoning Online privileges to launch the Zoning dialog box.
About user privileges TABLE 132 D Application privileges and behavior (Continued) Privilege Description No Privilege Read-Only Read/Write Zoning Online Allows you to edit any of the fabric zone databases in the available fabrics within the Zoning dialog box from the client side and then save to the switch. In Zoning dialog box, the Zone DB list includes online and offline zones; however, if an online zone is selected, the contents are not loaded into the Zoning dialog box.
D About user privileges TABLE 132 Application privileges and behavior (Continued) Privilege Description No Privilege Read-Only Read/Write Zoning Offline Allows you to edit the zone database in offline mode and save the zone database to the repository or to the switch. In Zoning dialog box, the Zone DB list includes offline zones; however, if an offline zone is selected, the contents are not loaded into the Zoning dialog box.
About user privileges TABLE 132 D Application privileges and behavior (Continued) Privilege Description No Privilege Read-Only Read/Write Zoning - LSAN Allows you to edit and activate LSAN zones for the LSAN fabrics that are available within the Zoning dialog box. Prerequisite: Both the backbone fabrics as well as all directly connected edge fabrics must be added to a resource group and a user with LSAN Zoning privilege must be assigned to this specific resource group.
D About user privileges TABLE 133 SAN privileges and application behavior Privilege Description No Privilege Read-Only Read/Write SAN - Discovery Setup Allows you to configure discovery setup. Disables Setup on the Discover menu and toolbar. Enables Setup on the Discover menu and toolbar. Allows you to open the Discover Setup dialog box; however, disables all functions. Enables Setup on the Discover menu and toolbar. Enables all functions in the Discover Setup dialog box.
About user privileges TABLE 133 D SAN privileges and application behavior (Continued) Privilege Description No Privilege Read-Only Read/Write SAN - High Integrity Fabric Allows you to set Fabric Binding and Insistent Domain IDs. Disables the High Integrity Fabric command from the Configure menu. Enables the High Integrity Fabric command from the Configure menu. Disables all commands and functions on the dialog box except the Cancel and Help.
D About user privileges TABLE 133 SAN privileges and application behavior (Continued) Privilege Description No Privilege Read-Only Read/Write SAN - Properties Add/Delete Columns Allows you to define new properties as well as remove them. Disables the Add, Edit and Delete buttons on the Create View dialog box Columns tab. Disables the Add Column, Edit Column, and Delete Column commands on the right-click menu of the Product List column headers.
About user privileges TABLE 133 D SAN privileges and application behavior (Continued) Privilege Description No Privilege Read-Only Read/Write SAN - Storage Encryption Configuration Allows you to configure storage encryption configuration, including selecting storage devices and LUNs, viewing and editing switch, group, or engine properties, viewing and editing storage device encryption properties, and initiating manual LUN re-keying. Disables the Encryption command from the Configure menu.
D About user privileges TABLE 133 SAN privileges and application behavior (Continued) Privilege Description No Privilege Read-Only Read/Write SAN - Storage Encryption Security Allows you to configure storage encryption security, including creating a new encryption group, adding a switch to an existing group, zeroizing an encryption engine, backing up or restoring a master key, and enabling encryption functions after a power cycle. Disables all functions from the dialog box except view.
About Roles and Access Levels TABLE 133 D SAN privileges and application behavior (Continued) Privilege Description No Privilege Read-Only Read/Write SAN - View Management Allows you to create, edit, and delete views. Selecting from views should always be allowed unless restricted by the assignment of Views in the Group definition in the Users dialog box.
D About Roles and Access Levels TABLE 134 Application Features and Role Access Levels (Continued) Feature Roles with Read/Write Access Roles with Read-Only Access Event Management SAN System Administrator, Network Administrator Operator Fabric Watch SAN System Administrator, Fault Management SAN System AdministratorNetwork Administrator Operator FCoE Management SAN System Administrator, Network Administrator Security Administrator, Zone Administrator, Security Officer, Operator Firmware Ma
About Roles and Access Levels TABLE 135 D SAN Features and Role Access Levels Feature Roles with Read/Write Access Roles with Read-Only Access SAN- Discovery Setup SAN System Administrator, Host Administrator Operator SAN - Element Manager SAN System Administrator, SAN - Element Manager - Product Operation SAN System Administrator, Operator SAN- Fabric Binding SAN System Administrator, Security Administrator, Security Officer Operator SAN- Fabric Tracking SAN System Administrator Operator
D 1472 About Roles and Access Levels Brocade Network Advisor SAN User Manual 53-1003154-01
Appendix E Device Properties In this appendix • Viewing SAN device properties . . . . . . . . . . . . . . . . . . . . . . . . . . . . . . . . . . • Viewing VC module properties . . . . . . . . . . . . . . . . . . . . . . . . . . . . . . . . . . • Host properties . . . . . . . . . . . . . . . . . . . . . . . . . . . . . . . . . . . . . . . . . . . . . • Properties customization . . . . . . . . . . . . . . . . . . . . . . . . . . . . . . . . . . . . .
E Viewing SAN device properties Viewing SAN device properties You can customize the device and fabric Properties dialog boxes to display only the data you need by creating user-defined property labels. You can also edit property fields to change information. Viewing Fabric properties To view the properties for a fabric, complete the following step. 1. Right-click any fabric and select Properties. The Fabric_Name Properties dialog box displays, with information related to the selected fabric.
Viewing SAN device properties E Viewing SAN device properties To view the properties for a device, complete the following steps. 1. Right-click any product icon and select Properties. The Properties dialog box displays, with information related to the selected device (such as switches, directors, HBAs, trunks, tunnels, and nodes). To add user-defined property labels, refer to “Adding a property field” on page 1492. Fields containing a green triangle ( ) in the lower-right corner are editable.
E Viewing SAN device properties TABLE 137 Device properties (Continued) Field/Component Description GigE Port The GigE port of the FCIP tunnel. Host Name The Host name. IKE Policy # IP Address IPSec Policy # 1476 The IKE policy number. Also includes the following information: Authentication Algorithm Encryption Algorithm Diffie-Hellman SA Life • • • • The device’s IP address. The IPSec policy number.
Viewing SAN device properties TABLE 137 E Device properties (Continued) Field/Component Description Sequence number The sequence number of the switch. Serial # The hardware serial number. Slot # The slot number of the trunk. Source IP Address The IP address of the of the FCIP tunnel source device. Speed (Gb/s) The speed of the port in gigabits per second. State The device’s state, for example, online or offline. Status The operational status. Switch Name The switch name.
E Viewing SAN device properties • Virtual FCoE Ports • Virtual Machine Ports 3. If you selected the FC Ports tab, select the port type: • FC • ICL • GigE For a description of the port properties, refer to “Port properties” on page 1483. 4. Click OK on the Properties dialog box to close the dialog box. Viewing storage properties The Storage Properties dialog box displays information related to a selected storage device. To view the properties for a storage device, complete the following steps. 1.
Viewing SAN device properties TABLE 138 E Storage Properties (Continued) Field Description Free LUNs (Count) All LUNs not assigned (masked) to any host ports (available) that currently exist on this storage device. Free LUNs (Size GB) The total amount of storage space carved into LUNs but not assigned (masked) to host ports on the storage device, in gigabytes. Free Space (Count) The number of contiguous free space instances not yet carved into LUNs (available to be carved) on the storage device.
E Viewing SAN device properties TABLE 138 Storage Properties (Continued) Field Description Type The level or type of RAID storage. Possible values are as follows: 0 — Striped disk array without fault tolerance. 1 — Mirroring and duplexing. 2 — Hamming code ECC. 3 — Parallel transfer with parity. 4 — Independent data disks with shared parity disk. 5 — Independent data disks with distributed parity blocks. 6 — Independent data disks with two independent distributed parity schemes.
Viewing SAN device properties TABLE 139 E iSCSI Properties Field Description Agent The Caffeine agent version number. Applications The applications. Assigned LUNs The number of unique LUNs (not LUN paths) masked to this host. Assigned LUNs Size (GB) The total size of the unique LUNs (not LUN paths) in gigabytes. Command Descriptor Block Count The number of command descriptor blocks on the product. Comments Comments regarding the product. Contact A contact for the product.
E Viewing SAN device properties TABLE 139 iSCSI Properties (Continued) Field Description Sessions button Select to display the Filer Sessions dialog box for the product. Statistics button Select to display the Filer iSCSI Statistics dialog box for the product. Storage Arrays The number of arrays containing LUNs masked to the server. Storage Logins The number of unique filers to which hosts on this server are logged in. Target Portals table Target portals of the product.
Viewing SAN device properties E FIGURE 589 Port Properties dialog box NOTE Depending on the port type, some of the following properties may not be available for all products. TABLE 140 Port properties Field Description Additional Port Info Additional error information relating to the selected port. Address The address of the port. Addressing Mode The addressing mode of the switch. Active FC4 Types The active FC4 types. Active Tunnels The number of active tunnels.
E Viewing SAN device properties TABLE 140 Port properties (Continued) Field Description Compression Whether compression is enabled or disabled. Connected Devices The number of connected devices. Click the icon in the right side of the field to open the Virtual FCoE Port Connected Devices dialog box. Connected Switch The name of the connected switch. Delete button Click to delete the ports. Description A description of the customer site.
Viewing SAN device properties TABLE 140 E Port properties (Continued) Field Description IP Address The device’s IP address. IPSec Policy # The IPSec policy number. Also includes the following information: Authentication Algorithm Encryption Algorithm SA Life • • • iSCSI button Click to launch the Element Manager. iSCSI Capable Whether the port is iSCSI capable or not. L2 Capable Whether the device is Layer 2 capable. L3 Capable Whether the device is Layer 3 capable.
E Viewing SAN device properties TABLE 140 1486 Port properties (Continued) Field Description Port Speed (Gb/s) The port speed, in gigabits per second. Port State The port state (online or offline). Port Status The port’s operational status (online or offline). Port Type The port type. Port WWN The port’s world wide name. Preshared key configured Whether the preshared key is configured for the FCIP tunnel. Prohibited Whether the port is prohibited.
Viewing VC module properties TABLE 140 E Port properties (Continued) Field Description Unit Type The unit type of the node. User Port # The number of the user port. Vendor The product vendor. # Virtual FCoE port count The number of virtual FCoE ports on the device. There is a one-to-one mapping of TE ports to virtual FCoE ports. Therefore, the number of virtual session ports is one for directly connected devices.
E Viewing VC module properties TABLE 141 Properties tab Field Description Serial # The hardware serial number. VC Firmware The downloaded firmware version of the VC Ethernet management module and all VC FC modules managed by the VC Domain. VC Domain Name The domain name. VC Domain Group The domain group. IO Bay Discovery Status The discovery status of the VCEM server of this module. Last Discovery The last time data collection was performed for this VC module on the VCEM server.
Host properties E Host properties You can view device and port properties from the Product List or the map. You can customize the Host Properties dialog boxes by creating user-defined property labels (refer to “Adding a property field” on page 1492). NOTE You cannot create user-defined property labels at the adapter level. You can also edit property fields to change information. Fields containing a green triangle ( the lower right corner are editable.
E Host properties TABLE 31 Adapter port properties (Continued) Field Description Class of Service The class of the port; for example, Class-2 or Class-3. Switch The name of the switch. Fabric The name of the Fabric. VM Port Name The port name of the virtual machine associated with the host. Preboot Created Indicates whether preboot was created on the virtual port. PCI Function Index The PCI function number associated with the physical port.
Host properties TABLE 31 E Adapter port properties (Continued) Field Description Operating State Displays details about the state of the following operating parameters: • Beacon State • Link Beacon State • MPIO Mode State • Path Time Out • Logging Level • Target Rate Limit • Default Rate Limit FC-SP Authentication Indicates whether FC-SP authentication is enabled or disabled. FCSP Status Whether FC-SP authentication is being used. Algorithm The configured authentication algorithm.
E Properties customization TABLE 31 Adapter port properties (Continued) Field Description Edit button Click to edit a user-defined property. For more information, refer to “Adding a property field”. Delete button Click to delete a user-defined property. For more information, refer to “Adding a property field”. 3. Click OK to close. Properties customization NOTE Properties customization requires read and write permissions to the Properties - Add / Delete Columns privilege.
Properties customization E The new property displays in the properties list as well as the Product List. To edit the user-defined property field, click in the field and make your changes. Editing a property field NOTE Properties customization requires read and write permissions to the Properties - Add / Delete Columns privilege. You can edit any property that you create on the Properties dialog box. Fields containing a green triangle ( ) in the lower right corner are editable.
E Properties customization Editing a property field directly You can edit fields containing a green triangle ( the following steps. ) in the lower right corner. To edit a field, complete 1. Right-click any product icon and select Properties. The Properties dialog box displays. 2. Select the tab on which you want to edit a field. Fields containing a green triangle ( ) in the lower right corner are editable. 3. Click in an editable field and change the information. 4. Click OK.
Appendix F Regular Expressions In this appendix This appendix presents a summary of Unicode regular expression constructs that you can use in the Management application. • Characters . . . . . . . . . . . . . . . . . . . . . . . . . . . . . . . . . . . . . . . . . . . . . . . . . • Character classes . . . . . . . . . . . . . . . . . . . . . . . . . . . . . . . . . . . . . . . . . . . • Predefined character classes . . . . . . . . . . . . . . . . . . . . . . . . . . . . . . . . . .
F Regular Expressions TABLE 1 Matches \e The escape character ('\u001B') \cx The control character corresponding to x TABLE 2 Character classes Construct Matches [abc] a, b, or c (simple class) [^abc] Any character except a, b, or c (negation) [a-zA-Z] a through z or A through Z, inclusive (range) [a-d[m-p]] a through d, or m through p: [a-dm-p] (union) [a-z&&[def]] d, e, or f (intersection) [a-z&&[^bc]] a through z, except for b and c: [ad-z] (subtraction) [a-z&&[^m-p]] a through z
Regular Expressions TABLE 4 POSIX character classes (US-ASCII only) Construct Matches \p{Blank} A space or a tab: [ \t] \p{Cntrl} A control character: [\x00-\x1F\x7F] \p{XDigit} A hexadecimal digit: [0-9a-fA-F] \p{Space} A whitespace character: [ \t\n\x0B\f\r] TABLE 5 java.lang.Character classes (simple java character type) Construct Matches \p{javaLowerCase} Equivalent to java.lang.Character.isLowerCase() \p{javaUpperCase} Equivalent to java.lang.Character.
F Regular Expressions TABLE 8 Construct Matches X? X, once or not at all X* X, zero or more times X+ X, one or more times X{n} X, exactly n times X{n,} X, at least n times X{n,m} X, at least n but not more than m times TABLE 9 Reluctant quantifiers Construct Matches X?? X, once or not at all X*? X, zero or more times X+? X, one or more times X{n}? X, exactly n times X{n,}? X, at least n times X{n,m}? X, at least n but not more than m times TABLE 10 Possessive quantifiers Co
Regular Expressions TABLE 12 F Back references Construct Matches \n Whatever the nth capturing group matched Quotation \ Nothing, but quotes the following character \Q Nothing, but quotes all characters until \E \E Nothing, but ends quoting started by \Q TABLE 13 Special constructs (non-capturing) Construct Matches (?:X) X, as a non-capturing group (?idmsux-idmsux) Nothing, but turns match flags on–off (?idmsux-idmsux:X) X, as a non-capturing group with the given flags on–off (?=X)
F 1500 Regular Expressions Brocade Network Advisor SAN User Manual 53-1003154-01
Appendix G Troubleshooting In this appendix • Application Configuration Wizard troubleshooting . . . . . . . . . . . . . . . . . • Browser troubleshooting . . . . . . . . . . . . . . . . . . . . . . . . . . . . . . . . . . . . . . • Client browser troubleshooting. . . . . . . . . . . . . . . . . . . . . . . . . . . . . . . . . • Fabric tracking troubleshooting . . . . . . . . . . . . . . . . . . . . . . . . . . . . . . . . • FICON troubleshooting . . . . . . . . . . . . . . . . . . . . . . . . . . . . .
G Application Configuration Wizard troubleshooting Application Configuration Wizard troubleshooting The following section states a possible issue and the recommended solution for Management application Configuration Wizard errors. Problem Resolution Unable to launch the Management application Configuration Wizard on a Windows Vista, Windows 7,or Windows 2008 R2 system The Windows Vista, Windows 7,or Windows 2008 R2 system enables the User Access Control (UAC) option by default.
Client browser troubleshooting G Client browser troubleshooting The following section states a possible issue and the recommended solution for client browser errors. Problem Resolution Downloading Client from a Internet Explorer Browser over HTTPS • Brocade Network Advisor SAN User Manual 53-1003154-01 If the JNLP file does not launch automatically, use one of the following options: Complete the following steps. 1 Save the JNLP file to the local host. 2 Launch the JNLP file manually.
G Discovery troubleshooting Discovery troubleshooting The following section states a possible issue and the recommended solution for discovery errors. Problem Resolution After upgrading to Management application 12.x from 11.x, unable to discover Fabric OS devices. Error "4002" displays when trying to discover Fabric OS devices. The Management application 12.x uses Java 1.7, which disables the use of certificates with "weak authentication". You must update your Java certificates to resolve the issue.
Firmware download troubleshooting G Firmware download troubleshooting The following section states a possible issue and the recommended solution for firmware download errors. Problem Resolution If you configured an internal FTP server and the Management application server is running IPv6, firmware download is not supported. Choose from one of the following options: • If the Management application is running IPv6 only, configure an external FTP server.
G Launch Client troubleshooting Launch Client troubleshooting The following section states a possible issue and the recommended solution if you are unable to launch the remote client. Problem Resolution Remote client does not upgrade from versions prior to 11.0. The remote client does not automatically upgrade when you select the remote client shortcut of client versions earlier than 11.0. To clear the old client and launch the new remote client version, complete the following steps.
Launch Client troubleshooting G Problem Resolution Unable to log into the Client (the application does not launch when you use a valid user name and password and exceptions are thrown in the client side). Use one the following procedures to configure the IP address in the host file. Windows operating systems 1 Log in using the 'Administrator' privilege. 2 Select Start > Run. 3 Type drivers in the Open field and press Enter. 4 Go to the ‘etc’ folder and open the ‘hosts’ file using a text editor.
G Names troubleshooting Names troubleshooting The following section states a possible issue and the recommended solution for names errors. Problem Resolution Duplicate name error. If you configured the Management application to only allow unique names and you try to use a name that already exists in the fabric.
Performance troubleshooting G Performance troubleshooting The following section states a possible issue and the recommended solution for Performance errors. Problem Resolution An error message with the following text displays: Real Time statistics collection has failed. Please see master log for details. Make sure that the following prerequisites for Performance Monitoring Data collection are met.
G Performance troubleshooting Problem Resolution An error message with the following text displays: Real Time statistics collection has failed. Please see master log for details. 2 1510 To collect data, the SNMP credentials in the Management application and switch must match. SNMP v1 or v3: The community strings entered in the Address Properties dialog box SNMP tab must match the one entered in the switch.
Performance troubleshooting Problem Resolution An error message with the following text displays: Real Time statistics collection has failed. Please see master log for details. 3 G To collect GigE port and FCIP statistics, you must enable the FCIP-MIB capability.
G Performance troubleshooting Problem Resolution An error message with the following text displays: Real Time statistics collection has failed. Please see master log for details. 5 To collect data on Virtual Fabric-enabled switches, the Fabric OS user must have access to all Virtual Fabrics. The SNMPv3 user name must be the same as the Fabric OS user name. If the SNMPv3 and Fabric OS user names do not match, data is not collected for the virtual switches with the non-default VF ID.
Port Fencing troubleshooting G Port Fencing troubleshooting The following section states a possible issue and the recommended solution for Port Fencing errors. Problem Resolution If you segment a switch from a fabric then rediscover the switch without accepting changes, the Port Fencing dialog box displays the switch twice and the port count is doubled. Right-click on the fabric that the segmented switch (with red minus icon) is part of and select Accept Changes.
G Server Management Console troubleshooting Server Management Console troubleshooting The following section states a possible issue and the recommended solution for server management console errors. Problem Resolution Unable to launch the SMC on a Windows Vista,Windows 7 , or Windows 2008 R2 system The Windows Vista,Windows 7,or Windows 2008 R2 system enables the User Access Control (UAC) option by default. When the UAC option is enabled, the SMC cannot launch.
Supportsave troubleshooting G Problem Resolution Unable to launch the SMC on a Windows Vista or Windows 7 system continued Disable using the Group Policy by completing the following steps. You can perform this procedure on you local machine using Local Group Policy editor or for many computers at the same time using the Active Directory-based Group Policy Object (GPO) editor. To disable using the Local Group Policy editor, complete the following steps.
G Technical support data collection troubleshooting Technical support data collection troubleshooting The following section states a possible issue and the recommended solution for technical support data collection errors.
Wireless troubleshooting G Wireless troubleshooting After discovery, the Management application inspects the trap listener and syslog recipient configuration on wireless controllers. If there is a problem with the registration, the Management application changes the “registration success” master log event to a warning event with additional message text.
G Zoning troubleshooting Problem Resolution Zoning activation message displays for a long time, but zone configuration is not activated. Telnet zoning can take a long time. To improve speed, open the Discover Setup dialog box (Discover > Setup) and add the IP address for the device to the Selected Individual Addresses list. Out of memory error caused by running a zoning report for a large zone configuration (1 MB) in a medium-sized SAN due to a third party tool.
Appendix H Database Fields In this appendix • Database tables and fields. . . . . . . . . . . . . . . . . . . . . . . . . . . . . . . . . . . . . 1519 • Views . . . . . . . . . . . . . . . . . . . . . . . . . . . . . . . . . . . . . . . . . . . . . . . . . . . . . . 1757 Database tables and fields NOTE The primary keys are marked by an asterisk (*) TABLE 16 ACH_CALL_CENTER Field Definition Format ID * Unique generated database identifier. int NAME Name of the Call Center.
H Database tables and fields TABLE 18 Definition Format Size TYPE Type of the event. varchar 256 CONTRIBUTOR_PATTERN Indicates the Contributor pattern to be used for searching the event contributor in event description. In some cases, FOS uses same message id for different events (e.g MAPS events). To increase the filtering capability of Call Home events, this contributor pattern string is used along with message id.
H Database tables and fields TABLE 23 ADAPTER_DRIVER_FILE_DETAILS Field Definition Format ID Unique generated database identifier.
H Database tables and fields TABLE 27 AOR_DEVICE_MAP Field Definition Format AOR_ID ID of AOR int DEVICE_ID The DEVICE ID can be IP Product or ServerIron ID which is in the AOR int TABLE 28 AOR_FABRIC_MAP Field Definition Format AOR_ID ID of AOR int FABRIC_ID FABRIC ID which is in the AOR int TABLE 29 Definition Format AOR_ID ID of AOR int HOST_ID HOST ID which is in the AOR int Definition Format AOR_ID ID of AOR int PORT_GROUP_ID IP of port group int Definition For
H Database tables and fields TABLE 33 AVAILABLE_FLYOVER_PROPERTY Field Definition Format ID* Unique generated database identifier. int NAME Name of the available property to be included in the flyover display. varchar TYPE Indicates the flyover property type. Product property is 0, Connection property is 1, User Defined property is 2, Cee Product property is 3, Cee Connection property is 4, Host property is 5.
H Database tables and fields TABLE 35 BIRTREPORT_RUN_TEMPLATE (Continued) Field Definition Format Size REPORT_TEMPLATE_TITLE Report Template title. This name is the same as the title name in the REPORT_TEMPLATE table. There is no foreign key relation here as the user may delete and add a template but the schedule should still hold good if looked up by title. Also title is unique in the REPORT_TEMPLATE table. varchar 256 NAME Name of the generated report file.
H Database tables and fields TABLE 37 BIRTREPORT_SCHEDULE_PARAMETER Field Definition Format ID The primary key of the table. int BIRTREPORT_SCHEDULE_T EMPLATE_ID Id of birtreport_schedule_template table. int BIRTTEMPLATE_PARAMETE R_ID Id of birttemplate_parameter table. int PARAM_VALUE Value of the parameter. varchar 256 PARAM_DISPLAY_VALUE Displays value of the parameter.
H Database tables and fields TABLE 41 BOOT_IMAGE_FILE_DETAILS_ Field Format ID int DRIVER_MAPPING_ID int BOOT_IMAGE_NAME Name of Boot Image file varchar MAJOR_VERSION Major Version bit from Boot Image file smallint MINOR_VERSION Minor Version bit from Boot Image file smallint MAINTENANCE Maintenance Version bit from Boot Image file smallint PATCH Patch Version bit from Boot Image file varchar IMPORTED_DATE Imported date of Boot Image file timestamp RELEASE_DATE Release date of B
H Database tables and fields TABLE 45 CARD (Continued) Field Definition Format SLOT_NUMBER The number of the physical slot in the chassis where the blade is plugged in. For fixed blades, SlotNumber is zero. smallint TYPE ID of the blade to identify the type. smallint EQUIPMENT_TYPE The type of the blade. It is either SW BLADE or CP BLADE. varchar 32 STATE State of the blade, such as ENABLED or DISABLED. varchar 32 POWER_STATE State of power supply to the blade.
H Database tables and fields TABLE 45 CARD (Continued) Field Definition Format Size CP_HA_STATE CP’s HA state information like Active/Stand by. varchar 128 ETHERNET_IPV6_ADDRESS IPV6 address of Ethernet management port for the blade. varchar 64 ETHERNET_IPV6_GATEWAY IPV6 Gateway address of Ethernet management port for the blade. varchar 64 NUMBER_OF_PORTS HEADER_VERSION The OEM or vendor-assigned version number. int GIGE_MODE Determines the port operating mode for GE ports.
H Database tables and fields TABLE 50 CEE_PORT Field Definition Format ID Unique generated database identifier.
H Database tables and fields TABLE 51 CFG_BACKUP_ARCHIVE (Continued) Field Definition Format Size DATE_TIME The date and time at which the configuration has been backedup. The date and time will be saved in the following format "Mon May 10 17:59:13 PDT 2010". varchar 64 varchar 64 FILE_NAME IS_BASELINE Indicates if the configuration file is selected by user as baselined configuration or not. num (1,0) DESCRIPTION Brief comments and description about this configuration.
H Database tables and fields TABLE 53 CLI_TEMPLATE (Continued) Field Definition Format Size DEVICE_PASSWORD varchar 256 DATE_TIME varchar 64 DEVICE_ENABLE_USERNA ME varchar 256 DEVICE_ENABLE_PASSWOR D varchar 256 CLI_FILTER varchar HAS_PARAMETERS num (1,0) PROMPT_ADDITIONAL_TAR GET The flag to indicate whether or not to prompt for additional targets during deployment. 1 = Prompt for additional targets. 0 =Do not prompt for additional target.
H Database tables and fields TABLE 55 Field Definition Format ID * Unique generated database identifier. int NAME Name of the column. It is used as column header in product list and property name in property sheet(SAN and IP) varchar 255 ENTITY_CATEGORY Holds the type of the entity to whom the column name belongs to like Port, Fabric, IPProduct, VCSInterface, etc' varchar 128 COLUMN_INDEX Used to differentiate user defined columns and static columns.
H Database tables and fields TABLE 60 CNA_ETH_PORT Field Definition Format ID ID of the Eth port int ETH_DEV Ethernet device varchar ETH_LOG_LEVEL Log level for the Ethernet device. Possible values are 0 - Log Invalid 1 - Log Critical 2 - Log Error 3 - Log Warning 4 - Log Info int NAME Name of the port varchar 256 MAC_ADDRESS MAC Address varchar 64 IOC_ID IO controller ID. The default value is 0.
H Database tables and fields TABLE 62 Definition Format Size MAX_BANDWIDTH Maximum guaranteed bandwidth. Value will be in Gbps (1 to 10). varchar 64 MIN_BANDWIDTH Minimum guaranteed bandwidth. Value will be in Gbps (0 to 10). int PORT_NUMBER Physical port number of adapter. int PORT_TYPE Type of this port. For example, ETH. varchar CREATION_TIME Creation time of this DB record. timestamp CONFIGURATION_STATUS Indicates current configuration status of the port.
H Database tables and fields TABLE 65 COLLECTOR_MIB_OBJECT_ENTRY Field Definition Format COLLECTOR_MIB_OBJECT_ ENTRY_ID Primary key autogenerated ID. int COLLECTOR_ID ID of the PERF_COLLECTOR. int MIB_OBJECT_ID MIB_OBJECT table DB ID. int TABLE 66 COLLECTOR_SNMP_EXPRESSION_ENTRY Field Definition Format COLLECTOR_SNMP_EXPRE SSION_ENTRY_ID Primary key autogenerated ID. int COLLECTOR_ID ID of the PERF_COLLECTOR. int EXPRESSION_ID Id of the SNMP_EXPRESSION.
H Database tables and fields TABLE 69 Field Definition Format ID Condition ID. int NAME Name of the condition. varchar 255 DESCRIPTION Description of the condition. varchar 1024 REMEDIATION Remediation details for failed conditions. text USE_REGEX Indicates whether the condition lines are built with regular expression or not. 0 = Does not contain Regular expression 1 = Contains regular expression smallint MATCH The device config should Match or Not match with condition.
H Database tables and fields TABLE 70 CORE_SWITCH (Continued) Field Definition Format UNREACHABLE_TIME Time when the switch becomes unreachable. timestamp OPERATIONAL_STATUS Chassis operational status like FRU, Power Supply etc.. varchar CREATION_TIME Core switch record creation time. This tells us when the intial discovery has happened. timestamp LAST_SCAN_TIME Last scan time tells the time when the last time the switch was polled.
H Database tables and fields TABLE 70 Definition Format Size NAT_PRIVATE_IP_ADDRESS NAT private IP Address. Feature available from NMS DC Eureka release onwards. During a successful NAT translation the Private IP that gets translated will be stored in this field. The new translated IP Address will be stored in the existing IP_ADDRESS field. All the NAT look up will be done using the NAT Private IP Address. varchar 128 ALTERNATE_IP_ADDRESS Alternate IP address of the switch.
H Database tables and fields TABLE 74 CORE_SWITCH_DETAILS (Continued) Field Definition Format Size FC_MASK FC IP Address ethernet mask. char 64 FC_IP Fibre Channel IP address. char 64 FC_CERTIFICATE FC IP Address. smallint SW_LICENSE_ID License ID of the chassis. char 23 SUPPLIER_SERIAL_ NUMBER Supplier serial number for the switch. varchar 32 PART_NUMBER Partnumber of the switch varchar 32 CHECK_BEACON Denotes if Switch Beacon is enabled or not on the switch.
H Database tables and fields TABLE 74 Definition Format Size VENDOR_VERSION Required by integrated SMI agent to populate Brocade_Product.Version property. varchar 32 VENDOR_PART_NUMBER Required by integrated SMI agent to populate Brocade_Product.SKUNumber property. varchar 32 SNMP_INFORMS_ENABLED Flag to denote whether SNMP informs option in the switch is enabled or disabled. Default value is 0. smallint RNID_SEQUENCE_NUMBER RNID sequence number for the switch.
H Database tables and fields TABLE 76 CRYPTO_LUN Field Definition Format ID Unique generated database identifier. int CRYPTO_TARGET_CONTAI NER_ID Foreign key reference to the CRYPTO_TARGET_CONTAINER that contains the host for which these LUNs are configured. int SERIAL_NUMBER The LUN serial number, used to identify the physical LUN. varchar ENCRYPTION_STATE Boolean. • True (1) if LUN is being encrypted. • False (0) if cleartext. The default value is 0.
H Database tables and fields TABLE 76 1542 CRYPTO_LUN (Continued) Field Definition Format DECRYPT_EXISTING_DATA Not used. When configuring disk LUN that was previously encrypted and is to become cleartext, this property tells the switch whether or not to start a re-keying operation to decrypt the existing LUN data. This property does not need to be persisted. This feature is no longer supported in FOS.
H Database tables and fields TABLE 76 CRYPTO_LUN (Continued) Field Definition Format Size NEW_LUN_TYPE This field indicates the role of the LUN configured in the SRDF mode. The values could be R1, R2 or UNKNOWN. Feature available only from 6.4 release onwards and for RSA key vaults. CryptoLuncollector fills in this value. varchar 64 DISABLE_WRITE_EARLY_A CK This variable indicates whether write early acknowledgement is enabled (if value is 0) or disabled (if value is 1).
H Database tables and fields TABLE 77 Definition Format PRIMARY_VAULT_LINK_ STATUS The status of the link key for the primary key vault. Link keys are used only for NetApp LKM key vaults. For possible values, see the enum definition in the DTO class. Default value is 0. smallint BACKUP_VAULT_LINK_ STATUS The status of the link key for the backup key vault. Link keys are used only for NetApp LKM key vaults. For possible values, see the enum definition in the DTO class. Default value is 0.
H Database tables and fields TABLE 78 CRYPTO_TARGET_CONTAINER (Continued) Field Definition Format FAILOVER_STATUS Indicates whether this container''s target is being encrypted by the encryption engine on which the container is configured (value 0) or by another encryption engine in the HA Cluster (value 1). Default value is 0.. smallint FAILOVER_STATUS_2 Failover status from the HA Cluster peer.
H Database tables and fields TABLE 80 Definition Format LAST_OPENED_TIME Time when dashboard was last opened. timestamp SHARED Indicates whether the dashboard is shared. 0 Not Shared 1 - Shared. int TABLE 81 Size DASHBOARD_CANVAS Field Definition Format ID Dashboard Canvas ID. int NAME Name of the Dashboard canvas. varchar 128 DESCRIPTION Description of the dashboard canvas.
Database tables and fields TABLE 83 DASHBOARD_PROVIDER Field Definition PROVIDER_GROUP The Group to which the Provider belong to. varchar Similar providers will have same group name. PROVIDER_ORDER The order of execution passed to the Job Executor framework. Provider belong to same group will have different order number. Default: 0 TABLE 84 H Format Size 128 int DASHBOARD_WIDGET Field Definition Format ID ID of the dashboard widget. Auto incremented.
H Database tables and fields TABLE 84 Definition Format installation_type Indicates the widgets is SAN Only (0) / IP Only (1) / SAN_IP (2)' int shared_provider Can the provider be shared? 0 - Not Shared 1 - Shared. int TABLE 85 Size DASHBOARD_WIDGET_PREFERENCE Field Definition Format ID Auto incremented widget preference ID. int WIDGET_ID Foreign Key to DASHBOARD_WIDGET(ID). int USER_ID Foreign Key to USER_ (ID). int DASHBOARD_ID Foreign Key to DASHBOARD(ID).
H Database tables and fields TABLE 86 DEFAULT_FAVORITES (Continued) Field Definition Format Size MAIN_MEASURE The Additional measures based on the FAVORITE.MAIN_MEASURE varchar 40 ADDITIONAL_MEASURE The Additional measures based on the FAVORITE.MAIN_MEASURE int TABLE 87 DEFAULT_WIDGET_PREFERENCE Field Definition Format ID Auto incremented Dashboard Widget Preference ID. int dashboard_id Foreign Key to DASHBOARD(ID). int widget_id Foreign Key to DASHBOARD_WIDGET(ID).
H Database tables and fields TABLE 88 DEPLOYMENT_CONFIGURATION (Continued) Field Definition Format SNAPSHOT_ENABLED 1 indicates that snapshot is applied to the configuration smallint CLI_TEMPLATE_ID Identifies the CLI template details.
Database tables and fields TABLE 90 DEPLOYMENT_PRODUCT_STATUS (Continued) Field Definition Format PRODUCT_ID This record will be per product. Hence this will have the id of the product. int PRODUCT_TYPE_ID Foreign Key references TARGET_TYPE(id). This identifies the PRODUCT_ID. (Whether it is switch, device, etc). int STATUS Indicated the product deployment status 1-Aborted 2-Succesful 3-Partial Failure 4-Failed smallint MESSAGE Message to be displayed in the report.
H Database tables and fields TABLE 93 Field Definition Format ID Unique generated database identifier. serial DEPLOYMENT_CONFIGU RATION_ID Foreign Key References DEPLOYMENT_CONFIGURATION (id) Identifies the deployment configuration this row is applied int TARGET_ID Identifies the target.
H Database tables and fields TABLE 94 DEVICE (Continued) Field Definition Format Size TAC_USER_NAME User name for TACACS access. varchar 512 TAC_PASSWORD Password for TACACS access. varchar 512 TACPLUS_USER_NAME User name for TACACS+ access. varchar 512 TACPLUS_PASSWORD Password for TACACS+ access. varchar 512 IS_ROUTER Flag to identify whether the device is router or not. num (1,0) IS_SLB Flag to identify whether the device supports server load balancing or not.
H Database tables and fields TABLE 94 1554 DEVICE (Continued) Field Definition Format Size TAC_USERNAME_PORT_CFG TACACS username for port configuration. varchar 512 TAC_PASSWORD_PORT_CFG TACACS password for port configuration. varchar 512 TAC_USERNAME_READ_ONLY TACACS username for read only access. varchar 512 TAC_PASSWORD_READ_ONLY TACACS password for read only access. varchar 512 TACPLUS_USERNAME_PORT_CFG TACACS+ username for port configuration.
H Database tables and fields TABLE 94 DEVICE (Continued) Field Definition Format Size SYSLOG_REGISTERED This flag is to indicate whether the device is registered DCM as its syslog destination server. • 0 indicates not registered. • 1 indicates registered. num 1 TRAP_REGISTERED This flag is to indicate whether the device is registered DCM as its SNMP trap destination server. • 0 indicates not registered. • 1 indicates registered.
H Database tables and fields TABLE 94 1556 DEVICE (Continued) Field Definition Format IS_DCB_SWITCH This column is used to flag whether the device is num a DCB Switch or not. Value 0 indicates that this is not a DCB switch device and hence that is the default value and value 1 indicates that this is a DCB device. The values will be populated by the DCB collector during the discovery of the DCB switch. PRODUCT_FAMILY Record the product family as "BI", "EI", "FGS/FLS/STK".
H Database tables and fields TABLE 94 DEVICE (Continued) Field Definition Format VCS_ID This column is used to store the VCS ID of the device. The value will be populated by the NosSwitchAssetCollector during the discovery of the VCS Cluster. The non zero value will be stored as VCS ID. Default value is -1. smallint VCS_LICENSED Indicates whether the cluster device has VCS license or not. Possible values are 0 for not applicable, 1 for licensed, 2 for not licensed. 0 is default.
H Database tables and fields TABLE 94 Definition Format Size USER_DEFINED_VALUE_1 User defined value used for product. varchar 256 USER_DEFINED_VALUE_2 User defined value used for product. varchar 256 USER_DEFINED_VALUE_3 User defined value used for product. varchar 256 CLUSTER_MEMBER_STATE Indicates the state of the member in Fabric Cluster and logical chassis. States can be Online, Offline, Rejoining etc.. For all other devices this column will be empty.
H Database tables and fields TABLE 95 DEVICE_CONNECTION (Continued) Field Definition Format MISSING_TIME Time from which the device connection has been missing. timestamp TRUSTED Indicates if the device connection is trusted or not. int TABLE 96 Size DEVICE_ENCLOSURE Field Definition Format ID* Unique generated database identifier. int NAME Name of the Device enclosure. varchar 256 TYPE Type of Device enclosure - Storage Array/Server. varchar 32 ICON Type of Icon.
H Database tables and fields TABLE 96 Definition Format CREATION_TIME Time when enclosure was created. Default is ’now()’. timestamp MISSING Flag to indicate missing enclosure. Default value is 0. smallint MISSING_TIME Time when the enclosure is found to be missing. timestamp HOST_NAME Host Name corresponding to the Device Enclsoure. varchar SYSLOG_REGISTERED SysLog flag that indicates if syslog has been enabled or not.
H Database tables and fields TABLE 98 DEVICE_FDMI_DETAILS Field Definition Format DEVICE_NODE_ID Device node id for the FDMI device node. This column refers to the device_node tables primary key int SERIAL_NUMBER Holds the serial number of the device available via FDMI varchar 128 FIRMWARE_VERSION Holds the firmware version of the device available via FDMI ex: 2.1.0.2 varchar 64 DRIVER_VERSION Holds the driver version of the device available via FDMI, ex: 2.1.0.
H Database tables and fields TABLE 100 DEVICE_GROUP_ENTRY Field Definition Format DEVICE_GROUP_ID Database ID of the DEVICE_GROUP instance which the device is member of. int DEVICE_GROUP_ENTRY_ID Unique database auto generated identifier. int DEVICE_ID Database ID of the member DEVICE. int TABLE 101 DEVICE_GROUP Field Definition Format DEVICE_GROUP_ID Primary key for this table. int NAME Name of this device group.
H Database tables and fields TABLE 103 DEVICE_NODE (Continued) Field Definition Format Size TYPE Initiator or target or both or unknown. The possible values are Initiator, Target, Initiator+Target, Unknown(Initiator or Target) varchar 32 DEVICE_TYPE 0 = physical 1 = virtual 2 = NPV 3 = iSCSI 4 = both physical & virtual smallint SYMBOLIC_NAME Device node symbolic name. varchar 256 FDMI_HOST_NAME Device node FDMI host name. varchar 128 VENDOR Device node vendor.
H Database tables and fields TABLE 104 DEVICE_PORT Field Definition Format Size PORT_ID Stores the FDMI host name. varchar 6 TYPE Stores the Vendor of this device. varchar 32 SYMBOLIC NAME Stores the Symbolic Name. varchar 256 varchar 64 varchar 16 varchar 63 32 FC4_TYPE COS Stores the Class of Service. IP_PORT HARDWARE_ADDRESS Stores the Hardware Address. varchar TRUSTED Denotes if the device port is trusted or not. smallint CREATION_TIME The creation time of this record.
H Database tables and fields TABLE 105 DEVICE_PORT_GIGE_PORT_LINK (Continued) Field Definition Format VIRTUAL_FCOE_PORT_ID The value of virtual_fcoe_port_id in the Device_Port_Gige_Port_Link table is applicable only for NOS devices. For FOS devices, the virtual_fcoe_port_id value, will be null, as currently in the Management application that mapping data is not collected. Hence the default value is null. int LAG_ID LAG interface ID which associates port channel with end device.
H Database tables and fields TABLE 108 1566 ENCRYPTION_ENGINE (Continued) Field Definition Format STATUS Not used. Previously used to indicate the engine''s operational status. Replaced by EE_STATE. The default value is 0. smallint HA_CLUSTER_ID Foreign key reference to an HA_CLUSTER record. Identifies the HA Cluster that this engine belongs to. Null if this engine does not belong to an HA Cluster.
H Database tables and fields TABLE 108 ENCRYPTION_ENGINE (Continued) Field Definition Format Size LINK_STATE Local EE State says whether link is down or up varchar 256 REBALANCE_REQUIRED This field indicates whether a rebalance operation is required on the Encryption Engine. It can take two values, One(1) indicating that rebalance is required on the Encryption Engine and zero(0) indicating that no rebalance is required on the Encryption Engine.
H Database tables and fields TABLE 109 1568 ENCRYPTION_GROUP (Continued) Field Definition Format ACTIVE_MASTER_KEY_ STATUS The operational status of the "master key" or "Key Encryption Key (KEK)" used to encrypt Data Encryption Keys in a key vault. Not used for Decru LKM key vaults. 0 = not used, 1 = required but not present, 2 = present but not backed up, 3 = okay. The default value is 0.
H Database tables and fields TABLE 110 ENCRYPTION_GROUP_MEMBER Field Definition Format ID Unique generated database identifier.
H Database tables and fields TABLE 112 Definition Format TAPE_POOL_OPERATION_MODE Specifies which type of encryption should be used by tape volumes in this tape pool. 0 = Native, 1 = DF-compatible smallint TAPE_POOL_POLICY Specifies whether tape volumes in this tape pool should be encrypted. 0 = encrypted, 1 = cleartext smallint KEY_EXPIRATION Number of days each data encryption key for this tape pool should be used.
H Database tables and fields TABLE 115 EVENT (Continued) Field Definition Format Size ACKNOWLEDGED Indicates whether the user has acknowledged the event or not. Possible values: Unacknowledged-0 , Acknowledged-1. smallint SOURCE_NAME This field indicates the name of the source that triggered the event. This could be the name of the source switch or name of the Management application server in the case of application events.
H Database tables and fields TABLE 116 EVENT_CALL_HOME Field Definition Format ID Unique generated database identifier. int EVENT_ID Database ID of the EVENT instance. int EVENT_NUMBER Indicates the Event Number for the event from the Events.html of the associated product . int FRU_CODE Indicates the Field Replaceable Unit code of the Call Home event. int REASON_CODE Indicates the reason code of the Call Home event. int FRU_POSITION Indicates the FRU position of the Call Home event.
H Database tables and fields TABLE 119 EVENT_DETAILS (Continued) Field Definition Format UNIT Indicates the Unit number of the Chassis from which the event was triggered. smallint SLOT Indicates the blade or the slot number in which the port is present. int PORT indicates the switch port number for which the event was generated. int PRODUCT_ADDRESS Indicates the IP Address of the Product from which the event is originated. varchar RAS_LOG_ID Indicates the RASLOG Id of the RASLOG event.
H Database tables and fields TABLE 121 EVENT_INSTANCE (Continued) Field Definition Format Size STRING_PATTERN A Regular expression pattern string which can be used to match an Event instance. varchar 1024 CATEGORY A small integer which identifies the Category of an Event instance. 0 - Unknown 1 - Product Event 2- Link Incident Event 3 - Product Audit Event 4- Product Status Event 5 Security Event 6- User Action Event 7- Management Server Event. The default value is 0.
H Database tables and fields TABLE 123 EVENT_NOTIFICATION (Continued) Field Definition Format NOTIFICATION_UNIT Time interval Unit: 0 = Seconds 1 = Minutes 2 = Hours Default value is 0. smallint TEST_OPTION Time interval Unit: 0 = Send test to configured e-mail address. 1 = Send test to all enabled users. Default value is 0. smallint SSL_ENABLED Default value is 0.
H Database tables and fields TABLE 125 Definition Format EVENT_ORIGIN 0- SNMP Trap 1- Application Event 2- Pseudo Event 3Snort 4- Pseudo Event 5- Custom Event smallint PROPERTIES The property string which is used to define various parameters that are associated with an Event Policy such as flapping time and durations etc varchar TABLE 126 Size 2048 EVENT_POLICY_SOURCE_ENTRY Field Definition Format ID Unique generated database identifier.
H Database tables and fields TABLE 128 EVENT_RULE Field Definition Format ID* Unique generated database identifier. int NAME Name of the Event Rule. varchar Event Rule Type: 0 = Port Offline 1 = PM Threshold crossed 2 = Security Violation 4 = Event int DESCRIPTION Description about the Event Rule. varchar 512 OPERATOR1 AND operator used to append the rule. varchar 12 EVENT_TYPE_ID The Selected Event type ID from the Event type combo box.
H Database tables and fields TABLE 129 Definition Format Size NAME Name of the Event Rule Action: • Launch Script = for launch script • Send E-mail = for send e-mail • Raise Event = for broadcast message varchar 255 TYPE Name of the action: • script = for Launch Script • e-mail = for E-mail • message = for Broadcast message varchar 30 FIELD1 Data for the selected action. varchar 512 FIELD2 Data for the selected action. varchar 512 FIELD3 Data for the selected action.
H Database tables and fields TABLE 130 FABRIC (Continued) Field Definition Format TRACK_CHANGES 1 = changes (member switches, ISL and devices) in the fabric are tracked. Default value is 0. smallint STATS_COLLECTION 1 = statistics collection is enabled on the fabric. Default value is 0. smallint CREATION_TIME When the fabric record is inserted, i.e., created. Default value is ’now()’. timestamp LAST_FABRIC_CHANGED Time when fabric last changed.
H Database tables and fields TABLE 130 Definition Format VCS_LICENSED Indicates whether the fabric has VCS license or not. Possible values are 0 for not applicable, 1 for licensed, 2 for not licensed. 0 is default. Fabrics representing clusters with 2 or less nodes will have value of 0 as all those are automatically licensed. Fabrics representing clusters with 3 or more nodes will have values 1 or 2 depending on whether the license was acquired or not.
H Database tables and fields TABLE 134 FABRIC_DISCOVERY_POLICY_RULE Field Definition ID Format serial FABRIC_ID The database ID of the fabric that the policy belongs to. int FILTER Filter to be applied for this fabric. This could be IP Address or WWN or SwitchType. The Type of the filter comes from the FilterType column. This can be either in included list or excluded list depending on the EXCLUDED column value. varchar FILTER_TYPE This column indicates type of the filter.
H Database tables and fields TABLE 137 Field Definition Format FABRIC_ID Foreign key to ID in fabric table. int VCS_CLUSTER_ME_ID Foreign key to ID in ManagedElement table. This is the VCS cluster entry managed_element_id reference. int TABLE 138 Size FABRIC_ZONING_EDIT_RESTRICTION Field Definition Format ID Unique generated database identifier. int FABRIC_ID PK of the owning fabric int CHANGE_COUNT Count of the maximum changes allowed in active zone config in the fabric.
H Database tables and fields TABLE 139 FAVORITES (Continued) Field Definition Format CUSTOM_SELECTION_OBJE CT_TYPE Represents the selected filter type. • 0 - Default favorite • 1 - FC Ports • 2 - Device Ports • 3 - ISL Ports • 4 - 10GE Ports • 5 - FCIP Tunnels • 6 - EE Monitors Selected member identifiers are stored in CUSTOM_FAVORITES_OBJECT_LIST table if this favorite is not default. int PLOT_EVENTS Indicates whether the PM historical chart should overlay the events on the graph.
H Database tables and fields TABLE 142 1584 FCIP_TUNNEL (Continued) Field Definition Format KEEP_ALIVE_TIMEOUT FCIP Tunnel Parameter. int MAX_RETRANSMISSION FCIP Tunnel Parameter. int WAN_TOV_ENABLED Is WAN TOV enabled. Default value is 0. smallint TUNNEL_STATUS Tunnel Status (Active/Inactive). int DESCRIPTION Description for the created tunnel. varchar FICON_TRB_ID_ENABLED Whether Ficon_Tape_Read_Block is enabled on that tunnel. Default value is 0.
H Database tables and fields TABLE 142 FCIP_TUNNEL (Continued) Field Definition Format FICON_DEBUG_FLAGS FICON_DEBUG_FLAGS for that particular tunnel. Default value is -1. double precision REMOTE_WWN Configured WWN of the Remote Node. char CDC CDC Flag. Default value is 0. smallint ADMIN_STATUS Admin Status of the Tunnel. Default value is 0. smallint CONTROL_L2_COS Class of service as defined by IEEE 802.1p for tunnel. int Default value is -1.
H Database tables and fields TABLE 142 FCIP_TUNNEL (Continued) Field Definition Format TAPE_ACCELERATION_ENA BLED Whether turbo write (fast write) is enabled or not (0,1). Default value is 0. smallint IPSEC_ENABLED Default value is 0. smallint PRESHARED_KEY The preshared key on tunnel. char QOS_HIGH QoS high value. smallint QOS_MEDIUM QoS medium value. smallint QOS_LOW QoS low value.
Database tables and fields TABLE 143 H FCIP_TUNNEL_CIRCUIT (Continued) Field Definition Format SELECTIVE_ACK Select acknowledgement flag.The default value is 0. smallint QOS_MAPPING QOS Mapping. The default value is 0. smallint PATH_MTU_DISCOVERY MTU Discovery Path. The default value is 0. smallint MIN_COMM_RATE Minimum communication int Speed. The default value is 0. MAX_COMM_RATE Maximum communication int Speed. The default value is 0. MIN_RETRANSMIT_TIME Minimum Retransmission Time.
H Database tables and fields TABLE 143 1588 FCIP_TUNNEL_CIRCUIT (Continued) Field Definition Format Size MISMATCHED_CONFIGURATIONS If a tunnel is down due to mismatched configurations on local and remote end, this property specifies the list of such mismatched configurations. varchar 1024 CIRCUIT_STATUS_STRING Circuit Status string value from switch for the tunnel varchar 256 L2COS_F_CLASS The default value is 0. smallint L2_COS_HIGH The default value is 0.
H Database tables and fields TABLE 144 FCIP_TUNNEL_PERFORMANCE Field Definition Format TUNNEL_ID Primary key of the Switch Port int SWITCH_ID The number of octets or bytes that have been transmitted by this port. One second periodic polling of the port. This value is saved and compared with the next polled value to compute net throughput. Note, for Fibre Channel, ordered sets are not included in the count int TX 'The number of octets or bytes that have been transmitted by this port.
H Database tables and fields TABLE 145 Field Definition Format DEVICE_NODE_ID The primary key of the DeviceNode. int DIRECT_ATTACH Indicates whether the fcoe device is directly attached to the switch''s TE port or to a cloud. smallint ATTACH_ID The primary key of the port (if direct attached) or cloud (if not direct attached). int MAC_ADDRESS Mac address of device. varchar 64 Size TABLE 146 Size FCR_ROUTE Field Definition Format ID* Unique generated database identifier.
H Database tables and fields TABLE 149 FEATURES_USAGE (Continued) Field Definition Format USAGE_COUNT Count shows how many times the feature is accessed. int FIRST_UPDATED_TIME Identifies the first updated time stamp. timestamp TABLE 150 Size FICON_DEVICE_PORT Field Definition Format DEVICE_PORT_ID* Value for the device port to which these FICON properties are applied. int TYPE_NUMBER Size varchar 16 MODEL_NUMBER Ficon device model number, such as S18.
H Database tables and fields TABLE 152 Field Definition Format FIRMWARE_ID* ID for the firmware file. int SWITCH_TYPE* Switch type that supports this firmware file. smallint REBOOT_REQUIRED Reboot required flag for the switch type. smallint NUMFILES Number of files in the firmware. int TABLE 153 Size FOUNDRY_DEVICE Field Definition Format DEVICE_ID Database ID of the DEVICE instance. int IMAGE_VERSION Firmware image version currently running in the device.
H Database tables and fields TABLE 154 FOUNDRY_MODULE (Continued) Field Definition Format Size EXPANSION_MODULE_TYPE Expansion board type. Refer snAgentBrdExpBrdId in foundry.mib for more details and possible values. num (4,0) EXPANSION_MODULE_DESCRIPTION The expansion board description string. Expansion board are those boards attaching on the main board. varchar 128 TABLE 155 FOUNDRY_PHYSICAL_DEVICE Field Definition Format PHYSICAL_DEVICE_ID Unique generated identifier.
H Database tables and fields TABLE 159 FRU Field Definition Format ID Unique generated database identifier. int CORE_SWITCH_ID int TAG provides the TAG number of FRU element, requested by SMIA and values filled in by Switch Asset Collector. Field probably contains information such as asset tag or serial number data.
H Database tables and fields TABLE 159 FRU (Continued) Field Definition Format TOTAL_OUTPUT_POWER provides the total power output of the power supply FRU element, requested by SMIA and values filled in by Switch Asset Collector will be available only from FOS 6.4 switches and above. this field is applicable only for the power supply FRU element. The default value is -1.
H Database tables and fields TABLE 161 Definition Format Size EFCM_USER Management application user who has generated this report. varchar 128 REPORT_OBJECT Report object BLOB. bytea TIMESTAMP_ Timestamp when the report is generated. timestamp FABRIC_NAME Fabric Name. varchar 256 Field Definition Format Size ID* Unique generated database identifier. int SWITCH_PORT_ID ID for the GigE Port in SWITCH_PORT. int PORT_NUMBER GigE Port Number(0 for ge0 and 1 for ge1).
H Database tables and fields TABLE 163 GIGE_PORT_ETHERNET_CLOUD_LINK Field Definition Format ID Unique generated database identifier. int CLOUD_ID int SWITCH_PORT_ID The unique id of the switch TE port that this member connects to. int TRUSTED smallint CREATION_TIME timestamp MISSING smallint MISSING_TIME timestamp TABLE 164 GIGE_PORT_STATS Field Definition Format ID* Unique generated database identifier. int SWITCH_ID References the ID in CORE_SWITCH table.
H Database tables and fields TABLE 167 Field Definition Format ID Unique generated database identifier. serial NAME User-supplied name for the HA Cluster. varchar ENCRYPTION_GROUP_ID Foreign key reference to the ENCRYPTION_GROUP that contains this HA Cluster. int MEMBER_LIST A comma-separated list of Encryption Engines in the HA Cluster. Each engine is identified by a switch node WWN, followed by "/", followed by the slot number.
Database tables and fields TABLE 168 H HBA (Continued) Field Definition Format Size BIOS_VERSION The version level of the BIOS varchar 256 PCI_REG_VENDOR_ID The identifier of the PCI Register''s vendor varchar 32 PCI_REG_DEVICE_ID The device ID of the PCI Register varchar 32 PCI_REG_SUBSYSTEM_ID The ID of the PCI subsystem varchar 32 PCI_REG_SUBSYS_VENDOR_ID The ID of the PCI subsystem vendor.
H Database tables and fields TABLE 168 Definition Format Size VPD_PW PW details of the device varchar 32 VPD_EDC EDC details of the device varchar 32 VPD_MDC MDC details of the device varchar 32 VPD_FABRIC_GEOGRAPHY FABRIC_GEOGRAPHY of the device varchar 256 VPD_LOCATION LOCATION of the device varchar 256 VPD_MANUFACTURER_ID MANUFACTURER_ID of the device varchar 256 VPD_PCI_GEOGRAPHY PCI_GEOGRAPHY of the device varchar 256 VPD_VENDOR_DATA VENDOR_DATA of the device varchar
H Database tables and fields TABLE 170 HBA_PORT (Continued) Field Definition Format CONFIGURED_TOPOLOGY The topology setting. The default value is 1. int MAX_SPEED_SUPPORTED The maximum port speed that is supported on the port, in Gb/s. The default value is 0. int OPERATING_STATE Indicates whether the link is online or offline. The default value is 0. smallint OPERATING_TOPOLOGY The topology setting at which the port is operating. The default value is 1.
H Database tables and fields TABLE 171 HBA_PORT_DETAIL Field Definition Format DEVICE_PORT_ID Device port id acts as the primary key int PERSISTENT_BINDING Persistent binding value of the port. With persistent binding (on the host), one can bind a LUN to a specific device file, thus making sure devices reappear on the same device files after reboots. 0 – disable 1 – enabled smallint FABRIC_NAME Principal switch WWN of the Fabric to which the port is associated with.
H Database tables and fields TABLE 171 HBA_PORT_DETAIL (Continued) Field Definition Format MPIO_MODE_STATE Indicates whether multipathing mode is on or off.. The default value is 0. smallint PATH_TIME_OUT The value between 0 to 60 that specifies the time out session. Note you can only enable or edit the path time out when MPIO is disabled. int Size The default value is 0. LOGGING_LEVEL The port logging level. Values include Log Critical, Log Error, Log Warning, and Log Info.
H Database tables and fields TABLE 171 HBA_PORT_DETAIL (Continued) Field Definition Format Size MEDIA media of port varchar 64 IOC_ID IO controller ID int PREBOOT_DISABLED Boolean value indicating if port was disabled during preboot.. The default value is 0. smallint ALARM_WARNING A bit mask indicating degrading SFP if the bit mask has any 1s in it. It bit mask is all 0s then SFP is in good state. varchar IO_EXEC_THROTTLE_MAX Maximum value is 2000.
H Database tables and fields TABLE 173 HBA_PORT_FCOE_DETAILS (Continued) Field Definition Format Size FCF_FCMAP FC Map value of port. Currently not used. varchar 256 FCF_FPMA_MAC FPMA (fabric-provided MAC address) MAC address of port. Currently not used. varchar 64 FCF_MAC FCF (FCoE Forwarder) MAC value of port. varchar 64 FCF_MODE FCF (FCoE Forwarder) Mode of the port. Currently not used. varchar 256 FCF_NAMEID FCF (FCoE Forwarder) Name of the port currently Not used.
H Database tables and fields TABLE 174 1606 HBA_REMOTE_PORT Field Definition Format Size ID Autogenerate primary column. int SYMBOLIC_NAME The symbolic name associated with the remote port. varchar 256 PORT_WWN The world wide name of the remote device''s port.
H Database tables and fields TABLE 174 HBA_REMOTE_PORT (Continued) Field Definition Format Field to indicate whether the remote port supports data retransmission.0 would mean unsupported and nonzero value implies supported. The default value is 0. smallint DATA_RETRANSMISSION_S UPPORT Field to indicate whether the remote port supports the REC ELS command Channel number in the PCI Bus.Zero would mean unsupported and nonzero value implies supported. The default value is 0.
H Database tables and fields TABLE 176 HBA_TARGET Field Definition Format DEVICE_PORT_ID Primary key from the Device port table int HBA_REMOTE_PORT_LUN_ ID Primary key from the HBA Remote port lun table int BOOT_LUN Flag to indicate of the LUN is bootable. The default value is -1. smallint TRUSTED Denotes whether target is trusted or not. 0 denotes untrusted and 1 is for trusted.
H Database tables and fields TABLE 179 HOST_DISCOVERY_OPTION (Continued) Field Definition Format Size JSON_USERNAME Username for the JSON agent varchar 128 JSON_PASSWD Password for the JSON agent varchar 512 DISCOVER_CIM Flag to indicate CIM based discovery. on/off. The default value is 0. smallint CIM_IMPL CIM implemenation used. 1: SMI, 2: WMI. The default value is 0.
H Database tables and fields TABLE 181 HOST_DISCOVERY_REQ_GROUP Field Definition Format ID Auto generated primary key int NAME Unique name for the host request. The default value is ‘ New Host Group'. varchar( Primary key from the host discovery options table. Points to the associated discovery options int Reflects the status of the request E.g. 0-> Completed, 1->Delete Pending. The default value is 0.
H Database tables and fields TABLE 183 HOST_DISCOVERY_REQUESTS Field Definition Format Size ID Auto generated primary key. HOST_NAME Hostname: IP address or host name. varchar 256 DEVICE_ENCLOSURE_ID Identifier of the Host which this request is associated. int HOST_DISCOVERY_REQ_ GROUP_ID Identifier of the Host discovery request group which this request is associated. int HOST_DISCOVERY_OPTI ONS_ID Reference to the Host discovery options associated with this request.
H Database tables and fields TABLE 184 Definition Format PROCESSOR_COUNT Number of virtual CPUs of the VM. int STATUS Status of the VM. varchar 64 STATE Operational State of the VM. varchar 64 NOTES Notes describing the VM. varchar 2048 UPTIME The time since the VM was last powered up. varchar 512 Size TABLE 185 Definition Format ID Primary Key int HYPER_V_VM_ID ID of the HYPER_VIRTUAL_MACHINE instance.
H Database tables and fields TABLE 187 IFL_CONNECTION Field Definition Format BB_PORT_ID Backbone switch port ID. int BB_PORT_WWN Backbone switch port WWN. varchar 23 Definition Format Size TABLE 188 Size INTERFACE Field INTERFACE_ID int SWITCH_SERVICE_ID int DEVICE_ID int NAME varchar 255 IDENTIFIER varchar 255 TABLE_SUBTYPE varchar 255 TAG_MODE smallint VLAN_TAG_TYPE int UNTAGGED_VLAN_ID The existing Data type short has been modified to integer.
H Database tables and fields TABLE 188 Definition Format Size USER_DEFINED_VALUE_3 User defined value used for IP Port. varchar 256 FEATURES_SUPPORTED Contains the features supported as a bit mask at port level. Possible values are: 1 - Flex port (can be converted to fiber channel or Ethernet port) int TABLE 189 INTERFACE_DEPLOYMENT_CONFIG Field Definition Format ID Unique generated database identifier. serial DEPLOYMENT_ID Deployment configuration ID. Foreign Key for DEPLOYMENT table.
H Database tables and fields TABLE 190 IP_DEVICE_LICENSE (Continued) Field Definition Format PRECEDENCE Defines the priority of a particular trial license among those having the same package and License ID. This is primarily used for determining which license to use, when there are many trial and normal licenses with same package name and LID. The value range is (0..65535) int LICENSE_STATE This indicates the state of the license.
H Database tables and fields TABLE 193 IP_ROUTE (Continued) Field Definition Format SLOT_NUMBER Slot Number related to the GigE Port. int NET_MASK Subnet Mask for the Route. varchar 64 GATEWAY Gateway for the Route. varchar 64 IP_ADDRESS IP Address created after ''”&”'' operation of gateway. varchar 64 METRIC Metric. int FLAG Flag. int CHECKSUM Check Sum. varchar GIGE_PORT_TYPE Whether the IP interface is created on a 10G cross port or not.
H Database tables and fields TABLE 196 ISL (Continued) Field Definition Format TRUSTED Denotes whether ISL link is trusted or not. • 0 denotes untrusted • 1 denotes trusted. smallint CREATION_TIME Creation time of the ISL record in the Management application database. timestamp MISSING Denotes whether ISL link is missing or not. • 0 denotes present • 1 states that ISL is missing smallint MISSING_TIME States the missing time of the this ISL.
H Database tables and fields TABLE 197 Definition Format TRUNKED This column is used to determine whether the isl is part of a trunk or not. The value of 0 means not trunked, 1 means this isl is part of a trunk and -1 means not applicable status. Default value is -1. int MASTER_CONNECTION_ID This will hold the id of the master ISL connection for a ISL between trunk members. The ISL Connection between masters will have its own ID in this column. Non trunk ISLs will have the default value of -1.
H Database tables and fields TABLE 198 ISL_TRUNK_GROUP (Continued) Field Definition Format MISSING_TIME States the missing time of the this ISL trunk group. If the trunk is not missing then it will be null timestamp MEMBER_TRACKING_STAT US Member added/removed status of this trunk. This is represented as bitmap value. Each bit is set based on membership state change. Currently only 2 bits from LSB are used.
H Database tables and fields TABLE 201 L2_ACCESS_CONTROL_ENTRY Field Definition Format ID serial ACCESS_CONTROL_LIST_ID L2 access control list ID, to which the ACL entry is associated. SEQUENCE_NUMBER int int ACTION Specifies the action: 0 = Permit 1 = Deny smallint SOURCE_MAC Source MAC address. varchar 24 SOURCE__MASK Source MAC address mask. varchar 24 DEST_MAC Destination MAC address. varchar 24 DEST_MASK Destination MAC address mask.
Database tables and fields TABLE 203 L2_ACL_DEVICE_DEPLOY_MAP Field Definition Format DEPLOYMENT_ID Deployment configuration ID. Foreign Key for DEPLOYMENT table. int L2_ACCESS_CONTROL_LIST_ID L2 Access control List ID for reference to the L2_ACCESS_CONTROL_LIST. Foreign Key for L2_ACCESS_CONTROL_LIST table. int TABLE 204 Size L2_ACL_INTERFACE_DEPLOY_MAP Field Definition Format ID Unique generated database identifier. serial DEPLOYMENT_ID Deployment configuration ID.
H Database tables and fields TABLE 206 L3_ACL_DEVICE_DEPLOYMENT_MAP Field Definition Format DEPLOYMENT_ID Deployment configuration ID. int L3_ACCESS_CONTROL_LIST_ID TABLE 207 int L3_ACL_INT_DEPLOYMENT_MAP Field Definition Format ID 1622 Size serial DEPLOYMENT_ID Deployment configuration ID. int INBOUND_L3_ACL_ID L3 Access control List ID of the L3 ACL selected for inbound. int INBOUND_WRITE_TO_DEVICE 1/0 corresponding to Write to device/not write to device for inbound traffic.
H Database tables and fields TABLE 208 LAG (Continued) Field Definition Format MTU Maximum transmission unit in bytes. range 1522..9208. int LOAD_BALANCE Load balancing details. varchar VLAG Specifies whether the lag is a vlag or not. smallint Field Definition Format ID DB ID of LAG member(port). int LAG_ID FK to owning LAG int NAME Member name varcha TYPE currently not used. The default value is 0. smallint MEMBER_MODE Dynamic Mode Active/passive. The default value is 0.
H Database tables and fields TABLE 211 Definition Format EMPTY_DIALOG_ALLOWED This field indicates whether the dialog can be launched even when there are no fabrics discovered. • 0 = Yes • 1= No int INTERNAL_MODE_DIALOG The DCFM main client is not visible when the dialog is launched in internal mode. This mode is used when launching from SMIA config tool.
H Database tables and fields TABLE 213 LICENSE_DOWNGRADE_DETAILS Field Definition Format Size ID Primary key ID. PREVIOUS_LICENSE_INFO Previous License information during downgrade. The details will have license type, license count like fabric, device, port etc. varchar 512 NEW_LICENSE_INFO New License information during downgrade. The details will have license type, license count like fabric, device, port etc. varchar 512 DOWNGRADE_TIME Time when License is downgraded.
H Database tables and fields TABLE 217 Field Definition Format LINK_ID Unique database generated identifier. int TYPE Type of the link. Currently it is always U. varchar 1 NAME Name of the link which is combination of device display name and ifName of the interface which this link associated. varchar 255 TABLE 218 Size LOCK Field Definition Format Size NAME The name of this transaction synchronization lock.
H Database tables and fields TABLE 221 LSAN_PROXY_DEVICE Field Definition Format FCR_FABRIC_ID* FID assigned to edge fabric int PROXY_PID* Proxy device PID char 6 STATE State of the device varchar 128 LSAN_DEVICE_ID* LSAN_DEVICE record reference int Field Definition Format ID* Unique generated database identifier. int BB_FABRIC_ID Backbone fabric DB ID. int EDGE_FABRIC_ID FID assigned to edge fabric. int NAME LSAN zone name.
H Database tables and fields TABLE 225 MCT_CLIENT Field Definition Format DEPLOY_STATE MCT Client deployment state: • Deployed(0) • Undeployed(1) smallint VCN_MEMBER_ID Virtual Cluster Node member Cluster id foreign key. int TABLE 226 MAC_FILTER Field Definition Format ID Size serial MAC_FILTER_NUMBER MAC Filter number. int FILTER_ACTION Defined Permit - 0 or Deny -1 smallint DESCRIPTION Description associated with each MAC Filter entry.
H Database tables and fields TABLE 228 MAC_FILTER_INT_DEPLOYMENT_MAP (Continued) Field Definition Format INBOUND_MAC_FILTER_ID MAC FILTER Id of the MAC Filter selected for inbound. Foreign Key for MAC_FILTER table. int INBOUND_WRITE_TO_DEVICE 1/0 corresponding to Write to device/not write to device for inbound traffic. smallint Field Definition Format ID Sequence number of the records int NAME Name of the mac group, for internal representation of the group.
H Database tables and fields TABLE 232 Field Definition Format ID The primary key of the table. int HOST_TIME The time at which the server processed the event. timestamp CATEGORY The violations category. i.e. Port Health, Fabric Health, etc. int VIOLATION_TYPE The type of the violation. i.e. CRC, ITW. int MANAGED_ELEMENT_ID The managed element corresponding to this event. int ORIGIN_FABRIC_ID The fabric from which the event originated. Retaining this id as historical data.
H Database tables and fields TABLE 233 MAPS_EVENT_DETAILS (Continued) Field Definition Format Size CURRENT_VALUE The current value of the measure that triggered the violation. varchar 32 SWITCH_ENABLED_ACTI ONS MAPS actions enabled on the switch at the time the violation occurred. int TABLE 234 MAPS_EVENT_CAUSE_ACTION Field Definition Format VIOLATION_TYPE The type of the violation. i.e. CRC, ITW, as defined in MapsConstants.
H Database tables and fields TABLE 237 Definition Format INDEX_TYPE Identifies the index type for a given SNMP MIB or Expression measure. Various index type supported are 0 - UNKNOWN, 1 - SCALAR, 2 - IF_INDEX, 3 - ETHER_STATS_INDEX, 4 - CONN_UNIT_INDEX, 5 FCIP_LINK_TABLE_INDEX, 6 - CUSTOM, 7 SW_TEMP_SENSOR_INDEX, 8 SW_FAN_SENSOR_INDEX, 9 SW_POWER_SENSOR_INDEX. For non-SNMP measures like EE Monitors, Ping statistics etc. index type is not applicable.
Database tables and fields TABLE 239 H MIGRATION_HISTORY Field Definition Format Size TARGET_RELEASE Target release name and version. Example Network Advisor 12.1.0. varchar 128 TARGET_RELEASE_BUILD_NUMB ER Target release build number. int MIGRATION_TIME Date and Time at which this migration completed. timestamp Field Definition Format MODULE_TYPE_ID Primary key for this table. int MODULE_TYPE Type of the module. NAME Name of the module configured in this device.
H Database tables and fields TABLE 240 Definition Format REDUNDANT_STATUS Specifies the redundant status of the module. Possible values are 1, 2, 3, 4, 5. 1 - other, 2 - active, 3 - standby, 4 - crashed, 5 - comingUp. Non management modules always return value as other. Management module returns the rest of the states. int OPERATIONAL_STATUS Specifies the operational status of the module.
H Database tables and fields TABLE 243 MPLS_ADMIN_GROUP_INTERFACE_RELATION Field Definition Format MPLS_ADMIN_GROUP_INTERFAC E_RELATION_DB_ID Unique database generated identifier. int MPLS_ADMIN_GROUP_DB_ID Database ID of the MPLS_ADMIN_GROUP instance. int INTERFACE_ID Database ID of the INTERFACE instance. int TABLE 244 Size MPLS_LSP Field Definition Format MPLS_LSP_DB_ID Unique database generated identifier.
H Database tables and fields TABLE 247 Field Definition Format MPLS_LSP_DB_ID Unique database generated identifier. int IS_ENABLED Represents whether the LSP is enabled. Enabled-1, Disabled-0. num (1,0) IS_BYPASS Represents if the LSP is a Bypass LSP or not. Not a Bypass-0, Bypass LSP-1. Currently ByPass LSPs are not supported. So the value will be always 0. num (1,0) FROM_IP_ADDRESS Represents the Source IP Address of the LSP.
Database tables and fields TABLE 248 MPLS_RSVP_LSP_ACTUALLY_ROUTED_HOP (Continued) Field Definition Format HOP_IP_ADDRESS The Tunnel Hop Address for this tunnel hop. int MPLS_LSP_DB_ID Database ID of the MPLS_RSVP_LSP instance which this hop is part of. int TABLE 249 Definition Format MPLS_RSVP_LSP_ADMIN_GROUP Unique database generated identifier. _DB_ID int AFFINITY_TYPE Represents the affinity type of the MPLS Admin Group.
H Database tables and fields TABLE 252 Field Definition Format MPLS_RSVP_LSP_PARAMETERS_D B_ID Unique database generated identifier. int IS_ADAPTIVE Indicates if the LSP supports adaptive mechanism or not. Non Adaptive-0, Adaptive-1. num BFD_TRANSMIT This object specifies the minimum interval, in milliseconds, that the local system would like to use when transmitting The Bidirectional Forwarding Detection(BFD) Control packets. Accepts a range of 50-30000.
H Database tables and fields TABLE 253 MPLS_RSVP_LSP_PATH (Continued) Field Definition Format Size IS_STANDBY Specifies whether the path is standby or not. Currently it is unused and value is always 0 (Not standby) num (1,0) MPLS_LSP_DB_ID Database ID of the MPLS_RSVP_LSP instance. int MPLS_PATH_DB_ID Database ID of the MPLS_PATH instance. int TABLE 254 MPLS_RSVP_LSP_TUNNEL_RESOURCE Field Definition Format MPLS_RSVP_LSP_TUNNEL_ Unique database generated identifier.
H Database tables and fields TABLE 256 Definition Format DEVICE_ID Database ID of the DEVICE instance. int TABLE_SUBTYPE Specifies the type of MPLS Service Relation with Device. Possible values are VLL_DEVICE_RELATION and VPLS_DEVICE_RELATION. varchar 32 NAME Name of the MPLS Service. varchar 255 COS This value indicates the Class Of Service for this endpoint (VLL/VPLS). Allowed range is 0-7 and 255. 255 means COS is not explicitly configured.
H Database tables and fields TABLE 258 MPLS_SERVICE_PEER_RELATION (Continued) Field Definition Format Size PEER_IP The IP of the Peer Device of the PW/PE maintenance protocol entity. varchar 255 OPER_STATUS Operational Status of the peer with the MPLS Service. Refer PwOperStatus MIB of foundry.mib for more details and possible values. smallint Field Definition Format MRP_RING_ID Auto generated database ID for MRP ring.
H Database tables and fields TABLE 260 Definition Format PRI_PORT_STATE State of device’s primary port. Other-1, Pre-Forwarding- 2, Forwarding-3, Blocking-4, Disabled-5. smallint PRI_PORT_TYPE Type of device’s primary port. Other-1, Regular port-2, Tunnel port-3. smallint PRI_PORT_ACTIVE_INTERFA CE_ID Interface database ID of an primary active port, which is sending RHPs. int SEC_PORT_INTERFACE_ID Interface database ID for the Secondary port of the device.
H Database tables and fields TABLE 263 NETWORK_SCOPE_TYPE Field Definition Format ID The primary key of the table. int NAME Name of the Scope. varchar 128 DESCRIPTION Description of the Scope. varchar 512 HANDLER_CLASS_NAME Fully defined Handler Class for the predefined SCOPE. varchar 128 Definition Format Size TABLE 264 Size NIC_PROFILE Field ID* int NAME The name of the network interface in the format network interface name / host address.
H Database tables and fields TABLE 266 Definition Format SRCDOMAIN Source domain ID int DSTDOMAIN Destination domain ID int LUNID Comma separate list of LUN IDs varchar 1024 OXID FC Originator Exchange ID for the frame. varchar 1024 QOS Quality of Service, can be comma separated values of: 1 - low, 2 - medium, 3 - high.
H Database tables and fields TABLE 267 NP_SUB_FLOW Field Definition Format DSTPORT Switch Destination port. smallint BIDIR This specifies if traffic in both direction has to be monitored, where, 0 - false, 1 - true SFID Source fabric ID. In case of FCR flow creation it will have FCR fabric Id in this field. In XISL it will have virtual fabric Id. For learning flow it will have *. varchar 12 DFID Destination fabric ID. In case of FCR flow creation it will have FCR fabric Id in this field.
H Database tables and fields TABLE 269 OUI_VENDOR (Continued) Field Definition Format Size VENDOR_CATEGORY Default is ‘none’. varchar 32 USER_MODIFIED TABLE 270 int PASSWORD_HISTORY Field Definition USER_NAME Size varchar 128 PASSWORD_UPDATED_ DATETIME The date and time the user updated password recently. timestamp PREVIOUS_PASSWORD User''s Previous password varchar 512 Size TABLE 271 PBR_INTERFACE_CONFIG Field Definition Format ID Primary key.
H Database tables and fields TABLE 273 PBR_NEXT_HOP Field Definition Format ID Primary key. int RULE_ID PBR rule id. int NEXT_HOP_SEQUENCE The sequence of the next hop entry that corresponds to a rule within a route map. The sequence of 1 indicates it is the first next hop to be tried for that rule. This is a running integer. int HOP_TYPE The Next hop type. 1 indicates INTERFACE, 2 indicates IP_ADDRESS, 3 indicates FLOOD VLAN.
H Database tables and fields TABLE 276 Definition Format ACL_MATCH_SEQUENCE The sequence of the matching acl entry that corresponds to a rule within a route map. The sequence of 1 indicates it is the first matching acl for that rule. This is a running integer. int ACL_NAME Name of the ACL for the rule. varchar ACL_TYPE Indicates the ACL type. Value of 4 denotes IPV4, Value of 6 denotes IPV6.
H Database tables and fields TABLE 278 PHYSICAL_DEVICE (Continued) Field Definition Format Size UNIT_NEIGHBOR1 Stacking neighbor's unit(left) number for the stackable devices. If there is no neighbor unit/non stackable devices, then set to 0. num (2,0) UNIT_NEIGHBOR2 Stacking neighbor's unit(left) number for the stackable devices . If there is no neighbor unit/non stackable devices, then set to 0. num (2,0) UNIT_PRESENT Used to identify the stack unit is present in the chassis or not.
H Database tables and fields TABLE 279 Definition Format IMAGE_VERSION Image version of the unit in the stack. For non-stacking device it will be always empty. varchar UNIT_ROLE Indicates unit role in the stack. Possible values: 1 other, 2 - active, 3 - standby, 4 - member, 5 standalone. For non-stacking device it will be always -1' int UNIT_PRIORITY Indicates unit priority. Possible values 0 to 255.
H Database tables and fields TABLE 282 PM_COLLECTOR_TARGET_SETTING (Continued) Field Definition Format ME_ID ME_ID of the target. int INDEX_MAP Stores the index_map value in case of an expression. varchar TABLE 283 Size 8192 PM_COLLECTOR_TIME_SERIES_MAPPING Field Definition Format COLLECTOR_ID DB ID of the pm_data_collector. int TARGET_NAME Time series data master table name. It could be either TIME_SERIES_DATA_1 or TIME_SERIES_DATA_2.
H Database tables and fields TABLE 284 Definition Format LEVEL3_ENABLED Enable / disable the third threshold check. This value is applicable only for Top N, Top Flow widgets. Default is 0. smallint LEVEL3_VALUE Limit value for the third percentage band. Default is 0. double precision LEVEL3_COLOR Limit value for the third percentage band. int LEVEL4_ENABLED Enable / disable the fourth threshold check. This value is applicable only for Top N, Top Flow widgets. Default is 0.
H Database tables and fields TABLE 285 PM_DATA_COLLECTOR (Continued) Field Definition Format STATUS Status of the collector. 0 - disabled and 1 - enabled. Default - 0. smallint TYPE Target type of the snmp collector data. for device smallint level collector the target type is 0, for port level it is 1. POLLING_INTERVAL Time interval in seconds; indicates the frequency with which the collector will poll the device to get the data. int CREATED_TIME Collector created time.
H Database tables and fields TABLE 287 Definition Format TWO_HOUR_SAMPLE_AGE The maximum time in seconds for retaining records in the PM stats 2hour sample tables (TIME_SERIES_DATA_1_2HOUR and TIME_SERIES_DATA_2_2HOUR) in database. int ONE_DAY_SAMPLE_AGE The maximum time in seconds for retaining records in the PM stats 1day sample tables (TIME_SERIES_DATA_1_1DAY, TIME_SERIES_DATA_2_1DAY) in database. int POLICY_TYPE Type of the aging policy. 100 is Default aging; 101 is Raw samples to 1 day.
H Database tables and fields TABLE 292 PM_WIDGET_TIME_SERIES_ENTRY (Continued) Field Definition Format TARGET_TYPE 0 - Device 1 - Port smallint TARGET_ID Stores device ID if taret_TYPE is Device, or interface DB ID if target TYPE is port. int MEASURE_ID Measure table DB ID. int MEASURE_INDEX Index value for a MIB variable. For scalar value it will be empty. varchar 256 Size TABLE 293 PM_WIDGET_TOP_N_COLLECTOR_ENTRY Field Definition Format WIDGET_ID The ID of the widget definition.
H Database tables and fields TABLE 295 Definition Format CONDITION Condition like ><= to the defined threshold value at which threshold is triggered • 0 > (Greater Than) • 1 >= (Greater Than or Equal) • 2 < (Less Than) • 3 < = (Less Than or Equal) • 4 = (Equal to) • 5 != (Not Equal To) smallint SEVERITY Severity level of defined threshold on port and product Poe measures. int TABLE 296 Size POE_THRESHOLD_EVENT Field Definition Format ID Unique generated database identifier.
H Database tables and fields TABLE 299 PORT_BOTTLENECK_CONFIG Field Definition Format SWITCH_PORT_ID The database ID of the switch port that the configuration belongs to. int BOTTLENECK_DETECT _ENABLED Flag indicates if bottleneck detection is enabled or not. The default value is 0. smallint ALERTS_ENABLED Flag indicates if bottleneck detection alerts is enabled or not.The default value is -1. smallint CONGESTION_ THRESHOLD Value of bottleneck detection congestion threshold in percent.
H Database tables and fields TABLE 301 Definition Format Size PASSWORD Password to be used for authenticating. Stored in encrypted format. varchar 512 STATUS Status before and after contacting the CIMOM Server. Possible values are 0 - OK, 1- Not Contacted Yet , 2 - Credentials Updated, 3 - Credentials Failed, 4 - Not Reachable. int LAST_CONTACTED_TIME Last time CIMOM server contacted.
H Database tables and fields TABLE 303 PORT_FENCING_POLICY_MAP (Continued) Field Definition Format Size SUB_LEVEL • • • char 23 NODE WWN of Node which policy assigned. char 23 Directly assigned or inherited from root level.
H Database tables and fields TABLE 305 Definition Format Size NAME Name of the port profile domain. varchar 255 DEFAULT_DOMAIN This flag determines if this domain is a default domain. 0 - NO 1 - YES smallint TABLE 306 PORT_PROFILE_DOMAIN_MAP Field Definition Format PROFILE_DOMAIN_ID Foreign Key Reference to ID field of PORT_PROFILE_DOMAIN table. int PROFILE_ID Foreign Key Reference to ID field of PORT_PROFILE table.
H Database tables and fields TABLE 309 PORT_PROFILE_QOS_MAP Field Definition Format Size TRAFFIC_CLASS Name of the traffic class map set in the NON DCB mode varchar 256 CEE_MAP Name of the cee map set in the DCB mode varchar 256 COS Default COS value for QoS Profile can range from 0-7 if set int TRUST_COS Is trust cos enabled 0=NO 1=YES smallint TABLE 310 PORT_PROFILE_QOS_PFC_MAP Field Definition Format ID Auto generated id for the created profile int PROFILE_ID DB id of the p
H Database tables and fields TABLE 311 Definition Format MAC_GROUP_DB_ID Nullable Foreign Key Reference to ID field of MAC_GROUP table. In case of VLAN_TYPE 3, MAC_GROUP table entry created with empty GROUP_ID with TYPE 3 and MAC_GROUP_MEMBER have the mac address details. In case of VLAN_TYPE 4, MAC_GROUP table entry created with valid GROUP_ID and TYPE(3). int CTAG_ID This will be populated only if VLAN_TYPE is 6 and 7.
H Database tables and fields TABLE 312 PORT_VLAN (Continued) Field Definition Format PRIMARY_VLAN_ID Private VLAN domain is built with one primary VLAN and one or more secondary VLANs. This column represents primary VLAN ID associated with this secondary Isolated/Community VLAN (if PVLAN_TYPE column value is 2 or 3) in private VLAN domain. For primary VLAN (if PVLAN_TYPE column value is 1) in private VLAN domain and normal VLAN (if PVLAN_TYPE column value is 0) , then default value (i.
H Database tables and fields TABLE 315 Field Definition Format VLAN_DB_ID Database ID of the VLAN instance which is associated with the protocol. int PROTOCOL Protocol for VLAN. Possible values are 1-IP, 2-IPX, 3-AppleTalk, 4-DECnet, 5-NetBIOS, 6-Other and 7-IPv6. num (4,0) TABLE 316 Size QRTZ_BLOB_TRIGGERS Field Definition Format Size TRIGGER_NAME* Name of the trigger. varchar 200 TRIGGER_GROUP* Name of the trigger group. varchar 200 BLOB_DATA The Scheduler info.
H Database tables and fields TABLE 319 QRTZ_FIRED_TRIGGERS (Continued) Field Definition Format size JOB_NAME Name of the job. varchar 200 JOB_GROUP Name of the job group. varchar 200 IS_STATEFUL Whether the job implements the interface StatefulJob. boolean REQUESTS_RECOVERY True or false. boolean SCHED_NAME DCMScheduler. bigint TABLE 320 QRTZ_JOB_DETAILS Field Definition Format Size JOB_NAME* Name of the job. varchar 200 JOB_GROUP* Name of the job group.
H Database tables and fields TABLE 323 QRTZ_PAUSED_TRIGGER_GRPS Field Definition Format Size TRIGGER_GROUP* Name of the trigger group. varchar 200 SCHED_NAME DCMScheduler. varchar 120 TABLE 324 QRTZ_SCHEDULER_STATE Field Definition Format Size INSTANCE_NAME* Instance of the scheduler. varchar 200 LAST_CHECKIN_TIME Last fired time in milliseconds. bigint CHECKIN_INTERVAL Repeat interval. bigint RECOVERER Misfire instruction. varchar 80 SCHED_NAME DCMScheduler.
H Database tables and fields TABLE 327 QRTZ_JTRIGGER_LISTENERS Field Definition Format Size TRIGGER_NAME* Name of the trigger. varchar 80 TRIGGER_GROUP* Name of the trigger group. varchar 80 TRIGGER_LISTENER* The listener action. varchar 80 TABLE 328 QRTZ_TRIGGERS Field Definition Format Size TRIGGER_NAME* Name of the trigger. varchar 200 TRIGGER_GROUP* Name of the trigger group. varchar 200 JOB_NAME Name of the job. varchar 200 JOB_GROUP Name of the job group.
H Database tables and fields TABLE 330 Definition Format ENCRYPTION_GROUP_ID Foreign key reference to the ENCRYPTION_GROUP for which an authorization card is registered. int SMART_CARD_ID Foreign key reference to the SMART_CARD that is registered as an authorization card for the encryption group. int TABLE 331 Size RAS_LOG Field Definition Format Size MSG_ID* Message ID of the event. varchar 15 MODULE_ID Module ID of the event. varchar 10 SEVERITY Severity of the event.
H Database tables and fields TABLE 335 REPORT_TEMPLATE Field Definition Format ID The primary key of the table. int NAME Name of the report and the report names must be descriptive. For example, Wired Device Report. varchar 256 TITLE The title of the report that briefly describes the report contents. This title will also be used for the report header and menu item. Title should be unique. For example, Wired Products List. varchar 256 CREATED_TIME Timestamp of when the report was created.
H Database tables and fields TABLE 338 Field Definition Format RESOURCE_GROUP_ID* Resource group ID. int FABRIC_ID* Fabric ID, which is in the resource group. int TABLE 339 Size RESOURCE_GROUP Field Definition Format ID* Unique generated database identifier. int NAME Resource group name. varchar 128 DESCRIPTION Resource group description.
H Database tables and fields TABLE 344 RULE_CONDITION_MAP Field Definition Format POLICY_RULE_ID Foreign key reference to POLICY_RULE.ID. int CONFIG_CONDITION_ID Foreign key reference to CONFIG_CONDITION.ID. int TABLE 345 RULE_LOGICAL_EXPRESSION_MAP Field Definition Format POLICY_RULE_ID Policy rule ID. int LOGICAL_EXPRESSION_XM L Configuration Rule Logical Expression XML. text TABLE 346 Size Size SAN Field Definition Format ID* Unique generated database identifier.
H Database tables and fields TABLE 347 SAN_CONNECTION (Continued) Field Format Size DESTINATION_USER_PORT_ User port number of F-port NUMBER smallint FABRIC_ID Foreign key to FABRIC table int TRUSTED Indicates if the connection is trusted smallint MISSING Indicates if the connection is missing smallint MISSING_TIME Timestamp when the connection went missing timestamp LAST_UPDATE_TIME Last update time for this record timestamp CREATION_TIME Creation timestamp timestamp Field Defin
H Database tables and fields TABLE 349 SECURITY_POLICY (Continued) Field Definition Format DIFFIE_HELLMAN_GROUP Diffie-Hellman Group used in PFS negotiation. smallint SECURITY_ASSOC_LIFE Association lifetime in seconds. double precision SECURITY_ASSOC_LIFE_ IN_MB Security association lifetime in megabytes. double precision TABLE 350 SELECTED_FLYOVER_PROPERTY Field Definition Format PROPERTY_ID* Refers to Flyover_Property ID from AVAILABLE_FLYOVER_PROPERTY table.
H Database tables and fields TABLE 351 Definition Format Size SERIAL_NUMBER provides the serial number of the sensor, requested by SMIA and values filled in by Switch Asset Collector will be available only from FOS 6.4 switches and above varchar 64 VERSION provides the version of the sensor, requested by SMIA and values filled in by Switch Asset Collector will be available only from FOS 6.
H Database tables and fields TABLE 353 SFLOW_HOUR_SUMMARY Field Definition Format OUT_UNIT Unit number of the outgoing traffic interface. Default value is 0. smallint OUT_SLOT Slot number of the outgoing traffic interface. smallint OUT_PORT Port number of the outgoing traffic interface. smallint IN_VLAN Vlan ID of the incoming traffic interface. smallint OUT_VLAN Vlan ID of the outgoing traffic interface. smallint IN_PRIORITY Priority ID of the incoming traffic interface.
H Database tables and fields TABLE 353 Definition Format BYTES Number of bytes transmitted through the sFlow sample collected. bigint TCP_FLAGS TCP flag value of the received sFlow packet. smallint IN_PORT_TYPE smallint This column is used to store the port type of the incoming traffic interface. For VCS switch the value of • 0 means its edge port. • 1 means its trill port. For other devices Default value is 0.
H Database tables and fields TABLE 355 SFLOW_MINUTE_BGP (Continued) Field Definition Format IN_PORT_TYPE Port type of the incoming traffic interface. For VCS member the value of, • 0 means its edge port. • 1 means its fabric port. For other devices Default value is 0. smallint OUT_PORT_TYPE Port type of the outgoing traffic interface. For VCS member the value of, • 0 means its edge port • 1 means its fabric port. For other devices Default value is 0.
H Database tables and fields TABLE 358 Definition Format OUT_PORT_TYPE Port type of the outgoing traffic interface. For VCS member the value of, • 0 means its edge port • 1 means its fabric port. For other devices Default value is 0 smallint L3_SRC_ADDR This column is used to store the L3 address of the source in the received sFlow packet. bytea L3_DEST_ADDR This column is used to store the L3 address of the destination in the received sFlow packet.
H Database tables and fields TABLE 361 SFLOW_MINUTE_VLAN (Continued) Field Definition Format BYTES Number of bytes transmitted through the sFlow sample collected. bigint IN_VLAN Vlan ID of the incoming traffic interface. smallint OUT_VLAN Vlan ID of the outgoing traffic interface. smallint IN_PORT_TYPE Port type of the incoming traffic interface. For VCS member the value of, • 0 means its edge port. • 1 means its fabric port. For other devices Default value is 0.
H Database tables and fields TABLE 365 1680 SFLOW_STAGING (Continued) Field Definition Format IN_UNIT Unit number of the incoming traffic interface. Default value is 0. smallint IN_SLOT Slot number of the incoming traffic interface. smallint IN_PORT Port number of the incoming traffic interface. smallint OUT_UNIT Unit number of the outgoing traffic interface. Default value is 0. smallint OUT_SLOT Slot number of the outgoing traffic interface.
H Database tables and fields TABLE 365 SFLOW_STAGING (Continued) Field Definition Format DEST_USER Name of the destination user in the received sFlow packet. int FRAMES Number of frames transmitted through the sflow sample collected. bigint BYTES Number of bytes transmitted through the sflow sample collected. bigint TCP_FLAGS Tcp flag value of the received sFlow packet. smallint IN_PORT_TYPE This column is used to store the port type of the incoming traffic interface.
H Database tables and fields TABLE 367 SMART_CARD (Continued) Field Definition Format Size GROUP_NAME The name of the Encryption Group used to initialize the card. For recovery set cards, this identifies which group''s master key is backed up on the card. varchar 64 CREATION_TIME The date and time that the card was initialized. For recovery set cards, this is the date and time the master key was written to the card. The default value is 'now()'.
H Database tables and fields TABLE 370 SNMP_CREDENTIALS (Continued) Field Definition Format TIMEOUT Timeout value in seconds for a get/set request to the SNMP agent. Default value is 5. smallint VERSION SNMP agent version running on the switch, as in SNMPv1 or SNMPv3. varchar 6 READ_COMMUNITY_ STRING The SNMP Read-Only Community String is like a password. It is sent along with each SNMP Get-Request and allows (or denies) access to a device. The default value is "public".
H Database tables and fields TABLE 371 SNMP_DATA (Continued) Field Definition Format Size TARGET_TYPE Target type of the SNMP collector data. The target type for, • device level collector is 0 • port level collector it is 1. num (2,0) TARGET_ID Target id of the SNMP collector data. for device level collector it will use deviceId, and for port level it will use interfaceId. int VALUE Value of the OID retrieved from the corresponding target.
H Database tables and fields TABLE 374 SNMP_DATA_30MIN Field Definition Format ID Primary key autogenerated ID int MIB_OBJECT_ID MIB OID used for collection int Target or source type can be, device - 0 or interface or ports - 1 num TARGET_ID DB Id of the target which can be device or interface int VALUE Value collected by the engine double precision TIME_IN_SECONDS Time at which collection occured in seconds int COLLECTOR_ID DB Id of the collector object used for collection int MI
H Database tables and fields TABLE 376 Definition Format TIME_IN_SECONDS Time, in seconds, at which the record was inserted in seconds. int COLLECTOR_ID DB ID of the collector object used for collection.
H Database tables and fields TABLE 379 SNMP_PROFILE (Continued) Field Definition Format Size VERSION SNMP agent version running on the switch as in SNMPv1 and SNMPv3 varchar 6 READ_COMMUNITY_STRING The SNMP Read-Only Community String is like a password. It is sent along with each SNMP Get-Request and allows (or denies) access to device. The default value is "public". This is applicable if the agent is configured to operate in SNMPv1.
H Database tables and fields TABLE 380 SNMP_TRAP_CREDENTIAL Field Definition Format ID PK for the table to uniquely identify the record int VERSION to identify the version of Credentials: v1v2c and v3 are the values varchar 6 COMMUNITY_STRING to decode the v1/v2c traps varchar 64 USER_NAME user access name for v3 trap varchar 64 AUTH_PROTOCOL authentication protocol used for v3 traps varchar 16 AUTH_PASSWORD authentication password for v3 traps varchar 64 PRIV_PROTOCOL privacy
H Database tables and fields TABLE 383 SSL_CERTIFICATE (Continued) Field Definition Format Size EXPIRATION_TIME num (20,0) FORMAT num (2,0) DESCRIPTION varchar 1024 NOTIFICATION_TIME The time stamp (long format) of the last expiration notification sent num (20,0) NOTIFICATION_SENT The status of last notification sent.
H Database tables and fields TABLE 385 Definition Format private_key Content of the private key. txt USER_ID This field will be populated when the Management application user creates certificate or import certificates from file. User can view this certificate not bound to any vip in SSL certificate dialog. int TABLE 386 Size SSL_KEY_PASSWORD Field Definition Format ID Unique generated database identifier.
H Database tables and fields TABLE 388 STP_PORT Field Definition Format INTERFACE_ID Foreign Key Reference to INTERFACE table int PATH_COST Port Path Cost. bigint PRIORITY Port Priority. bigint LINK_TYPE Link Type. 1- Shared 2 - P2P. numeric (1,0) PORT_FAST Port Fast. 0 - Disabled 1 - Enabled numeric (1,0) BPDU_FILTER BPDU Filter. 0 - Disabled 1 - Enabled numeric (1,0) BPDU_GUARD BPDU guard. 0 - Disabled 1 - Enabled numeric (1,0) EDGE_PORT Edge port.
H Database tables and fields TABLE 389 STP_INSTANCE (Continued) Field Definition Format RE_ENABLE_PORT_INTERV AL FOS/NOS Field. Re enable port interval. int RE_ENABLE_PORT_STATE FOS/NOS Field. Re enable port state. smallint PATH_COST 1692 bigint STP Possible values: • 0 - Disabled • 1 - Enabled smallint CISCO_INTER_OP Cisco Interoperability Enabled/Disabled. num TX_HOLD_COUNT Transmit HoldCount of the Bridge smallint MAX_HOPS MST max hop count (1-40) smallint REGION MST Region.
H Database tables and fields TABLE 391 SWITCH_CONFIG Field Definition ID* Format Size int NAME Name of the switch configurations uploaded from the switch either on demand or through scheduler varchar SWITCH_ID ID of the switch from which the configuration has been uploaded. int CORE_SWITCH_ID 64 int BACKUP_DATE_TIME The date/time stamp at which the configuration has been uploaded. timestamp CONFIG_DATA The actual switch configuration data.
H Database tables and fields TABLE 392 Definition Format BACKUP_TYPE The operation based on which this configuration was retrieved -1 - NOT AVAILABLE 0 - IMPORTED 1 - DISCOVERY 2 - RESYNC 3 - MANUAL 4 - SCHEDULE int DRIFT_STATUS Indicates if the current switch configuration has deviated from the baseline configuration. -1 - NO_BASELINE 0 - NO_DEVIATION 1 - DEVIATED int TABLE 393 Size SWITCH_LICENSE Field Definition Format ID* Unique generated database identifier.
H Database tables and fields TABLE 395 SWITCH_PORT Field Definition Format ID* Unique generated database identifier. int VIRTUAL_SWITCH_ID DB ID of virtual_switch to which this port belongs. int WWN WWN of the port. char 23 NAME User friendly name of the port. char 32 SLOT_NUMBER Slot number. Default value is 0. int PORT_NUMBER The logical port number of the user port. There is no assumption of any relation to the physical location of a port within a chassis.
H Database tables and fields TABLE 395 1696 SWITCH_PORT (Continued) Field Definition Format Size ESTIMATED_DISTANCE The estimated physical distance of the connection between ports. int ACTUAL_DISTANCE The physical distance of the connection on the port in relation to the other port. int LONG_DISTANCE_SETTING Whether long distance enabled. int DEGRADED_PORT Denotes if the port is in a degraded state. Has value as N/A for ports that are not online.
H Database tables and fields TABLE 395 SWITCH_PORT (Continued) Field Definition Format Size USER_DEFINED_VALUE2 User defined value used for annotation. varchar 256 USER_DEFINED_VALUE3 User defined value used for annotation. varchar 256 KIND Stores the port kind from the NVP portKind. varchar 32 STATE The state of the port whether it is online or offline varchar 64 PREVIOUS_STATUS This table can hold the same values as STATUS column.
H Database tables and fields TABLE 395 1698 SWITCH_PORT (Continued) Field Definition Format MAX_FRAME_MONITOR Maximum frame monitor supported for switch port. int MAX_FRAME_MONITOR_OF FSET Maximum offset supported in fame monitor for switch port. int Contains the features supported as a bit mask at port level. int IDENTIFIER Switch port identifier extracted from interface name char PORT_CAPABILITIES 'List of capabilities of this port specified as bit mask.
H Database tables and fields TABLE 395 SWITCH_PORT (Continued) Field Definition Format SPEED_TYPE Stores the speed type of the port. It contains one of the following values: • 1 - Indicates speed is in Mbps. • 2 - Indicates speed is in Gbps. int EXT_TYPE Refers to the extended type of the port . Eg Mirror-Port. varchar 128 Size TABLE 396 Size SWITCH_PORT_PERFORMANCE Field Definition Format PORT_ID Primary key of the Switch Port.
H Database tables and fields TABLE 396 Definition Format INVALID_TRANSMISSIONS Count of invalid transmission words received at this port. This count is part of the Link Error Status Block (LESB). FC-PH 29.8). Note, this is a Fibre Channel only stat double precision CRC_ERRORS Count of frames received with invalid CRC. This count is part of the Link Error Status Block (LESB). (FC-PH 29.8). Loop ports should not count CRC errors passing through when monitoring.
H Database tables and fields TABLE 400 TARGET_TYPE Field Definition Format ID Unique generated database identifier. serial TYPE Type of the target device. Some possible values are • Switch • Device • Port • Host • Port Group • Product Group • VLAN • Fabric varchar 64 Size TABLE 401 Size THIRD_PARTY_DEVICE Field Definition Format DEVICE_ID Primary key for this table. int DEVICE_TYPE Type of the third party device.
H Database tables and fields TABLE 404 Definition Format MEASURE_ID ID of the measure. int TARGET_ID Target ID of the PM collector data. For device level collector it will use deviceId, for port level it will use interfaceId. int COLLECTOR_ID ID of the data_collector. int MEASURE_INDEX 'Stores the index_map value in case of anexpression. varchar ME_ID ME_ID of the target. int VALUE 30 mins aggregated data.
H Database tables and fields TABLE 407 \ TIME_SERIES_DATA_30MIN Field Definition Format TIME_IN_SECONDS Time when the record is inserted. int TARGET_TYPE Target type of the PM collector data. For device level collector the target type is 0, for port level it is 1. smallint MEASURE_ID ID of the measure. int TARGET_ID Target ID of the PM collector data. For device level collector it will use deviceId, for port level it will use interfaceId. int COLLECTOR_ID ID of the data_collector.
H Database tables and fields TABLE 409 Field Definition Format TIME_IN_SECONDS Time when value of the measure retrieved from the corresponding target. int TARGET_TYPE Target type of the PM collector data. For IP_DEVICE(0), IP_PORT(1), IP_TRUNK(2), FOS_DEVICE(3), FC_PORT(4), GE_PORT(5), TE_PORT(6), HBA_PORT(7), CNA_PORT(8), VIRTUAL_FCOE_PORT(9), FCIP_TUNNEL(10), EE_MONITOR(11), IP_DEVICE_GROUP(12), IP_PORT_GROUP(13), VIRTUAL_GROUP(14), TRILL_TRUNK(15), ALL_SAN_PRODUCTS(16).
H Database tables and fields TABLE 410 TIME_SERIES_DATA_1_2HOUR (Continued) Field Definition Format VALUE Stores the 2 hours aggregated data. double precision MIN_VALUE Minimum value in 30 min table while aggregating 2 hours of data. double precision MAX_VALUE Maximum value in 30 min table while aggregating 2 hours of data. double precision TABLE 411 TIME_SERIES_DATA_1_30MIN Field Definition Format TIME_IN_SECONDS Time when value of the measure retrieved from the corresponding target.
H Database tables and fields TABLE 412 Definition Format MEASURE_ID ID of the measure (MIB/Expression). int TARGET_ID Target ID of the PM collector data. For device level collector it will use deviceId/virtualSwitchId, for port level it will use interfaceId/switchPortId/ fcipTunnelId/devicePortId. int COLLECTOR_ID DB ID of the pm_data_collector. int MEASURE_INDEX Stores the index_map value in case of an expression. varchar ME_ID ME_ID of the target.
H Database tables and fields TABLE 414 TIME_SERIES_DATA_2_2HOUR Field Definition Format TIME_IN_SECONDS Time when value of the measure retrieved from the corresponding target. int TARGET_TYPE Target type of the PM collector data.
H Database tables and fields TABLE 415 Definition Format VALUE Stores the 30 minutes aggregated data. double precision MIN_VALUE Minimum value in raw performance statistics table while aggregating 30 minutes of data. double precision MAX_VALUE Maximum value in raw performance statistics table while aggregating 30 minutes of data.
H Database tables and fields TABLE 417 TIME_SERIES_DATA_3_1DAY (Continued) Field Definition Format MIN_VALUE Minimum value in 2 hour table while aggregating 1 day data. double precision MAX_VALUE Maximum value in 2 hour table while aggregating 1 day data. double precision SUM_VALUE Named after SUM_VALUE to be consistent with column names in aggregated data tables.Stores the delta changes for counter values between two samples, only used for counter values, 0 for all other types of measures.
H Database tables and fields TABLE 419 Definition Format TARGET_ID Target ID of the PM collector data. For device level collector it will use deviceId/virtualSwitchId, for port level it will use interfaceId/switchPortId/ fcipTunnelId/devicePortId. int COLLECTOR_ID DB ID of the pm_data_collector. int MEASURE_INDEX Stores the index_map value in case of an expression. varchar ME_ID ME_ID of the target. int VALUE Stores the 30 minutes aggregated data.
H Database tables and fields TABLE 421 TIME_SERIES_DATA_4_1DAY Field Definition Format TIME_IN_SECONDS Time when value of the measure retrieved from the corresponding target. int TARGET_TYPE Target type of the PM collector data. smallint MEASURE_ID ID of the measure (MIB/Expression). int TARGET_ID Target ID of the PM collector data. For device level collector it will use deviceId/virtualSwitchId, for port level it will use interfaceId/switchPortId/ fcipTunnelId/devicePortId.
H Database tables and fields TABLE 422 Definition Format MAX_VALUE Maximum value in 30 min table while aggregating 2 hours of data. double precision SUM_VALUE Named after SUM_VALUE to be consistent with column names in aggregated data tables.Stores the delta changes for counter values between two samples, only used for counter values, 0 for all other types of measures.
H Database tables and fields TABLE 424 TIME_SERIES_DATA_5 (Continued) Field Definition Format MEASURE_ID ID of the measure (MIB/Expression). int TARGET_ID Target ID of the PM collector data. For device level collector it will use deviceId/virtualSwitchId, for port level it will use interfaceId/switchPortId/ fcipTunnelId/devicePortId. int COLLECTOR_ID DB ID of the pm_data_collector. int MEASURE_INDEX Stores the index_map value in case of an expression. varchar ME_ID ME_ID of the target.
H Database tables and fields TABLE 426 Field Definition Format Size TOOL_MENU_TEXT* Text to be displayed for the Tool Menu. varchar 256 TOOL_ID A Tool in the TOOL_PATH table where the tools are defined. int PARAMETERS Default path for launching the tool. varchar 256 KEY_STROKE Short cut key stroke to the application. varchar 30 Field Definition Format Size ID* Unique generated database identifier. int TOOL_NAME Name of the tool.
H Database tables and fields TABLE 429 TRILL Field Definition Format TRUNKED Is this trill link part of a trunk smallint CREATION_TIME Time when the TRILL link record is created between source and destination. timestamp MISSING Is this trill link was discovered and is now missing smallint MISSING_TIME Time when the TRILL link is missing from the switch.
H Database tables and fields TABLE 434 USER_ Field Definition Format Size ID * Unique generated database identifier. int NAME User name. varchar 128 DESCRIPTION User description. varchar 512 PASSWORD User password. varchar 512 EMAIL User e-mail ID. varchar 1024 NOTIFICATION_ENABLED Flag for e-mail notification. Default value is 0. smallint FULL_NAME User’'s Full Name. varchar 512 PHONE_NUMBER User’'s Phone number.
H Database tables and fields TABLE 436 USER_DEFINED_DEVICE_DETAIL Field Definition Format Size WWN WWN of the device. char 23 NAME 'Name of the device which is updated by the user. varchar 256 TYPE Type of the device (Initiator or Target. varchar 32 IP_ADDRESS IP address of the device which is updated by the user. varchar 63 CONTACT Contact detail of the device which is updated by the user. varchar 256 LOCATION Location of the device which is updated by the user.
H Database tables and fields TABLE 439 Field Definition Format Size USER_NAME * User name whose preferences are saved. It corresponds to user_name in USER_table. varchar 128 CATEGORY * The name for a set of related preferences. varchar 128 CONTENT The set of preferences saved as name-value pairs. text TABLE 440 USER_REALTIME_MEASURE_MAPPING Field Definition Format ID Primary Key. int USER_ID Foreign key reference to the user_ Table.
H Database tables and fields TABLE 444 USER_STATE_MAP Field Definition USER_NAME STATE Current user state.
H Database tables and fields TABLE 447 VCN_MEMBER Field Definition Format Cluster deployment state: Deployed(0) Undeployed(1). smallint Device id foreign key. int Field Definition Format VCN_PEER_ID Virtual Cluster Node Peer db id. int IP_ADDRESS Peer ip address. varchar RBRIDGE_ID Peer rbridge id. int ICL_NAME Cluster ICL name used for this peer. varchar Cluster Peer fast failover state: Disabled(0) Enabled(1).
H Database tables and fields TABLE 449 VCS_CLUSTER_MEMBER (Continued) Field Definition Format Size STATE Indicates the state of the member with respect to cluster. States can be Online, Offline, Rejoining etc. varchar 64 FABRIC_STATUS Stores the fabric level status of the node like Unknown and Online. Status is unknown when: • A node is going through a reboot or ISLs have not formed yet. • A node is not part of a cluster yet. Status is Online when: • A node is waiting to rejoin a cluster.
H Database tables and fields TABLE 451 VIP_SERVER (Continued) Field Definition Format Size IP_ADDRESS The IP Address for the Virtual Server or Real Server varchar 128 NAME The Name of Virtual Server or Real Server varchar 256 TABLE 452 VIP_SERVER_BINDING Field Definition Format ID Primary Key field for the VIP_SERVER_BINDING int DEVICE_ID This is the foreign key reference key to the Device Table int The IP Address for the Virtual Server varchar The Port number of the Virtual Ser
H Database tables and fields TABLE 454 VIRTUAL_FCOE_PORT (Continued) Field Definition Format DEVICE_COUNT The number of devices associated with this Virtual FCoE Port. The default value is 0. smallint PEER_MAC The Peer FCF MAC if this Virtual FCoE Port is a FCoE VE-port varchar TABLE 455 Size VIRTUAL_FCOE_PORT_MAC_MEMBER Field Definition Format VIRTUAL_FCOE_PORT_ID The unique id of virtual fcoe port the member belongs to int MAC_ADDRESS Mac address of member.
H Database tables and fields TABLE 456 Definition Format INVALID_TX Invalid transmissions double precision CRC_ERRORS Cyclic Redundancy check error double precision TABLE 457 Size VIRTUAL_PORT_WWN_DETAILS Field Definition ID Unique generated database identifier. SWITCH_ID If the VPWWN is constructed based on AG Node WWN and AG_Port_Index then this is id of connected switch. int SWITCH_PORT_NUMBER If the VPWWN is configured for AG , this value will have the default value(-1).
H Database tables and fields TABLE 458 VIRTUAL_SWITCH (Continued) Field Definition Format Stores the switch mode. 0 is switch mode 2 is ag mode. smallint ROLE Stores the role of the switch like Primary, Subordinate, Cluster etc. varchar 32 FCS_ROLE FCS role for the Switch . This is used only when FCS policy is turned on. varchar 16 Stores the switch capability for Admin domain. 1 is capable 0 is not capable. smallint FABRIC_IDID_MODE Denotes if Insistent Domain ID mode is enabled.
H Database tables and fields TABLE 458 VIRTUAL_SWITCH (Continued) Field Definition Format Stores the switch capability for FCR support . 1 is capable 0 is not capable. smallint Stores the switch capability for FCIP support . 1 is capable 0 is not capable. smallint FCOE_CAPABLE If the switch supports FCoE. Default value is 0. smallint L2_CAPABLE If the switch supports L2. smallint L3_CAPABLE If the switch supports L3.
H Database tables and fields TABLE 458 VIRTUAL_SWITCH (Continued) Field Definition Format FCIP_CIRCUIT_CAPABLE Whether the switch can create FCIP Circuits. 1 means true and 0 means false. Default value is 0. smallint DISCOVERED_PORT_COUN T Reflects the number of managed ports in the discovered switch. Default value is 0. smallint LAST_PORT_MEMBERSHIP _CHANGE Stores the timestamp of the last port member ship update.
H Database tables and fields TABLE 458 1728 VIRTUAL_SWITCH (Continued) Field Definition Format CLUSTER_TYPE This column is used to determine whether VCS is in Fabric Cluster or Logical Chassis. The values are populated by the VCS collector during the discovery of the VCS switch. The default value -1 means that its a non-VCS device.
H Database tables and fields TABLE 459 VIRTUAL_SWITCH_CAPABILITY Field Definition Format VIRTUAL-SWITCH_ID * DB ID of virtual switch. int CAPABILITY_ * Name of capability detected on virtual switch. varchar ENABLED 1 = the capability is enabled on the virtual switch. int TABLE 460 Size 256 VIRTUAL_SWITCH_CHECKSUM Field Definition Format VIRTUAL_SWITCH_ID * DB ID of virtual switch. int CHECKSUM_KEY * Checksum key. varchar 32 CHECKSUM Checksum value.
H Database tables and fields TABLE 465 Field Definition Format VLAN_INTERFACE_RELATION_ID Database ID of the VLAN_INTERFACE_RELATION instance which is associated with the interface member. int TABLE 466 Definition Format VLAN_INTERFACE_RELATION_ID Unique database generated identifier. int VLAN_DB_ID Database ID of the VLAN instance which is associated with the interface. int INTERFACE_ID Database ID of the INTERFACE instance which is associated with the vlan.
H Database tables and fields TABLE 471 VLL_ENDPOINT_RELATION Field Definition Format MPLS_SERVICE_ENDPOINT_REL ATION_DB_ID Database ID inherited from MPLS_SERVICE_ENDPOINT_RELATION. int PW_ENET_PW_INSTANCE Represents the Index of Ethernet tables associated with this endpoint Instance. int COS This value indicates the Class Of Service for this smallint endpoint. For VLL, this value is used to select the appropriate tunnel whose COS value is either same, or almost approaching this value.
H Database tables and fields TABLE 472 Definition Format STATUS VMotion event status. 0 = info, 1 = warning, 2 = failed. smallint DRS_TRIGGERED Identifies whether the events was due to DRS. 0 = No, 1 = Yes. smallint USER_NAME Identifies that user who initiated the vmotion. varchar 80 DESCRIPTION Event message that is received.
H Database tables and fields TABLE 475 VM_DATASTORE_DETAILS Field Definition Format Size NAME Name of the datastore. varchar 256 ACCESSIBLE The connectivity status of this datastore. If this is set to false, meaning the datastore is not accessible, this datastores capacity and freespace properties cannot be validated. 0 = no 1 = yes. smallint STATUS Status of the datastore could be normal, enteringMaintenance, inMaintenance.
H Database tables and fields TABLE 476 Definition Format CONFLICT Whether the port is a conflict port. A port could be marked as conflict if an entity is discovered connecting to a port that is already occupied, or if the port is created by the host without conferring with Virtual Center Server. A conflict port will not have its runtime state persisted and the port can''t move away from the host, i.
H Database tables and fields TABLE 477 VM_DV_PORT_GROUP (Continued) Field Definition Format Size DESCRIPTION A description string of the portgroup varchar 256 UPLINK_PORT_GROUP Whether this portgroup is an uplink portgroup smallint KEY The key for the port group varchar MOR_ID The managed object reference number assigned by the hypervisor int TABLE 478 64 VM_DV_SWITCH Field Definition Format ID Unique generated database identifier. serial UUID The generated UUID of the switch.
H Database tables and fields TABLE 478 Definition Format DVS_OPER_SUPPORTED Whether this switch allow Virtual Center users to modify DVS configuration at switch level, except for host memeber, policy and scope operations smallint CREATION_TIME The create time of the switch timestamp UPLINK_PORT_NAME The uniform name of uplink ports on each host varchar VM_DATA_CENTER_ID A foreign key referencing VM_DATACENTER table instance to which this host is associated with int MOR_ID The managed objec
H Database tables and fields TABLE 480 VM_FC_HBA (Continued) Field Definition Format The type of the fiber channel port. One of : Fabric Loop Point to point Unknown smallint SPEED The current operating speed of the adapter in bits per second.
H Database tables and fields TABLE 482 VM_HOST (Continued) Field Definition Format Size CPU_TYPE Text summary of CPU hardware, such as: Intel(R) Xeon(TM) CPU 2.6 GHz varchar 64 CPU_RESOURCES Text summary of CPU resources, such as "20 GHz total, 15 GHz reserved". May be a different format for different VM vendors varchar 64 MEM_RESOURCES Text summary of memory resources, such as "7 GB total, 5 GB reserved".
H Database tables and fields TABLE 484 VM_HOST_PROXY_SWITCH (Continued) Field Definition Format Size DVS_NAME The name of the DistributedVirtualSwitch that the HostProxySwitch is part of varchar 256 DVS_UUID The uuid of the DistributedVirtualSwitch that the HostProxySwitch is a part of varchar 256 KEY_ The proxy switch key varchar 256 NUM_PORTS The number of ports that this switch currently has int NUM_PORTS_AVAILABLE The number of ports that are available on this virtual switch int
H Database tables and fields TABLE 486 Definition Format VM_DV_PORT_ID Foreign key to the vm_dv_port table. DV Port with which this vmknic is associated int MTU The MTU of the port int VM_HOST_ID FOREIGN KEY to the vm_host table int MOR_ID The managed object reference number assigned by the hypervisor int PORT_GROUP_KEY The key for the port group varchar BINARY_MAC MAC address in binary format. bytea BINARY_IP IP address in binary format.
H Database tables and fields TABLE 488 VM_NIC_TEAMING_POLICY (Continued) Field Definition Format REVERSE_POLICY The flag to indicate whether or not the teaming policy is applied to inbound frames as well. For example, if the policy is explicit failover, a broadcast request goes through uplink1 and comes back through uplink2. Then if the reverse policy is set, the frame is dropped when it is received from uplink2. This reverse policy is useful to prevent the virtual machine from getting reflections.
H Database tables and fields TABLE 489 Definition Format FABRIC_ID Identifies the fabric that contains this path. Not a foreign key reference. Copied here for convenience. Determined by locating the HBA port WWN or target port WWN in the DEVICE_PORT table. Zero if the fabric is not managed. The default value is 0. int HBA_PORT The HBAs physical port WWN for this path char 23 VM_PORT_WWN The initiator port WWN used by the VM.
H Database tables and fields TABLE 490 VM_PHYSICAL_NIC (Continued) Field Definition Format DUPLEX The flag to indicate whether or not the link is capable of full-duplex ("true") or only half-duplex ("false"). smallint MAC_ADDRESS The media access control (MAC) address of the physical network adapter. varchar 17 PCI Device hash of the PCI device corresponding to this physical network adapter. varchar 256 WAKE_ON_LAN_SUPPO RTED Flag indicating whether the NIC is wake-on-LAN capable.
H Database tables and fields TABLE 492 Field Definition Format ID Unique generated database identifier. serial NAME The name of the virtual switch. varchar PORTS_COUNT The number of ports that this virtual switch currently has. int PORTS_AVAILABLE The number of ports that are available on this virtual switch. int MTU The maximum transmission unit (MTU) associated with this virtual switch in bytes.
Database tables and fields TABLE 494 VM_STD_VSWITCH_PORT_GROUP (Continued) Field Definition Format VM_STANDARD_VIRTUA L__SWITCH_ID Foreign Key to the vm_standard_virtual_switch table. The standard virtual swtich on which this port group exists. int MOR_ID The managed object reference number assigned by the hypervisor. int TABLE 495 H Size VM_STORAGE Field Definition Format ID Uniquely identifies this LUN. serial HOST_ID Identifies the server that accesses this LUN.
H Database tables and fields TABLE 496 Field Definition Format VM_STORAGE_ID A foreign key referencing VM_STORAGE (ID). int HBA_REMOTE_PORT_ID A foreign key referencing HBA_REMOTE_PORT (ID). int TABLE 497 Size VM_TRAFFIC_SHAPING_POLICY Field Definition Format ID Unique generated database identifier. serial ENABLED 'The flag to indicate whether or not traffic shaper is enabled on the port.
H Database tables and fields TABLE 498 VM_VCENTER (Continued) Field Definition Format Size MANAGED_ELEMENT_ID A foreign key referencing MANAGED_ELEMENT(ID). int FAULT_MONITORING_ST ATE Flag to indicate whether fault monitoring is registered or not for a VM Host. Possible values are: 1.Not registered 2.Registered (Default) smallint NAME The name of the VCenter. varchar 64 UUID Unique identifier for vCenter server instance.
H Database tables and fields TABLE 500 1748 VM_VIRTUAL_ETHERNET_ADAPTER (Continued) Field Definition Format ADDRESS_TYPE MAC address type. Valid values for address type are: • Manual • Statically assigned MAC address. • Generated • Automatically generated MAC address. • Assigned • MAC address assigned by VirtualCenter. smallint MAC_ADDRESS MAC address assigned to the virtual network adapter. Clients can set this property to any of the allowed address types.
H Database tables and fields TABLE 501 VM_VIRTUAL_MACHINE Field Definition Format ID Uniquely identifies the virtual machine serial HOST_ID Identifies the server that contains this VM int HYPERVISOR_VM_ID The VM number assigned by the hypervisor. Some hypervisors identify VMs by number as well as by name int NAME User-assigned name for the VM varchar 80 DESCRIPTION Optional user-entered notes describing the VM. (Annotation in VMware terminology.
H Database tables and fields TABLE 501 Definition Format Size UNCOMMITTED_STORA GE Additional Provisioned storage for a particular virtual machine. varchar 64 UNSHARED_STORAGE Exclusive storage for a particular virtual machine. varchar 64 Size TABLE 502 VM_VIRTUAL_MACHINE_DATASTORE_MAP Field Definition Format VM_DATASTORE_DETAIL S_ID A foreign key referencing VM_DATASTORE_DETAILS(ID). int VIRTUAL_MACHINE_ID A foreign key referencing VM_VIRTUAL_MACHINE(ID).
Database tables and fields TABLE 505 H VR_CONN_DOMAIN Field Definition Format ID Unique generated database identifier. serial VCEM_PROFILE_ID Foreign key references the ID of the VCEM server that the domain belongs to. int VR_CONN_DOMAIN_GROUP_I D Nullable foreign key references the ID of the domain group that the domain may belong to. int VCEM_ASSIGNED_ID The ID assigned by the VCEM server.
H Database tables and fields TABLE 508 VR_CONN_MODULE Field Definition Format ID Unique generated database identifier. serial VR_CONN_DOMAIN_ID Foreign key references the domain ID that the module belongs to. int VCEM_ASSIGNED_ID The ID assigned by VCEM. varchar 256 WWN The WWN of the module. char 23 PRODUCT_NAME The product name of the module. varchar 256 SERIAL_NUMBER The serial number of the module. varchar 32 STATUS The current status of the module.
H Database tables and fields TABLE 510 VR_CONN_SERVER_PROFILE Field Definition Format ID Unique generated database identifier. serial VCEM_PROFILE_ID Foreign key references the ID of the VCEM server that the server profile belongs to. int VR_CONN_DOMAIN_GROUP_I D Nullable foreign key references the ID of the domain group that the server profile may belong to. int VCEM_ASSIGNED_ID The ID assigned by the VCEM server.
H Database tables and fields TABLE 512 Definition Format Size RF_DOMAIN_NAME RF domain name set for the AP. varchar 64 TIME_ZONE Time zone set for the AP. varchar 80 COUNTRY Country set for the AP. varchar 32 VLAN_FOR_CONTROL_TRAFFI C VLAN for control traffic set for the AP. varchar 512 CLIENT_COUNT Number of wireless clients or stations that connected or associated to the AP. int TABLE 513 WIRELESS_PRODUCT_RELATION Field Definition Format ID The primary key of the table.
H Database tables and fields TABLE 516 ZONE_ALIAS Field Definition Format ID* Unique generated database identifier. int ZONE_DB_ID PK of the owning ZONE_DB. int NAME The zone alias name. varchar 64 Size TABLE 517 Size ZONE_ALIAS_IN_ZONE Field Definition Format ZONE_ALIAS_ID* PK of the zone alias. int ZONE_ID* PK of the zone. int 23 Size TABLE 518 ZONE_ALIAS_MEMBER Field Definition Format ID* Unique generated database identifier.
H Database tables and fields TABLE 520 ZONE_DB_CONFIG Field Definition Format ID Unique generated database identifier. int ZONE_DB_ID PK of the owning zone DB int DEFINED_CONTENT Defined zone raw config string, wrapped with $ to prevent special char trimming text ACTIVE_CONTENT Active zone raw config string text TI_ZONE_CONTENT TI zone raw config string text TABLE 521 ZONE_DB_CONTENT Field Definition Format ID* PK of the owning offline zone DB.
H Views TABLE 525 ZONE_SET Field Definition Format ID* Unique generated database identifier. int ZONE_DB_ID PK of owning zone DB. int NAME Zone set name. varchar ACTIVE 1 = active zone set 0 = otherwise. smallint Size 64 Views ADAPTER_PORT_CONFIG_INFO create or replace view ADAPTER_PORT_CONFIG_INFO as select ADAPTER_PORT_CONFIG.ID, ADAPTER_PORT_CONFIG.NAME as CONFIG_NAME, ADAPTER_PORT_CONFIG.TYPE as TYPE, ADAPTER_PORT_CONFIG_PROPERTY.NAME as PROPERTY_NAME, ADAPTER_PORT_CONFIG_DETAILS.
H Views BIRTREPORT_SCHEDULE_INFO CREATE OR REPLACE VIEW birtreport_schedule_info AS SELECT birtreport_schedule_config.id AS schedule_id, birtreport_schedule_config.name AS schedule_name, birtreport_schedule_config.report_store_location, birtreport_schedule_config.overwrite, birtreport_schedule_config.format_type, birtreport_schedule_config.created_by AS birtreport_schedule_config_created_by, birtreport_schedule_config.email_delivery, birtreport_schedule_config.folder_delivery, birtreport_schedule_config.
Views H deployment_status.deployment_configuration_id AND deployment_status.deployment_time = (SELECT max(deployment_status.deployment_time) FROM deployment_status WHERE deployment_status.deployment_configuration_id = deployment_configuration.id) LEFT JOIN schedule_entry ON schedule_entry.identity::text = deployment_configuration.id::character varying(16)::text AND schedule_entry.
H Views left outer join CNA_ETH_PORT_CONFIG on CNA_PORT.ID = CNA_ETH_PORT_CONFIG.CNA_PORT_ID; CNA_PORT_DETAILS_INFO create or replace view CNA_PORT_DETAILS_INFO as select CNA_PORT.ID, CNA_PORT.PORT_NUMBER, CNA_PORT.PORT_WWN, CNA_PORT.NODE_WWN, CNA_PORT.PHYSICAL_PORT_TYPE, CNA_PORT.NAME, CNA_PORT.MAC_ADDRESS, CNA_PORT.MEDIA, CNA_PORT.CEE_STATE, CNA_PORT.HBA_ID, CNA_PORT.CREATION_TIME as CNA_PORT_CREATION_TIME, CNA_ETH_PORT.ID as ETH_PORT_ID, CNA_ETH_PORT.ETH_DEV, CNA_ETH_PORT.ETH_LOG_LEVEL, CNA_ETH_PORT.
Views H CNA_ETH_PORT.IOC_ID, CNA_ETH_PORT.HARDWARE_PATH, CNA_ETH_PORT.STATUS, CNA_ETH_PORT.CREATION_TIME as ETH_PORT_CREATION_TIME, HBA_PORT.DEVICE_PORT_ID, CNA_ETH_PORT.MTU, CNA_PORT.ALARM_WARNING from CNA_PORT left outer join HBA_PORT on CNA_PORT.ID = HBA_PORT.CNA_PORT_ID left outer join CNA_ETH_PORT on CNA_PORT.ID = CNA_ETH_PORT.CNA_PORT_ID; CORE_SWITCH_DETAILS_INFO create or replace view CORE_SWITCH_DETAILS_INFO as select CORE_SWITCH.ID, CORE_SWITCH.IP_ADDRESS, CORE_SWITCH.WWN, CORE_SWITCH.
H Views CORE_SWITCH_DETAILS.ACT_CP_SEC_FW_VERSION, CORE_SWITCH_DETAILS.STBY_CP_PRI_FW_VERSION, CORE_SWITCH_DETAILS.STBY_CP_SEC_FW_VERSION, CORE_SWITCH_DETAILS.EGM_CAPABLE, CORE_SWITCH_DETAILS.SUB_TYPE, CORE_SWITCH_DETAILS.PARTITION, CORE_SWITCH_DETAILS.MAX_NUM_OF_BLADES, CORE_SWITCH_DETAILS.VENDOR_VERSION, CORE_SWITCH_DETAILS.VENDOR_PART_NUMBER, CORE_SWITCH_DETAILS.RNID_SEQUENCE_NUMBER, CORE_SWITCH_DETAILS.CONTACT, CORE_SWITCH_DETAILS.LOCATION, CORE_SWITCH_DETAILS.DESCRIPTION, CORE_SWITCH_DETAILS.
Views H LUN.TIME_LEFT_FOR_AUTO_REKEY, CRYPTO_HOST.HOST_PORT_WWN, CRYPTO_HOST.HOST_NODE_WWN LUN.THIN_PROVISION_LUN from CRYPTO_LUN LUN, CRYPTO_HOST where LUN.CRYPTO_HOST_ID = CRYPTO_HOST.ID; CRYPTO_TARGET_ENGINE_INFO create or replace view CRYPTO_TARGET_ENGINE_INFO as select CRYPTO_TARGET_CONTAINER.ID TARGET_CONTAINER_ID, CRYPTO_TARGET_CONTAINER.NAME, CRYPTO_TARGET_CONTAINER.VT_NODE_WWN, CRYPTO_TARGET_CONTAINER.VT_PORT_WWN, CRYPTO_TARGET_CONTAINER.FAILOVER_STATUS, CRYPTO_TARGET_CONTAINER.
H Views DASHBOARD_CANVAS_PREFERENCE.DASHBOARD_CANVAS_ID, DASHBOARD_CANVAS_PREFERENCE.VISIBLE, DASHBOARD_CANVAS_PREFERENCE.TIME_SCOPE, DASHBOARD_CANVAS_PREFERENCE.USER_ID from DASHBOARD, DASHBOARD_CANVAS, DASHBOARD_CANVAS_PREFERENCE where DASHBOARD.ID = DASHBOARD_CANVAS_PREFERENCE.DASHBOARD_ID and DASHBOARD_CANVAS.ID = DASHBOARD_CANVAS_PREFERENCE.DASHBOARD_CANVAS_ID; DEPLOYMENT_INFO create or replace view DEPLOYMENT_INFO as select DEPLOYMENT_CONFIGURATION.ID as ID, DEPLOYMENT_CONFIGURATION.
Views H DEPLOYMENT_LOG create or replace view DEPLOYMENT_LOG as select DEPLOYMENT_CONFIGURATION.ID, DEPLOYMENT_CONFIGURATION.NAME, DEPLOYMENT_CONFIGURATION.DESCRIPTION, DEPLOYMENT_HANDLER.MODULE, DEPLOYMENT_HANDLER.SUB_MODULE, DEPLOYMENT_STATUS.DEPLOYMENT_TIME, DEPLOYMENT_CONFIGURATION.DEPLOY_OPTION as DEPLOYMENT_OPTION, DEPLOYMENT_STATUS.STATUS, DEPLOYMENT_STATUS.DEPLOYED_BY, DEPLOYMENT_CONFIGURATION.CREATED_BY as CREATOR, DEPLOYMENT_CONFIGURATION.SCHEDULE_ENABLED, DEPLOYMENT_CONFIGURATION.
H Views left join SWITCH_PORT SWPORT on DEVICE_CONNECTION.SWITCH_PORT_ID = SWPORT.ID left join SWITCH_PORT AGPORT on DEVICE_CONNECTION.AG_PORT_ID = AGPORT.ID left join HBA_PORT_DEVICE_PORT_MAP on DEVICE_PORT.ID = HBA_PORT_DEVICE_PORT_MAP.DEVICE_PORT_ID left join HBA_PORT on HBA_PORT_DEVICE_PORT_MAP.HBA_PORT_ID = HBA_PORT.DEVICE_PORT_ID left join HBA on HBA_PORT.HBA_ID = HBA.ID left join VM_FC_HBA_DEVICE_PORT_MAP ON VM_FC_HBA_DEVICE_PORT_MAP.DEVICE_PORT_ID = DEVICE_PORT.ID left join VM_FC_HBA ON VM_FC_HBA.
Views H timestamp with time zone 'epoch' + TIME_IN_SECONDS * interval '1 second' as CREATION_TIME, sum(case when MEASURE_ID = 208 then value else 0 end) as TX_UTILIZATION, sum(case when MEASURE_ID = 209 then value else 0 end) as RX_UTILIZATION, sum(case when MEASURE_ID = 210 then value else 0 end) as CRC_ERRORS from TIME_SERIES_DATA_1_2HOUR, VIRTUAL_SWITCH where ME_ID = MANAGED_ELEMENT_ID and COLLECTOR_ID = 16 group by ME_ID, TARGET_TYPE, TARGET_ID, TIME_IN_SECONDS,VIRTUAL_SWITCH_ID order by TIME_IN_SECON
H Views TE_PORT_STATS_30MIN_INFO create or replace view TE_PORT_STATS_30MIN_INFO as select VIRTUAL_SWITCH.
Views H ME_ID, TARGET_ID as PORT_ID, timestamp with time zone 'epoch' + TIME_IN_SECONDS * interval '1 second' as CREATION_TIME, sum(case when MEASURE_ID = 193 then value else 0 end) as RECEIVE_OK_PERCENT_UTIL, sum(case when MEASURE_ID = 194 then value else 0 end) as TRANSMIT_OK_PERCENT_UTIL, sum(case when MEASURE_ID = 196 then value else 0 end) as RECEIVE_OK, sum(case when MEASURE_ID = 195 then value else 0 end) as TRANSMIT_OK, sum(case when MEASURE_ID = 36 then value else 0 end) as RECEIVE_EOF, sum(case
H Views VIRTUAL_SWITCH.FCS_ROLE, VIRTUAL_SWITCH.DOMAIN_ID, VIRTUAL_SWITCH.VIRTUAL_FABRIC_ID, VIRTUAL_SWITCH.BASE_SWITCH, VIRTUAL_SWITCH.MAX_ZONE_CONFIG_SIZE, VIRTUAL_SWITCH.CREATION_TIME, VIRTUAL_SWITCH.LAST_UPDATE_TIME, VIRTUAL_SWITCH.USER_NAME, VIRTUAL_SWITCH.PASSWORD, VIRTUAL_SWITCH.MANAGEMENT_STATE, VIRTUAL_SWITCH.STATE, VIRTUAL_SWITCH.STATUS, VIRTUAL_SWITCH.STATUS_REASON, VIRTUAL_SWITCH.FABRIC_IDID_MODE, VIRTUAL_SWITCH.LOGICAL_ID, VIRTUAL_SWITCH.USER_DEFINED_VALUE_1, VIRTUAL_SWITCH.
Views H VIRTUAL_SWITCH.PROTOCOL, FABRIC_MEMBER.FABRIC_ID, FABRIC_MEMBER.TRUSTED, FABRIC_MEMBER.MISSING, FABRIC_MEMBER.MISSING_TIME, FABRIC.MANAGED as FABRIC_MANAGED, FABRIC.PRINCIPAL_SWITCH_WWN, FABRIC.SEED_SWITCH_WWN, FABRIC.TYPE as FABRIC_TYPE from CORE_SWITCH, VIRTUAL_SWITCH, FABRIC_MEMBER, FABRIC where VIRTUAL_SWITCH.CORE_SWITCH_ID = CORE_SWITCH.ID and FABRIC_MEMBER.VIRTUAL_SWITCH_ID = VIRTUAL_SWITCH.ID and FABRIC_MEMBER.FABRIC_ID = FABRIC.
H Views virtual_switch.fcip_circuit_capable, virtual_switch.max_fcip_tunnels, virtual_switch.max_fcip_circuits, virtual_switch.fcip_licensed, virtual_switch.addressing_mode, virtual_switch.previous_state, virtual_switch.managed_element_id, virtual_switch.hif_enabled, virtual_switch.auto_snmp, virtual_switch.rnid_sequence_number, virtual_switch.vcs_id, virtual_switch.cluster_type, virtual_switch.cluster_mode, virtual_switch.rnid_tag, virtual_switch.switch_id, virtual_switch.monitored, virtual_switch.
Views H varying, 'EX-Port'::character varying, 'FL-Port'::character varying, 'SIM-Port'::character varying, 'N-Port'::character varying]::text[]))OR switch_port.type like'LB-Port%') AND switch_port.occupied = 1 ) AS occupied_switch_port_count, ( SELECT count(switch_port.id) AS count FROM switch_port WHERE switch_port.virtual_switch_id = virtual_switch.id AND switch_port.licensed = 1 AND ((switch_port.
H Views DEVICE_PORT.COS, DEVICE_PORT.NPV_PHYSICAL, SWITCH_PORT.ID as SWITCH_PORT_ID, SWITCH_PORT.WWN as SWITCH_PORT_WWN, SWITCH_PORT.NAME as SWITCH_PORT_NAME, SWITCH_PORT.SLOT_NUMBER, SWITCH_PORT.PORT_NUMBER, SWITCH_PORT.PORT_INDEX, SWITCH_PORT.TYPE as SWITCH_PORT_TYPE, SWITCH_PORT.FULL_TYPE as SWITCH_PORTFULL_TYPE, SWITCH_PORT.EXT_TYPE as SWITCH_PORT_EXT_TYPE, SWITCH_PORT.STATUS as SWITCH_PORT_STATUS, SWITCH_PORT.HEALTH as SWITCH_PORT_HEALTH, SWITCH_PORT.SPEED, SWITCH_PORT.MAX_PORT_SPEED, SWITCH_PORT.
Views H AG_N_PORT.REMOTE_PORT_WWN as EDGE_SWITCH_PORT_WWN, AG_N_PORT.WWN as AG_N_PORT_WWN, AG_F_PORT.WWN as AG_F_PORT_WWN, AG_F_PORT.REMOTE_NODE_WWN, AG_F_PORT.REMOTE_PORT_WWN as DEVICE_PORT_WWN from N2F_PORT_MAP, SWITCH_PORT AG_N_PORT, SWITCH_PORT AG_F_PORT, VIRTUAL_SWITCH AG_SWITCH where N2F_PORT_MAP.VIRTUAL_SWITCH_ID = AG_N_PORT.VIRTUAL_SWITCH_ID and N2F_PORT_MAP.N_PORT = AG_N_PORT.USER_PORT_NUMBER and N2F_PORT_MAP.VIRTUAL_SWITCH_ID = AG_F_PORT.VIRTUAL_SWITCH_ID and N2F_PORT_MAP.F_PORT = AG_F_PORT.
H Views on DEVICE_NODE.WWN = USER_DEFINED_DEVICE_DETAIL.WWN left outer join FABRIC on DEVICE_NODE.FABRIC_ID = FABRIC.ID left outer join DEVICE_FDMI_DETAILS on DEVICE_NODE.ID = DEVICE_FDMI_DETAILS.DEVICE_NODE_ID; DEVICE_PORT_INFO CREATE VIEW device_port_info AS select DEVICE_PORT.ID, DEVICE_PORT.NODE_ID, DEVICE_PORT.DOMAIN_ID, DEVICE_PORT.WWN, DEVICE_PORT.SWITCH_PORT_WWN, DEVICE_PORT.NUMBER, DEVICE_PORT.PORT_ID, DEVICE_PORT.TYPE, DEVICE_PORT.SYMBOLIC_NAME, DEVICE_PORT.FC4_TYPE, DEVICE_PORT.
Views H coalesce(VS1.MONITORED, VS2.MONITORED) as MONITORED, FABRIC.PRINCIPAL_SWITCH_WWN as PRINCIPAL_WWN, FABRIC.ID as FABRIC_ID from DEVICE_PORT left outer join USER_DEFINED_DEVICE_DETAIL on DEVICE_PORT.WWN = USER_DEFINED_DEVICE_DETAIL.WWN left outer join FICON_DEVICE_PORT on DEVICE_PORT.ID = FICON_DEVICE_PORT.DEVICE_PORT_ID left outer join DEVICE_NODE on DEVICE_PORT.NODE_ID = DEVICE_NODE.ID left outer join SWITCH_PORT on DEVICE_PORT.SWITCH_PORT_WWN = SWITCH_PORT.
H Views SP.NAME as SWITCH_PORT_NAME, SP.LOGICAL_PORT_WWN, SP.VIRTUAL_SWITCH_ID, CS.IP_ADDRESS as SWITCH_IP_ADDRESS, coalesce(USER_DEFINED_DEVICE_DETAIL.TYPE, DN.TYPE, ''::character varying) as USER_DEFINED_DEVICE_TYPE, USER_DEFINED_DEVICE_DETAIL.NAME as USER_DEFINED_NAME, USER_DEFINED_DEVICE_DETAIL.IP_ADDRESS as USER_DEFINED_IP_ADDRESS, USER_DEFINED_DEVICE_DETAIL.CONTACT, USER_DEFINED_DEVICE_DETAIL.LOCATION, USER_DEFINED_DEVICE_DETAIL.DESCRIPTION from DEVICE_PORT DP join DEVICE_NODE DN on DP.NODE_ID = DN.
Views H and DEVICE_PORT.NODE_ID = DEVICE_NODE.ID; ISL_CONNECTION_INFO create or replace view ISL_CONNECTION_INFO as select distinct ISL_CONNECTION.ID, ISL_CONNECTION.FABRIC_ID, ISL_CONNECTION.SOURCE_SWITCH_PORT_ID, ISL_CONNECTION.TARGET_SWITCH_PORT_ID, ISL_CONNECTION.COST, ISL_CONNECTION.TYPE, ISL_CONNECTION.TRUSTED, ISL_CONNECTION.MISSING, ISL_CONNECTION.MISSING_TIME, ISL_CONNECTION.CREATION_TIME, ISL_CONNECTION.TRUNKED, ISL_CONNECTION.MISSING_REASON, ISL_CONNECTION.MASTER_CONNECTION_ID, ISL_CONNECTION.
H Views SOURCE_VIRTUAL_SWITCH.ID as SOURCE_SWITCH_ID, SOURCE_VIRTUAL_SWITCH.NAME as SOURCE_SWITCH_NAME, SOURCE_VIRTUAL_SWITCH.WWN as SOURCE_SWITCH_WWN, SOURCE_VIRTUAL_SWITCH.CORE_SWITCH_ID as SOURCE_CORE_SWITCH_ID, SOURCE_VIRTUAL_SWITCH.BASE_SWITCH as SOURCE_BASE_SWITCH, SOURCE_VIRTUAL_SWITCH.MANAGEMENT_STATE as SOURCE_VIRTUAL_SWITCH_MANAGEMENT_STATE, SOURCE_VIRTUAL_SWITCH.MONITORED as SOURCE_VIRTUAL_SWITCH_MONITORED, SOURCE_SWITCH_PORT.ID as SOURCE_SWITCH_PORT_ID, SOURCE_SWITCH_PORT.
Views H ETHERNET_ISL.ID as ETHERNET_ISL_ID, ETHERNET_ISL.SOURCE_PORT_ID, ETHERNET_ISL.DEST_PORT_ID, ETHERNET_ISL.TRUSTED, ETHERNET_ISL.CREATION_TIME, ETHERNET_ISL.MISSING, ETHERNET_ISL.MISSING_TIME, SOURCE_SWITCH_PORT.VIRTUAL_SWITCH_ID as SOURCE_SWITCH_ID, SOURCE_SWITCH_PORT.USER_PORT_NUMBER as SOURCE_PORT_NUMBER, SOURCE_SWITCH_PORT.TYPE as SOURCE_PORT_TYPE, SOURCE_VIRTUAL_SWITCH.VIRTUAL_FABRIC_ID as SOURCE_VIRTUAL_FABRIC_ID, DEST_SWITCH_PORT.VIRTUAL_SWITCH_ID as DEST_SWITCH_ID, DEST_SWITCH_PORT.
H Views EVENT.PORT_GROUP_ID as PORT_GROUP_ID, EVENT.SPECIAL_EVENT, EVENT_ORIGIN.ID as ORIGIN, EVENT_CATEGORY.ID as EVENT_CATEGORY, EVENT_DESCRIPTION.DESCRIPTION as DESCRIPTION, EVENT_MODULE.ID as MODULE, EVENT_DETAILS.RAS_LOG_ID as RAS_LOG_ID, EVENT_DETAILS.PRODUCT_ADDRESS as PRODUCT_ADDRESS, EVENT_DETAILS.CONTRIBUTORS as CONTRIBUTORS, EVENT_DETAILS.NODE_WWN as NODE_WWN, EVENT_DETAILS.PORT_WWN as PORT_WWN, EVENT_DETAILS.OPERATIONAL_STATUS as OPERATIONAL_STATUS, EVENT_DETAILS.
Views H EVENT_DETAILS.RAS_LOG_ID as RAS_LOG_ID, EVENT_DETAILS.PRODUCT_ADDRESS as PRODUCT_ADDRESS, EVENT_DETAILS.CONTRIBUTORS as CONTRIBUTORS, EVENT_DETAILS.NODE_WWN as NODE_WWN, EVENT_DETAILS.OPERATIONAL_STATUS as OPERATIONAL_STATUS, EVENT_DETAILS.FIRST_OCCURRENCE_SWITCH_TIME as FIRST_OCCURRENCE_SWITCH_TIME, EVENT_DETAILS.LAST_OCCURRENCE_SWITCH_TIME as LAST_OCCURRENCE_SWITCH_TIME, EVENT_DETAILS.VIRTUAL_FABRIC_ID as VIRTUAL_FABRIC_ID, EVENT_DETAILS.USER_NAME as USER_NAME, EVENT_DETAILS.
H Views FABRIC.SEED_SWITCH_WWN = VIRTUAL_SWITCH.WWN and VIRTUAL_SWITCH.CORE_SWITCH_ID = CORE_SWITCH.ID; FCIP_TUNNEL_CIRCUIT_INFO CREATE VIEW fcip_tunnel_circuit_info AS select FCIP_TUNNEL_CIRCUIT.ID, FCIP_TUNNEL_CIRCUIT.TUNNEL_ID, FCIP_TUNNEL_CIRCUIT.CIRCUIT_NUMBER, FCIP_TUNNEL_CIRCUIT.COMPRESSION_ENABLED, FCIP_TUNNEL_CIRCUIT.TURBO_WRITE_ENABLED, FCIP_TUNNEL_CIRCUIT.TAPE_ACCELERATION_ENABLED, FCIP_TUNNEL_CIRCUIT.IKE_POLICY_NUM, FCIP_TUNNEL_CIRCUIT.IPSEC_POLICY_NUM, FCIP_TUNNEL_CIRCUIT.
Views H left outer join GIGE_PORT on FCIP_CIRCUIT_PORT_MAP.SWITCH_PORT_ID = GIGE_PORT.ID left outer join SWITCH_PORT on GIGE_PORT.SWITCH_PORT_ID = SWITCH_PORT.ID; FCIP_TUNNEL_INFO create or replace view FCIP_TUNNEL_INFO as select FCIP_TUNNEL.ID, FCIP_TUNNEL.TUNNEL_ID, FCIP_TUNNEL.VLAN_TAG, FCIP_TUNNEL.SOURCE_IP, FCIP_TUNNEL.DEST_IP, FCIP_TUNNEL.LOCAL_WWN, FCIP_TUNNEL.REMOTE_WWN_RESTRICT, FCIP_TUNNEL.COMMUNICATION_RATE, FCIP_TUNNEL.MIN_RETRANSMIT_TIME, FCIP_TUNNEL.SELECTIVE_ACK_ENABLED, FCIP_TUNNEL.
H Views FCIP_TUNNEL.PRESHARED_KEY, FCIP_TUNNEL.QOS_HIGH, FCIP_TUNNEL.QOS_MEDIUM, FCIP_TUNNEL.QOS_LOW, FCIP_TUNNEL.BACKWARD_COMPATIBLE, FCIP_TUNNEL.FICON_TERADATA_READ_ENABLED, FCIP_TUNNEL.FICON_TERADATA_WRITE_ENABLED, PORT.WWN as VIRTUAL_PORT_WWN, PORT.REMOTE_PORT_WWN as REMOTE_PORT_WWN, PORT.REMOTE_NODE_WWN as REMOTE_NODE_WWN, PORT.ID as SWITCH_PORT_ID, PORT.PORT_NUMBER as SWITCH_PORT_NUMBER, PORT.USER_PORT_NUMBER as USER_PORT_NUMBER, PORT.PORT_INDEX, PORT.
Views H FRU.VENDOR_EQUIPMENT_TYPE, FRU.OPERATIONAL_STATUS, FRU.TOTAL_OUTPUT_POWER, FRU.SPEED, FRU.CREATION_TIME, FRU.LAST_UPDATE_TIME, FRU.PREVIOUS_OP_STATUS, FRU.VENDOR, CORE_SWITCH.WWN as PHYSICAL_SWITCH_WWN, VIRTUAL_SWITCH.SWITCH_MODE as VIRTUAL_SWITCH_MODE, VIRTUAL_SWITCH.MANAGEMENT_STATE, VIRTUAL_SWITCH.MONITORED from FRU, CORE_SWITCH, VIRTUAL_SWITCH where FRU.CORE_SWITCH_ID = CORE_SWITCH.ID and FRU.CORE_SWITCH_ID = VIRTUAL_SWITCH.
H Views GIGE_PORT.PORT_NAME, GIGE_PORT.OPERATIONAL_STATUS, GIGE_PORT.LED_STATE, GIGE_PORT.SPEED_LED_STATE, GIGE_PORT.PORT_TYPE, GIGE_PORT.PERSISTENTLY_DISABLED, GIGE_PORT.INTERFACE_TYPE, GIGE_PORT.CHECKSUM, GIGE_PORT.FCIP_CAPABLE, coalesce(CARD.FCIP_CIRCUIT_CAPABLE, VIRTUAL_SWITCH.FCIP_CIRCUIT_CAPABLE) as FCIP_CIRCUIT_CAPABLE, GIGE_PORT.ISCSI_CAPABLE, GIGE_PORT.REMOTE_MAC_ADDRESS, GIGE_PORT.INBAND_MANAGEMENT_STATUS, GIGE_PORT.LAST_UPDATE, SWITCH_PORT.VIRTUAL_SWITCH_ID, SWITCH_PORT.
Views H birtreport_schedule_config.deployment_id, birtreport_schedule_config.email_delivery, birtreport_schedule_config.folder_delivery, CREATE OR REPLACE VIEW generated_birtreport_info AS SELECT generated_birtreport.id AS generated_report_id, generated_birtreport.file_name, generated_birtreport.rptdoc_store_location, generated_birtreport.generate_time, generated_birtreport.format, generated_birtreport.flagged, generated_birtreport.shared, generated_birtreport.report_template_id, generated_birtreport.
H Views HBA_PORT.CREATION_TIME as HBA_PORT_CREATION_TIME, HBA_PORT.MISSING as HBA_PORT_MISSING, HBA_PORT.MISSING_TIME as HBA_PORT_MISSING_TIME, HBA_PORT.OPERATING_SPEED, HBA_PORT.CNA_PORT_ID, HBA_PORT.PORT_NWWN, HBA_PORT.PHYSICAL_PORT_WWN, HBA_PORT.SWITCH_IP, HBA_PORT.PRINCIPAL_SWITCH_WWN, HBA_PORT.HBA_ID, HBA_PORT.PORT_NUMBER, HBA_PORT.NAME, HBA_PORT.FACTORY_PORT_WWN, HBA_PORT.FACTORY_NODE_WWN, HBA_PORT.PREBOOT_CREATED, HBA_PORT.MAX_BANDWIDTH, HBA_PORT.PCIF_INDEX, HBA_PORT.MAX_PCIF, HBA_PORT_DETAIL.
Views H HBA_PORT_FCOE_DETAILS.FCF_FCMAP, HBA_PORT_FCOE_DETAILS.FCF_FPMA_MAC, HBA_PORT_FCOE_DETAILS.FCF_MAC, HBA_PORT_FCOE_DETAILS.FCF_MODE, HBA_PORT_FCOE_DETAILS.FCF_NAMEID, HBA_PORT_FCOE_DETAILS.FCPIM_MPIO_MODE, HBA_PORT_FCOE_DETAILS.PORT_LOG_ENABLED, HBA_PORT_FCOE_DETAILS.MAX_FRAME_SIZE as FCOE_MAX_FRAME_SIZE, HBA_PORT_FCOE_DETAILS.MTU as FCOE_MTU, HBA_PORT_FCOE_DETAILS.PATH_TOV as FCOE_PATH_TOV, HBA_PORT_FCOE_DETAILS.SCSI_QUEUE_DEPTH as FCOE_SCSI_QUEUE_DEPTH, HBA_PORT_FCOE_DETAILS.
H Views HBA_REMOTE_PORT.TARGET_ID, HBA_REMOTE_PORT.ROLE, HBA_REMOTE_PORT.VENDOR, HBA_REMOTE_PORT.PRODUCT_ID, HBA_REMOTE_PORT.PRODUCT_VERSION, HBA_REMOTE_PORT.QOS_PRIORITY, HBA_REMOTE_PORT.QOS_FLOW_ID, HBA_REMOTE_PORT.CURRENT_SPEED, HBA_REMOTE_PORT.TRL_ENFORCED, HBA_REMOTE_PORT.BUS_NO, HBA_REMOTE_PORT_LUN.FCP_LUN, HBA_REMOTE_PORT_LUN.CAPACITY, HBA_REMOTE_PORT_LUN.BLOCK_SIZE, HBA_REMOTE_PORT_LUN.VENDOR as LUN_VENDOR, HBA_REMOTE_PORT_LUN.PRODUCT_ID as LUN_PRODUCT_ID, HBA_REMOTE_PORT_LUN.
Views H HOST_INVENTORY_REPORT_INFO CREATE OR REPLACE VIEW host_inventory_report_info AS select DEVICE_ENCLOSURE.ID as DEVICE_ENCLOSURE_ID, DEVICE_ENCLOSURE.NAME as HOST_NAME, DEVICE_ENCLOSURE.IP_ADDRESS as HOST_IP, case when (DEVICE_ENCLOSURE.VENDOR is null or DEVICE_ENCLOSURE.VENDOR = '') then 'NA' else DEVICE_ENCLOSURE.VENDOR end as HOST_VENDOR, DEVICE_ENCLOSURE.MODEL as HOST_MODEL, DEVICE_ENCLOSURE.OS as HOST_OS, DEVICE_ENCLOSURE.LOCATION as HOST_LOCATION, DEVICE_ENCLOSURE.
H Views ADAPTER_PORT_FAA_STATUS, case when (HBA_PORT_DETAIL.WWN_SOURCE is null or HBA_PORT_DETAIL.WWN_SOURCE = '') then 'NA' else HBA_PORT_DETAIL.WWN_SOURCE end as ADAPTER_PORT_WWN_SOURCE, HBA_PORT_DETAIL.BOOT_OVER_SAN as ADAPTER_PORT_BOOT_OVER_SAN, ADAPTER_PORT.MAX_SPEED_SUPPORTED as ADAPTER_PORT_MAX_SPEED_SUPPORTED, ADAPTER_PORT.OPERATING_STATE as PORT_OPERATING_STATE, ADAPTER_PORT_COUNT.PORT_COUNT as HBA_PORT_COUNT, HBA.ID as HBA_PORT_ID, ADAPTER_PORT_FABRIC_MAP.FABRIC_NAME, ADAPTER_PORT_FABRIC_MAP.
Views H vs.domain_id As edge_virtual_switch_domain_id, sp.category AS sp_category, sp.licensed AS sp_licensed, sp.name AS sp_name, sp.slot_number AS sp_slot_number, sp.port_number AS sp_port_number, sp.port_id AS sp_port_id, sp.port_index AS sp_port_index, sp.area_id AS sp_area_id, sp.mac_address AS sp_mac_address, sp.status AS sp_status, sp.state AS sp_state, cs.model AS edge_core_switch_smodel, cs.ip_address AS edge_core_switch_ip_address, cs.wwn AS edge_core_switch_physical_switch_wwn, cs.
H Views CNA_ETH_PORT.CNA_PORT_ID and CNA_PORT.ID = CNA_ETH_PORT.CNA_PORT_ID and DEVICE_PORT.NPV_PHYSICAL=0 ) as ADAPTER_PORT, (select HBA_PORT.HBA_ID, count(HBA_PORT.DEVICE_PORT_ID) as PORT_COUNT from HBA_PORT, DEVICE_PORT_INFO where HBA_PORT.DEVICE_PORT_ID = DEVICE_PORT_INFO.ID and DEVICE_PORT_INFO.NPV_PHYSICAL = 0 group by (HBA_PORT.HBA_ID)) as ADAPTER_PORT_COUNT where DEVICE_ENCLOSURE.MANAGED_BY in (2,4) and DEVICE_ENCLOSURE.ID = HBA.HOST_ID and ADAPTER_PORT.HBA_ID = HBA.ID and ADAPTER_PORT.
Views H DEVICE_ENCLOSURE.LOCATION, DEVICE_ENCLOSURE.DESCRIPTION, DEVICE_ENCLOSURE.COMMENT_, DEVICE_ENCLOSURE.IP_ADDRESS, DEVICE_ENCLOSURE.VENDOR, DEVICE_ENCLOSURE.MODEL, DEVICE_ENCLOSURE.SERIAL_NUMBER, DEVICE_ENCLOSURE.FIRMWARE, DEVICE_ENCLOSURE.USER_DEFINED_VALUE1, DEVICE_ENCLOSURE.USER_DEFINED_VALUE2, DEVICE_ENCLOSURE.USER_DEFINED_VALUE3, DEVICE_ENCLOSURE.HCM_AGENT_VERSION, DEVICE_ENCLOSURE.OS_VERSION, DEVICE_ENCLOSURE.CREATED_BY, DEVICE_ENCLOSURE.TRACK_CHANGES, DEVICE_ENCLOSURE.
H Views DEVICE_ENCLOSURE.COMMENT_, DEVICE_ENCLOSURE.IP_ADDRESS, DEVICE_ENCLOSURE.VENDOR, DEVICE_ENCLOSURE.MODEL, DEVICE_ENCLOSURE.SERIAL_NUMBER, DEVICE_ENCLOSURE.FIRMWARE, DEVICE_ENCLOSURE.USER_DEFINED_VALUE1, DEVICE_ENCLOSURE.USER_DEFINED_VALUE2, DEVICE_ENCLOSURE.USER_DEFINED_VALUE3, DEVICE_ENCLOSURE.HCM_AGENT_VERSION, DEVICE_ENCLOSURE.OS_VERSION, DEVICE_ENCLOSURE.CREATED_BY, DEVICE_ENCLOSURE.TRACK_CHANGES, DEVICE_ENCLOSURE.LAST_UPDATE_TIME, DEVICE_ENCLOSURE.LAST_UPDATE_MODULE, DEVICE_ENCLOSURE.
Views H FCIP_TUNNEL.VIRTUAL_SWITCH_ID, DP0_SWITCH_PORT.USER_PORT_NUMBER, DP1_GIGE_PORT.PORT_NUMBER as DP1_GIGE_PORT_NUMBER, DP1_GIGE_PORT.SLOT_NUMBER as DP1_GIGE_PORT_SLOT_NUMBER, FCIP_CIRCUIT_PORT_MAP.DP1_SWITCH_PORT_ID as DP1_GIGE_PORT_ID, DP1_SWITCH_PORT.USER_PORT_NUMBER as DP1_USER_PORT_NUMBER from FCIP_TUNNEL, FCIP_TUNNEL_CIRCUIT left join FCIP_CIRCUIT_PORT_MAP on FCIP_CIRCUIT_PORT_MAP.CIRCUIT_ID = FCIP_TUNNEL_CIRCUIT.ID left join GIGE_PORT as DP0_GIGE_PORT on FCIP_CIRCUIT_PORT_MAP.
H Views bb_switch_port.wwn AS bb_switch_port_wwn, bb_switch_port.name AS bb_switch_port_name, bb_switch_port.slot_number AS bb_switch_port_slot_number, bb_switch_port.port_number AS bb_switch_port_port_number, bb_switch_port.port_id AS bb_switch_port_port_id, bb_switch_port.port_index AS bb_switch_port_port_index, bb_switch_port.area_id AS bb_switch_port_area_id, bb_switch_port.mac_address AS bb_switch_port_mac_address, bb_switch_port.status AS bb_switch_port_status, bb_switch_port.
Views H edge_switch_port.health AS edge_switch_port_health, edge_switch_port.status_message AS edge_switch_port_status_message, edge_switch_port.category AS edge_switch_port_category, edge_switch_port.licensed AS edge_switch_port_licensed, edge_switch_port.type AS edge_switch_port_type, edge_switch_port.kind AS edge_switch_port_kind, edge_switch_port.physical_port AS edge_switch_port_physical_port, edge_switch_port.trunked AS edge_switch_port_trunked, edge_switch_port.
H Views WHERE bb_fabric.managed = 1 AND bb_vs.monitored = 1 AND (edge_fabric.managed IS NULL OR edge_fabric.managed = 1) AND (edge_vs.monitored IS NULL OR edge_vs.monitored = 1); ISL_INFO create or replace view ISL_INFO as select distinct ISL.ID, ISL.FABRIC_ID, ISL.COST, ISL.TYPE, ISL.SOURCE_DOMAIN_ID, ISL.SOURCE_PORT_NUMBER, ISL.MISSING, ISL.MISSING_TIME, ISL.TRUSTED, ISL.CREATION_TIME, ISL.TRUNKED, ISL.MISSING_REASON, SOURCE_VIRTUAL_SWITCH.ID as SOURCE_SWITCH_ID, SOURCE_VIRTUAL_SWITCH.
Views FABRIC_MEMBER VIRTUAL_SWITCH SWITCH_PORT FABRIC where H DEST_FABRIC_MEMBER, DEST_VIRTUAL_SWITCH, DEST_SWITCH_PORT, SOURCE_FABRIC_MEMBER.FABRIC_ID = ISL.FABRIC_ID and SOURCE_VIRTUAL_SWITCH.ID = SOURCE_FABRIC_MEMBER.VIRTUAL_SWITCH_ID and SOURCE_VIRTUAL_SWITCH.DOMAIN_ID = ISL.SOURCE_DOMAIN_ID and SOURCE_SWITCH_PORT.VIRTUAL_SWITCH_ID = SOURCE_VIRTUAL_SWITCH.ID and SOURCE_SWITCH_PORT.CATEGORY = 1 and SOURCE_SWITCH_PORT.USER_PORT_NUMBER = ISL.SOURCE_PORT_NUMBER and DEST_FABRIC_MEMBER.FABRIC_ID = ISL.
H Views SOURCE_SWITCH_PORT.STATE AS SOURCE_SWITCH_PORT_STATE, SOURCE_SWITCH_PORT.HEALTH AS SOURCE_SWITCH_PORT_HEALTH, SOURCE_SWITCH_PORT.STATUS_MESSAGE AS SOURCE_SWITCH_PORT_STATUS_MESSAGE, SOURCE_SWITCH_PORT.CATEGORY AS SOURCE_SWITCH_PORT_CATEGORY, SOURCE_SWITCH_PORT.LICENSED AS SOURCE_SWITCH_PORT_LICENSED, SOURCE_SWITCH_PORT.TYPE AS SOURCE_SWITCH_PORT_TYPE, SOURCE_SWITCH_PORT.KIND AS SOURCE_SWITCH_PORT_KIND, SOURCE_SWITCH_PORT.PHYSICAL_PORT AS SOURCE_PHYSICAL_PORT, SOURCE_SWITCH_PORT.
Views H FABRIC.PRINCIPAL_SWITCH_WWN AS FABRIC_PRINCIPAL_SWITCH_WWN, FABRIC.MANAGEMENT_STATE AS FABRIC_MANAGEMENT_STATE, FABRIC.TYPE AS FABRIC_TYPE, FABRIC.MANAGED AS FABRIC_MANAGED FROM ISL LEFT JOIN FABRIC_MEMBER SOURCE_FABRIC_MEMBER ON SOURCE_FABRIC_MEMBER.FABRIC_ID = ISL.FABRIC_ID JOIN VIRTUAL_SWITCH SOURCE_VIRTUAL_SWITCH ON SOURCE_VIRTUAL_SWITCH.ID = SOURCE_FABRIC_MEMBER.VIRTUAL_SWITCH_ID AND SOURCE_VIRTUAL_SWITCH.DOMAIN_ID = ISL.
H Views DEST_SWITCH_PORT.IDENTIFIER as DEST_SWITCH_PORT_IDENTIFIER, DEST_SWITCH_PORT.KIND as DEST_SWITCH_PORT_KIND, DEST_SWITCH_PORT.PHYSICAL_PORT as DEST_PHYSICAL_PORT, DEST_SWITCH_PORT.
Views H SWITCH_PORT where ISL_TRUNK_GROUP.id = ISL_TRUNK_MEMBER.GROUP_ID and ISL_TRUNK_GROUP.VIRTUAL_SWITCH_ID = SWITCH_PORT.VIRTUAL_SWITCH_ID and ISL_TRUNK_MEMBER.PORT_NUMBER= SWITCH_PORT.USER_PORT_NUMBER; ISL_TRUNK_INFO create or replace view ISL_TRUNK_INFO as select ISL_TRUNK_GROUP.ID, ISL_TRUNK_GROUP.TRUSTED, ISL_TRUNK_GROUP.MISSING, ISL_TRUNK_GROUP.MISSING_TIME, ISL_TRUNK_GROUP.MEMBER_TRACKING_STATUS, ISL_INFO.COST, ISL_INFO.TYPE, ISL_INFO.SOURCE_PORT_NUMBER, ISL_INFO.SOURCE_SWITCH_ID, ISL_INFO.
H Views L2_NEIGHBOR.INTERFACE_ID, L2_NEIGHBOR.RMT_IP_ADDRESS, L2_NEIGHBOR.RMT_IF_NAME, LLDP_DATA.DEVICE_ID as RMT_DEVICE_ID, LLDP_DATA.INTERFACE_ID as RMT_INTERFACE_ID, PHY_INTF.PHYSICAL_ADDRESS as RMT_INTERFACE_MAC, RMT_DEVICE.IS_ROUTER from device RMT_DEVICE, LLDP_DATA, L2_NEIGHBOR, physical_interface PHY_INTF where LLDP_DATA.CHASSIS_ID = L2_NEIGHBOR.LLDP_REM_CHASSIS_ID and LLDP_DATA.CHASSIS_ID_SUBTYPE = L2_NEIGHBOR.LLDP_REM_CHASSIS_ID_SUBTYPE and LLDP_DATA.PORT_ID = L2_NEIGHBOR.
Views H MAPS_EVENT on MAPS_EVENT.ID = MAPS_EVENT_DETAILS.MAPS_EVENT_ID left outer join MAPS_EVENT_CAUSE_ACTION on MAPS_EVENT.VIOLATION_TYPE = MAPS_EVENT_CAUSE_ACTION.VIOLATION_TYPE left outer join VIRTUAL_SWITCH on MAPS_EVENT.MANAGED_ELEMENT_ID = VIRTUAL_SWITCH.MANAGED_ELEMENT_ID left outer join SWITCH_PORT on MAPS_EVENT.SWITCH_PORT_ID = SWITCH_PORT.ID LEFT JOIN INTERFACE ON MAPS_EVENT.INTERFACE_ID = INTERFACE.INTERFACE_ID left outer join FCIP_TUNNEL_CIRCUIT on MAPS_EVENT.
H Views EDGE_SWITCH_PORT.KIND as EDGE_SWITCH_PORT_KIND, EDGE_SWITCH_PORT.LAST_UPDATE as EDGE_SWITCH_PORT_LAST_UPDATE, EDGE_SWITCH.WWN as EDGE_VIRTUAL_SWITCH_WWN, EDGE_SWITCH.NAME as EDGE_SWITCH_NAME, EDGE_SWITCH.DOMAIN_ID as EDGE_SWITCH_DOMAIN_ID, EDGE_SWITCH.SWITCH_MODE as EDGE_SWITCH_MODE, EDGE_SWITCH.OPERATIONAL_STATUS as EDGE_SWITCH_OPERATIONAL_STATUS, EDGE_SWITCH.MANAGEMENT_STATE as EDGE_SWITCH_MANAGEMENT_STATE, EDGE_SWITCH.STATE as EDGE_SWITCH_STATE, EDGE_SWITCH.
Views H AG_F_PORT.QOS_ENABLED as AG_F_PORT_QOS_ENABLED, AG_F_PORT.TUNNEL_CONFIGURED as AG_F_PORT_TUNNEL_CONFIGURED, AG_F_PORT.FCR_FABRIC_ID as AG_F_PORT_FCR_FABRIC_ID, AG_F_PORT.FCR_INTEROP_MODE as AG_F_PORT_FCR_INTEROP_MODE, AG_F_PORT.USER_DEFINED_VALUE1 as AG_F_PORT_USER_DEFINED_VALUE1, AG_F_PORT.USER_DEFINED_VALUE2 as AG_F_PORT_USER_DEFINED_VALUE2, AG_F_PORT.USER_DEFINED_VALUE3 as AG_F_PORT_USER_DEFINED_VALUE3, AG_F_PORT.KIND as AG_F_PORT_KIND, AG_F_PORT.LAST_UPDATE as AG_F_PORT_LAST_UPDATE, AG_SWITCH.
H Views END_DEVICE_PORT.HARDWARE_ADDRESS, END_DEVICE_PORT.TRUSTED as DEVICE_PORT_TRUSTED, END_DEVICE_PORT.CREATION_TIME as DEVICE_PORT_CREATION_TIME, END_DEVICE_PORT.MISSING as DEVICE_PORT_MISSING, END_DEVICE_PORT.MISSING_TIME as DEVICE_PORT_MISSING_TIME, END_DEVICE_PORT.LOGGED_TO_AG, END_DEVICE_PORT.AG_NODE_WWN, END_DEVICE_PORT.AG_N_PORT_WWN As AG_SWITCH_N_PORT_WWN, END_DEVICE_PORT.MISSING_REASON from N2F_PORT_MAP left join SWITCH_PORT AG_F_PORT on AG_F_PORT.USER_PORT_NUMBER = N2F_PORT_MAP.
Views H TEMP_MODULE.NUM_CPUS, TEMP_MODULE.HW_REVISION, TEMP_MODULE.SW_REVISION, TEMP_MODULE.SLOT_NUM, TEMP_MODULE.DEVICE_ID, TEMP_MODULE.PHYSICAL_DEVICE_ID, TEMP_MODULE.UNIT_NUMBER, TEMP_MODULE.UNIT_PRESENT, case when TEMP_MODULE.UNIT_PRESENT = 1 then 'YES' else 'NO' end as UNIT_PRESENT_TXT, TEMP_MODULE.MANAGED_ELEMENT_ID, TEMP_MODULE.IP_ADDRESS, TEMP_FOUNDRY_MODULE.SERIAL_NUM, TEMP_FOUNDRY_MODULE.DRAM_SIZE, TEMP_FOUNDRY_MODULE.BOOT_FLASH_SIZE, TEMP_FOUNDRY_MODULE.CODE_FLASH_SIZE, TEMP_FOUNDRY_MODULE.
H Views ) TEMP_FOUNDRY_MODULE ON TEMP_MODULE.MODULE_ID = TEMP_FOUNDRY_MODULE.MODULE_ID; NPORT_WWN_MAP_INFO This view provides a consolidation between Nport WWN map and AG''s N and F ports. It considers only those N-Ports that are currently occupied that is having non-empty remote port wwn.
Views H PHANTOM_PORT.VIRTUAL_SWITCH_ID = VIRTUAL_SWITCH.ID; PRODUCT_INFO CREATE VIEW product_info AS select distinct TEMP_DEVICE.DEVICE_ID, TEMP_DEVICE.MANAGED_ELEMENT_ID, TEMP_DEVICE.ALIAS_NAME, TEMP_DEVICE.HOST_NAME, TEMP_DEVICE.OPER_STATUS, case when TEMP_DEVICE.OPER_STATUS = 1 then (case when TEMP_DEVICE.FABRIC_WATCH_STATUS = 2 then 'DEGRADED' when TEMP_DEVICE.FABRIC_WATCH_STATUS = 3 then 'DOWN' else 'REACHABLE' end) when TEMP_DEVICE.OPER_STATUS = 2 then 'NOT REACHABLE' when TEMP_DEVICE.
H Views case when TEMP_DEVICE.SUB_CATEGORY > 0 then (select distinct VCSD.IP_ADDRESS from DEVICE as VCSD where VCSD.MANAGED_ELEMENT_ID in (select distinct VM.CLUSTER_ME_ID from VCS_CLUSTER_MEMBER as VM where TEMP_DEVICE.MANAGED_ELEMENT_ID = VM.MEMBER_ME_ID)) else null end as VCS_IP_ADDRESS, TEMP_DEVICE.SYS_CONTACT, TEMP_DEVICE.SYS_LOCATION, TEMP_DEVICE.DESCRIPTION, TEMP_DEVICE.LAST_SEEN_TIME, TO_TIMESTAMP(TEMP_DEVICE.LAST_SEEN_TIME,'YYYYMMDDHH24MISS') as LAST_SEEN_TIMESTAMP, TEMP_DEVICE.
Views H from DEVICE as TEMP_DEVICE left join ( select FOUNDRY_DEVICE.DEVICE_ID, FOUNDRY_DEVICE.PRODUCT_TYPE, FOUNDRY_DEVICE.IMAGE_VERSION from FOUNDRY_DEVICE ) TEMP_FOUNDRY_DEVICE on TEMP_DEVICE.DEVICE_ID = TEMP_FOUNDRY_DEVICE.DEVICE_ID left join ( select PHYSICAL_DEVICE.DEVICE_ID, PHYSICAL_DEVICE.PHYSICAL_DEVICE_ID, PHYSICAL_DEVICE.NUM_SLOTS, PHYSICAL_DEVICE.UNIT_NUMBER from PHYSICAL_DEVICE ) TEMP_PHYSICAL_DEVICE on TEMP_DEVICE.DEVICE_ID = TEMP_PHYSICAL_DEVICE.
H Views PORT_BOTTLENECK_STATUS.STATUS, SWITCH_PORT.VIRTUAL_SWITCH_ID, SWITCH_PORT.USER_PORT_NUMBER, SWITCH_PORT.TYPE from PORT_BOTTLENECK_STATUS left outer join SWITCH_PORT on PORT_BOTTLENECK_STATUS.SWITCH_PORT_ID = SWITCH_PORT.ID; PORT_GROUP_INFO create or replace view PORT_GROUP_INFO as select SWITCH_PORT.ID as PORT_ID, SWITCH_PORT.NAME as SWITCH_PORT_NAME, SWITCH_PORT.WWN, SWITCH_PORT.HEALTH, SWITCH_PORT.STATUS, SWITCH_PORT.PORT_NUMBER, SWITCH_PORT.SLOT_NUMBER, SWITCH_PORT.
Views H PORT_PROFILE_INFO create or replace view PORT_PROFILE_INFO as select PORT_PROFILE.ID, PORT_PROFILE.SWITCH_ME_ID, PORT_PROFILE.NAME, PORT_PROFILE.STATE, PORT_PROFILE.SWITCH_PORT_MODE, PORT_PROFILE.ACL_PROFILE, PORT_PROFILE.QOS_PROFILE, PORT_PROFILE.FCOE_PROFILE, PORT_PROFILE.VLAN_PROFILE, PORT_PROFILE.VLAN_DETAILS, PORT_PROFILE.DEFAULT_PROFILE, PORT_PROFILE.ACL_NAME, PORT_PROFILE.FCOE_MAP_NAME, PORT_PROFILE.ACTIVATED, PORT_PROFILE_QOS_MAP.DCB_MODE, PORT_PROFILE_QOS_MAP.
H Views PORT_PROFILE.FCOE_PROFILE, PORT_PROFILE.VLAN_PROFILE, PORT_PROFILE.VLAN_DETAILS, PORT_PROFILE.DEFAULT_PROFILE, PORT_PROFILE.ACL_NAME, PORT_PROFILE.FCOE_MAP_NAME, PORT_PROFILE_INTERFACE_MAP.INTERFACE_ID, PORT_PROFILE_INTERFACE_MAP.SWITCH_PORT_ID from PORT_PROFILE, PORT_PROFILE_INTERFACE_MAP where PORT_PROFILE.ID= PORT_PROFILE_INTERFACE_MAP.PROFILE_ID; PORT_PROFILE_MAC_INFO create or replace view PORT_PROFILE_MAC_INFO as select PORT_PROFILE_MAC_MAP.PROFILE_ID, PORT_PROFILE_MAC_MAP.
Views H PROTOCOL_VLAN_INFO create or replace view PROTOCOL_VLAN_INFO as select V.*, port_vlan_db_id, is_dynamic, protocol from vlan V, sub_port_vlan SPV, protocol_vlan PV where V.vlan_db_id = SPV.vlan_db_id AND SPV.vlan_db_id = PV.
H Views where SLNUM <= (select MAX_SLNUM from SFLOW_MINUTE_MAC_SLNUM fetch first 1 rows only) union all select DEVICE_ID, TIME_IN_SECONDS, SRC_MAC, DEST_MAC, IN_VLAN, OUT_VLAN, FRAMES, BYTES from SFLOW_STAGING where SLNUM >= (select MIN_SLNUM from SFLOW_STAGING_SLNUM fetch first 1 rows only); SCOM_EE_MONITOR_INFO This view provides combined ee_monitor, ee_monitor_stats, device_port and device_node tables to get the EE Monitor information for SCOM plug-in.
Views H SENSOR.CORE_SWITCH_ID, SENSOR.SENSOR_ID, SENSOR.CURRENT_READING, SENSOR.TYPE, SENSOR.SUB_TYPE, SENSOR.DESCRIPTION, SENSOR.STATUS, SENSOR.OPERATIONAL_STATUS, SENSOR.PART_NUMBER, SENSOR.SERIAL_NUMBER, SENSOR.VERSION, SENSOR.CREATION_TIME, SENSOR.LAST_UPDATE_TIME, SENSOR.FRU_TYPE, SENSOR.UNIT_NUMBER, SENSOR.STATE, CORE_SWITCH.WWN as PHYSICAL_SWITCH_WWN, VIRTUAL_SWITCH.SWITCH_MODE as VIRTUAL_SWITCH_MODE, VIRTUAL_SWITCH.MANAGEMENT_STATE, VIRTUAL_SWITCH.
H Views SC.CARDCN_ID, SC.FIRST_NAME, SC.LAST_NAME, SC.NOTES, SC.CREATION_TIME, -1 ENGINE_ID, EG.ID ENCRYPTION_GROUP_ID, EG.NAME GROUP_NAME, RCGM.POSITION_ CARD_POSITION, -1 CRYPTO_SWITCH_ID, -1 SLOT_NUMBER from SMART_CARD SC, ENCRYPTION_GROUP EG, RECOVERY_CARD_GROUP_MAPPING RCGM where SC.ID = RCGM.SMART_CARD_ID and EG.ID = RCGM.ENCRYPTION_GROUP_ID and SC.CARD_TYPE = 1 union select SC.ID SMART_CARD_ID, SC.CARD_TYPE, SC.CARD_INFO, SC.CARDCN_ID, SC.FIRST_NAME, SC.LAST_NAME, SC.NOTES, SC.CREATION_TIME, EE.
Views H SWITCH_CONFIG. IS_BASELINE, SWITCH_CONFIG. BACKUP_TYPE, SWITCH_CONFIG. DRIFT_STATUS, SWITCH_CONFIG_DETAIL.IP_ADDRESS, SWITCH_CONFIG_DETAIL.WWN, SWITCH_CONFIG_DETAIL.PHYSICAL_SWITCH_WWN, SWITCH_CONFIG_DETAIL.MODEL_NUMBER as SWITCH_MODEL_NUMBER from SWITCH_CONFIG, SWITCH_CONFIG_DETAIL where SWITCH_CONFIG.ID= SWITCH_CONFIG_DETAIL.SWITCH_CONFIG_ID; SWITCH_PORT_DETAILS_INFO create or replace view SWITCH_PORT_DETAILS_REPORT_INFO as with SWPRT_VSW_CSW_CSWDET_SWMDL_VIEW as ( select SWITCH_PORT.
H Views VIRTUAL_SWITCH.NAME as REMOTE_SWITCH_NAME, VIRTUAL_SWITCH.SWITCH_MODE as REMOTE_SWITCH_MODE, VIRTUAL_SWITCH.DOMAIN_ID as REMOTE_SWITCH_DOMAIN_ID, VIRTUAL_SWITCH.WWN as REMOTE_VIRTUAL_SWITCH_WWN, VIRTUAL_SWITCH.OPERATIONAL_STATUS as REMOTE_SWITCH_OPERATIONAL_STATUS, VIRTUAL_SWITCH.MANAGEMENT_STATE as REMOTE_SWITCH_MANAGEMENT_STATE, VIRTUAL_SWITCH.STATE as REMOTE_SWITCH_STATE, VIRTUAL_SWITCH.STATUS as REMOTE_SWITCH_STATUS, VIRTUAL_SWITCH.STATUS_REASON as REMOTE_SWITCH_STATUS_REASON, CORE_SWITCH.
Views H DEVICE_NODE.AG as DEVICE_NODE_IS_AG, DEVICE_NODE.SIMULATED as DEVICE_NODE_SIMULATED, DEVICE_NODE.FABRIC_ID as DEVICE_NODE_FABRIC_ID from DEVICE_PORT join DEVICE_NODE on DEVICE_PORT.NODE_ID = DEVICE_NODE.ID ) select FABRIC_MEMBER.FABRIC_ID, FABRIC.SEED_SWITCH_WWN as FABRIC_SEED_SWITCH_WWN, FABRIC.NAME as FABRIC_NAME, FABRIC.MANAGEMENT_STATE as FABRIC_MANAGEMENT_STATE, FABRIC.PRINCIPAL_SWITCH_WWN as FABRIC_PRINCIPAL_SWITCH_WWN, FABRIC.FABRIC_NAME as FABRIC_SWITCH_PERSIST_FABRIC_NAME, FABRIC.
H Views DEVPORT_DEVNODE_VIEW.DEVICE_NODE_ID, DEVPORT_DEVNODE_VIEW.DEVICE_PORT_COS, DEVPORT_DEVNODE_VIEW.DEVICE_NODE_WWN, DEVPORT_DEVNODE_VIEW.DEVICE_NODE_DEVICE_TYPE, DEVPORT_DEVNODE_VIEW.DEVICE_NODE_NAME, DEVPORT_DEVNODE_VIEW.DEVICE_FDMI_HOST_NAME, DEVPORT_DEVNODE_VIEW.DEVICE_NODE_CAPABILITY, DEVPORT_DEVNODE_VIEW.DEVICE_NODE_TYPE, DEVPORT_DEVNODE_VIEW.DEVICE_NODE_VENDOR, DEVPORT_DEVNODE_VIEW.DEVICE_NODE_PROXY_DEVICE, DEVPORT_DEVNODE_VIEW.DEVICE_NODE_IS_AG, DEVPORT_DEVNODE_VIEW.
Views H SWPRT_VSW_CSW_CSWDET_SWMDL_VIEW.REMOTE_SWITCH_STATE, SWPRT_VSW_CSW_CSWDET_SWMDL_VIEW.REMOTE_SWITCH_STATUS, SWPRT_VSW_CSW_CSWDET_SWMDL_VIEW.REMOTE_SWITCH_STATUS_REASON, SWPRT_VSW_CSW_CSWDET_SWMDL_VIEW.REMOTE_CORE_SWITCH_ID, SWPRT_VSW_CSW_CSWDET_SWMDL_VIEW.REMOTE_CORE_SWITCH_IP_ADDRESS, SWPRT_VSW_CSW_CSWDET_SWMDL_VIEW.REMOTE_CORE_SWITCH_WWN, SWPRT_VSW_CSW_CSWDET_SWMDL_VIEW.REMOTE_CORE_SWITCH_NAME, SWPRT_VSW_CSW_CSWDET_SWMDL_VIEW.REMOTE_CORE_SWITCH_TYPE, SWPRT_VSW_CSW_CSWDET_SWMDL_VIEW.
H Views varying]::text[])) or SWITCH_PORT.TYPE::text~~ 'LB-Port%'::text) and VIRTUAL_SWITCH.MONITORED = 1 and (VIRTUAL_SWITCH.SWITCH_MODE = any (array[0, 2])) and ((CORE_SWITCH.TYPE <> all (array[62, 63])) or (SWITCH_PORT.SLOT_NUMBER <> all (array[5, 8]))) and (FABRIC.MANAGED is null or FABRIC.MANAGED = 1) and (FABRIC.TYPE is null or (FABRIC.TYPE <> all (array[65, 66, 4]))); SWITCH_DETAILS_INFO create or replace view SWITCH_DETAILS_INFO as select CORE_SWITCH.ID as PHYSICAL_SWITCH_ID, CORE_SWITCH.
Views H VIRTUAL_SWITCH.USER_DEFINED_VALUE_1, VIRTUAL_SWITCH.USER_DEFINED_VALUE_2, VIRTUAL_SWITCH.USER_DEFINED_VALUE_3, VIRTUAL_SWITCH.FMS_MODE, VIRTUAL_SWITCH.DYNAMIC_LOAD_SHARING, VIRTUAL_SWITCH.PORT_BASED_ROUTING, VIRTUAL_SWITCH.IN_ORDER_DELIVERY, VIRTUAL_SWITCH.INSISTENT_DID_MODE, VIRTUAL_SWITCH.FCR_CAPABLE, VIRTUAL_SWITCH.LAST_PORT_MEMBERSHIP_CHANGE, VIRTUAL_SWITCH.FCIP_CIRCUIT_CAPABLE, VIRTUAL_SWITCH.MAX_FCIP_TUNNELS, VIRTUAL_SWITCH.MAX_FCIP_CIRCUITS, VIRTUAL_SWITCH.FCIP_LICENSED, VIRTUAL_SWITCH.
H Views CORE_SWITCH_DETAILS.CONTACT, CORE_SWITCH_DETAILS.LOCATION, CORE_SWITCH_DETAILS.DESCRIPTION, CORE_SWITCH_DETAILS.RNID_SEQUENCE_NUMBER, CORE_SWITCH_DETAILS.FIRMWARE_VERSION as CSD_FIRMWARE_VERSION, CORE_SWITCH_DETAILS.CHASSIS_PACKAGE_TYPE, CORE_SWITCH_DETAILS.IP_ADDRESS_PREFIX, CORE_SWITCH_DETAILS.DOMAIN_NAME, CORE_SWITCH_DETAILS.FRAME_LOG_SIZE, CORE_SWITCH_DETAILS.FRAME_LOG_ENABLED, CORE_SWITCH_DETAILS.
Views H SWITCH_PORT.STATUS, SWITCH_PORT.HEALTH, SWITCH_PORT.STATUS_MESSAGE, SWITCH_PORT.PHYSICAL_PORT, SWITCH_PORT.LOCKED_PORT_TYPE, SWITCH_PORT.CATEGORY, SWITCH_PORT.PROTOCOL, SWITCH_PORT.SPEED, SWITCH_PORT.SPEEDS_SUPPORTED, SWITCH_PORT.MAX_PORT_SPEED, SWITCH_PORT.DESIRED_CREDITS, SWITCH_PORT.BUFFER_ALLOCATED, SWITCH_PORT.ESTIMATED_DISTANCE, SWITCH_PORT.ACTUAL_DISTANCE, SWITCH_PORT.LONG_DISTANCE_SETTING, SWITCH_PORT.DEGRADED_PORT, SWITCH_PORT.REMOTE_NODE_WWN, SWITCH_PORT.REMOTE_PORT_WWN, SWITCH_PORT.
H Views SWITCH_PORT.PORT_COMMISSION_STATE, SWITCH_PORT.FEATURES_SUPPORTED, SWITCH_PORT.FEATURES_ENABLED, SWITCH_PORT.FEATURES_ACTIVE, SWITCH_PORT.DISABLED_REASON_CODE, SWITCH_PORT.DISABLED_REASON, SWITCH_PORT.FENCED, SWITCH_PORT.MASTER_PORT_NUMBER, SWITCH_PORT.SPEED_TYPE, VIRTUAL_SWITCH.WWN as VIRTUAL_SWITCH_WWN, VIRTUAL_SWITCH.ROLE as SWITCH_ROLE, VIRTUAL_SWITCH.VIRTUAL_FABRIC_ID as VIRTUAL_FABRIC_ID, VIRTUAL_SWITCH.DOMAIN_ID as DOMAIN_ID, VIRTUAL_SWITCH.INTEROP_MODE as INTEROP_MODE, VIRTUAL_SWITCH.
Views H VIRTUAL_SWITCH.VIRTUAL_FABRIC_ID, VIRTUAL_SWITCH.BASE_SWITCH, VIRTUAL_SWITCH.MAX_ZONE_CONFIG_SIZE, VIRTUAL_SWITCH.CREATION_TIME, VIRTUAL_SWITCH.LAST_UPDATE_TIME, VIRTUAL_SWITCH.USER_NAME, VIRTUAL_SWITCH.PASSWORD, VIRTUAL_SWITCH.MANAGEMENT_STATE, VIRTUAL_SWITCH.STATE, VIRTUAL_SWITCH.STATUS, VIRTUAL_SWITCH.STATUS_REASON, VIRTUAL_SWITCH.MONITORED, VIRTUAL_SWITCH.USER_DEFINED_VALUE_1, VIRTUAL_SWITCH.USER_DEFINED_VALUE_2, VIRTUAL_SWITCH.USER_DEFINED_VALUE_3, FABRIC_MEMBER.FABRIC_ID, FABRIC_MEMBER.
H Views TIME_SERIES_DATA_INFO CREATE VIEW time_series_data_info AS ( ( ( ( ( ( select * from TIME_SERIES_DATA_1 union all select TIME_SERIES_DATA_1_30MIN.TIME_IN_SECONDS, TIME_SERIES_DATA_1_30MIN.TARGET_TYPE, TIME_SERIES_DATA_1_30MIN.MEASURE_ID, TIME_SERIES_DATA_1_30MIN.TARGET_ID, TIME_SERIES_DATA_1_30MIN.COLLECTOR_ID, TIME_SERIES_DATA_1_30MIN.MEASURE_INDEX, TIME_SERIES_DATA_1_30MIN.ME_ID, TIME_SERIES_DATA_1_30MIN.VALUE, TIME_SERIES_DATA_1_30MIN.
Views H TIME_SERIES_DATA_2_2HOUR.VALUE, TIME_SERIES_DATA_2_2HOUR.SUM_VALUE from TIME_SERIES_DATA_2_2HOUR) union all select TIME_SERIES_DATA_2_1DAY.TIME_IN_SECONDS, TIME_SERIES_DATA_2_1DAY.TARGET_TYPE, TIME_SERIES_DATA_2_1DAY.MEASURE_ID, TIME_SERIES_DATA_2_1DAY.TARGET_ID, TIME_SERIES_DATA_2_1DAY.COLLECTOR_ID, TIME_SERIES_DATA_2_1DAY.MEASURE_INDEX, TIME_SERIES_DATA_2_1DAY.ME_ID, TIME_SERIES_DATA_2_1DAY.VALUE, TIME_SERIES_DATA_2_1DAY.
H Views (measure.name::text || '.'::text) || tsd.measure_index::text AS collectible_name, measure.detail AS collectible_detail, tsd.value, tsd.time_in_seconds, tsd.measure_index FROM time_series_data_info tsd JOIN switch_port sp ON tsd.target_type = 4 AND tsd.target_id = sp.id JOIN virtual_switch vs ON sp.virtual_switch_id = vs.id JOIN device de ON vs.managed_element_id = de.managed_element_id JOIN pm_data_collector ON pm_data_collector.id = tsd.collector_id JOIN measure ON measure.id = tsd.
Views H SOURCE_DEVICE.DEVICE_ID AS SOURCE_DEVICE_ID, TRILL.DEST_DOMAIN_ID, TRILL.DEST_PORT_NUMBER, TRILL.DEST_PORT_NAME as DEST_SWITCH_PORT_NAME, TRILL.DEST_ME_ID, DEST_DEVICE.DEVICE_ID AS DEST_DEVICE_ID from TRILL, device VCS_DEVICE, device SOURCE_DEVICE, VIRTUAL_SWITCH SOURCE_VIRTUAL_SWITCH, device DEST_DEVICE, VIRTUAL_SWITCH DEST_VIRTUAL_SWITCH where SOURCE_DEVICE.MANAGED_ELEMENT_ID = TRILL.SOURCE_ME_ID and DEST_DEVICE.MANAGED_ELEMENT_ID = TRILL.DEST_ME_ID and VCS_DEVICE.MANAGED_ELEMENT_ID = TRILL.
H Views ROLE.ID ROLE_ID, ROLE.NAME ROLE_NAME, USER_.NAME USER_NAME from USER_, RESOURCE_GROUP, ROLE, USER_RESOURCE_MAP, USER_ROLE_MAP where USER_ROLE_MAP.USER_NAME = USER_.NAME and USER_ROLE_MAP.ROLE_ID = ROLE.ID and USER_RESOURCE_MAP.RESOURCE_GROUP_ID = RESOURCE_GROUP.ID and USER_RESOURCE_MAP.USER_NAME = USER_.NAME; VIRTUAL_FCOE_PORT_INFO create or replace view VIRTUAL_FCOE_PORT_INFO as select VIRTUAL_FCOE_PORT.ID, VIRTUAL_FCOE_PORT.VIRTUAL_SWITCH_ID, VIRTUAL_FCOE_PORT.PORT_WWN, VIRTUAL_FCOE_PORT.
Views H VIRTUAL_PORT_WWN_DETAILS.SWITCH_PORT_NUMBER, VIRTUAL_PORT_WWN_DETAILS.SLOT_NUMBER, coalesce(CS1.IP_ADDRESS, CS2.IP_ADDRESS, UDDD.IP_ADDRESS) as IP_ADDRESS, coalesce(VS1.NAME, VS2.NAME, UDDD.NAME) as SWITCH_NAME, coalesce(VS1.WWN, VS2.WWN) as SWITCH_WWN, VIRTUAL_PORT_WWN_DETAILS.AG_NODE_WWN, VIRTUAL_PORT_WWN_DETAILS.AG_PORT_NUMBER, VIRTUAL_PORT_WWN_DETAILS.STATUS, VIRTUAL_PORT_WWN_DETAILS.TYPE, VIRTUAL_PORT_WWN_DETAILS.USER_VPWWN, VIRTUAL_PORT_WWN_DETAILS.AUTO_VPWWN, VIRTUAL_PORT_WWN_DETAILS.
H Views AND VM_VIRTUAL_MACHINE.HOST_ID = VM_VCENTER_MEMBER.VM_HOST_ID; VLAN_INT_CLASSIFIER_INFO CREATE VIEW vlan_int_classifier_info AS select VLAN_INTERFACE_RELATION.VLAN_INTERFACE_RELATION_ID, VLAN_INTERFACE_RELATION.VLAN_DB_ID, VLAN_INTERFACE_RELATION.INTERFACE_ID, VLAN_INT_C_TAG_RELATION.C_TAG_ID, MAC_GROUP.NAME, MAC_GROUP.MAC_GROUP_ID, MAC_GROUP.TYPE, MAC_GROUP_MEMBER.MAC_ADDRESS, MAC_GROUP_MEMBER.MASK, MAC_GROUP.ID AS MAC_GROUP_DB_ID, DEVICE.
Views H VM_PATH.TARGET_PORT AS TARGET_PORT_WWN, VM_STORAGE.NAME AS LUN_CAN_NAME, VM_PATH.FS_TYPE, VM_VIRTUAL_MACHINE.HYPERVISOR_VM_ID, DEVICE_ENCLOSURE.MANAGED_ELEMENT_ID AS HOST_ME_ID, DEVICE_ENCLOSURE.IP_ADDRESS AS HOST_IP_ADDRESS, DEVICE_ENCLOSURE.HOST_NAME AS HYPERVISOR_HOST_NAME, FABRIC.NAME AS FABRIC_NAME, VIRTUAL_SWITCH.NAME AS VIRTUAL_NAME, SWITCH_PORT.STATUS AS SWITCH_PORT_STATUS, SWITCH_PORT.ID as SWITCH_PORT_ID, SWITCH_PORT.PORT_ID, SWITCH_PORT.PORT_NUMBER, SWITCH_PORT.
H Views VM_VCENTER.ID as VCENTER_ID, DEVICE_ENCLOSURE.ID AS HOST_DB_ID, DEVICE_ENCLOSURE.IP_ADDRESS as HYPERVISOR_HOST, VM_VIRTUAL_MACHINE.ID as VM_ID, VM_VIRTUAL_MACHINE.IP_ADDRESS AS VM_IP_ADDRESS, VM_VIRTUAL_MACHINE.HOSTNAME AS VM_HOST_NAME, VM_VIRTUAL_MACHINE.UUID as VM_UUID, VM_VIRTUAL_MACHINE.NAME as VM_NAME, VM_PATH.NAME as PATH_NAME, VM_PATH.HBA_PORT as ADAPTER_PORT_WWN, VM_PATH.TARGET_PORT as TARGET_PORT_WWN, VM_STORAGE.NAME as LUN_CAN_NAME, VM_PATH.FS_TYPE, VM_VIRTUAL_MACHINE.
Views and and and and H SWITCH_PORT.VIRTUAL_SWITCH_ID = VIRTUAL_SWITCH.ID VIRTUAL_SWITCH.CORE_SWITCH_ID = CORE_SWITCH.ID DEVICE_PORT.NODE_ID = DEVICE_NODE.ID DEVICE_NODE.FABRIC_ID = FABRIC.ID; comment on view VM_CONNECTIVITY_INFO is 'Combine fabric and VM info to derive end to end connectivity information for the VM'; VM_NETWORK_CONNECTIVITY_INFO CREATE VIEW vm_network_connectivity_info AS select VM_VIRTUAL_ETHERNET_ADAPTER.ID as VNIC_ID, VM_VIRTUAL_ETHERNET_ADAPTER.
H Views left join (select PROFILE_ID, array_agg(VLANID)::varchar as VLAN from PORT_PROFILE_VLAN_MAP group by PROFILE_ID) PROFILE_VLAN_MAP on PROFILE_VLAN_MAP.PROFILE_ID = PORT_PROFILE.ID left join VM_NETWORK_SETTINGS on VM_NETWORK_SETTINGS.VM_STD_VSWITCH_PORT_GROUP_ID = VM_VIRTUAL_ETHERNET_ADAPTER.VM_STD_VSWITCH_PORT_GROUP_ID where VM_VIRTUAL_ETHERNET_ADAPTER.VIRTUAL_MACHINE_ID = VM_VIRTUAL_MACHINE.ID and VM_VIRTUAL_MACHINE.HOST_ID = VM_VCENTER_MEMBER.VM_HOST_ID and VM_VIRTUAL_MACHINE.HOST_ID = VM_HOST.
Views H left join VCS_CLUSTER_MEMBER on VCS_CLUSTER_MEMBER.MEMBER_ME_ID = DEVICE.MANAGED_ELEMENT_ID left join DEVICE as CLUSTER_DEVICE on CLUSTER_DEVICE.MANAGED_ELEMENT_ID = VCS_CLUSTER_MEMBER.CLUSTER_ME_ID left join PORT_PROFILE_INTERFACE_MAP on PORT_PROFILE_INTERFACE_MAP.INTERFACE_ID = INTERFACE.INTERFACE_ID left join PORT_PROFILE on PORT_PROFILE.ID = PORT_PROFILE_INTERFACE_MAP.PROFILE_ID left join (select PORT_PROFILE_DOMAIN_MAP.PROFILE_ID, array_to_string(array_agg(PORT_PROFILE_DOMAIN.
H Views DEST_NODE.WWN as DEST_DEVICE_WWN, DEST_PORT.WWN as DEST_PORT_WWN, SOURCE_NODE.FABRIC_ID as SOURCE_FABRIC_ID, DEST_NODE.FABRIC_ID as DEST_FABRIC_ID, SOURCE_PORT.DOMAIN_ID as SOURCE_SWITCH_DOMAIN_ID, DEST_PORT.DOMAIN_ID as DEST_SWITCH_DOMAIN_ID, VM_VIRTUAL_MACHINE.HYPERVISOR_VM_ID, VM_VIRTUAL_MACHINE.NAME as VM_NAME from VM_PATH, VM_VIRTUAL_MACHINE, DEVICE_PORT as SOURCE_PORT, DEVICE_PORT as DEST_PORT, DEVICE_NODE as DEST_NODE, DEVICE_NODE as SOURCE_NODE, EE_MONITOR, EE_MONITOR_STATS where VM_PATH.
Views H VM_VIRTUAL_MACHINE.HOSTNAME as VM_HOSTNAME, VM_VIRTUAL_MACHINE.BOOT_TIME as VM_BOOT_TIME, VM_VIRTUAL_MACHINE.DATASTORE_NAME, VM_VIRTUAL_MACHINE.DATASTORE_LOCATION, VM_VIRTUAL_MACHINE.NODE_WWN as VM_NODE_WWN from VM_DATA_CENTER, VM_HOST left join VM_VIRTUAL_MACHINE on VM_HOST.DEVICE_ENCLOSURE_ID = VM_VIRTUAL_MACHINE.HOST_ID where VM_DATA_CENTER.ID = VM_HOST.VM_DATACENTER_ID; VM_LUN_INFO create or replace view VM_LUN_INFO as select VM_STORAGE.HOST_ID, VM_STORAGE.ID as LUN_ID, VM_STORAGE.
H Views DEVICE_PORT.DOMAIN_ID, DEVICE_ENCLOSURE.IP_ADDRESS as HYPERVISOR_HOST, VM_PATH.HBA_PORT as ADAPTER_PORT_WWN, VM_VIRTUAL_MACHINE.HYPERVISOR_VM_ID, VM_VIRTUAL_MACHINE.NAME as VM_NAME, CORE_SWITCH.IP_ADDRESS, CORE_SWITCH.NAME as CORE_NAME, FC_PORT_STATS.TX, FC_PORT_STATS.RX, FC_PORT_STATS.TX_UTILIZATION, FC_PORT_STATS.RX_UTILIZATION, FC_PORT_STATS.SYNCLOSSES, FC_PORT_STATS.SIGNALLOSSES, FC_PORT_STATS.SEQUENCEERRORS, FC_PORT_STATS.INVALIDTRANSMISSIONS, FC_PORT_STATS.CRCERRORS, FC_PORT_STATS.
Views H SWITCH_TE_PORT_STATS.RECEIVE_OK_PERCENT_UTIL, (-1) AS SYNCLOSSES, (-1) AS SIGNALLOSSES, (-1) AS SEQUENCEERRORS, (-1) AS INVALIDTRANSMISSIONS, (-1) AS CRCERRORS, SWITCH_TE_PORT_STATS.CREATION_TIME, VIRTUAL_SWITCH.NAME as VIRTUAL_NAME, SWITCH_PORT.STATUS as SWITCH_PORT_STATUS, SWITCH_PORT.PORT_ID, SWITCH_PORT.
H Views VR_CONN_DOMAIN_GROUP.NAME as DOMAIN_GROUP_NAME, VCEM_PROFILE.ID as VCEM_PROFILE_ID, VCEM_PROFILE.DISCOVERY_STATUS, VCEM_PROFILE.LAST_FAILURE_TIMESTAMP as VCEM_LAST_FAILED_TIME, VCEM_PROFILE.LAST_SUCCESSFUL_TIMESTAMP as VCEM_LAST_SUCCESSFUL_TIME, VIRTUAL_SWITCH.ID as VIRTUAL_SWITCH_ID, VIRTUAL_SWITCH.MANAGED_ELEMENT_ID as VIRTUAL_SWITCH_ME_ID, VIRTUAL_SWITCH.NAME, CORE_SWITCH.IP_ADDRESS, FABRIC_MEMBER.FABRIC_ID, FABRIC.
Views H FABRIC.MANAGED as FABRIC_MANAGED from VR_CONN_MODULE inner join VR_CONN_DOMAIN on VR_CONN_DOMAIN.ID = VR_CONN_MODULE.VR_CONN_DOMAIN_ID inner join VCEM_PROFILE on VCEM_PROFILE.ID = VR_CONN_DOMAIN.VCEM_PROFILE_ID left outer join VR_CONN_DOMAIN_GROUP on VR_CONN_DOMAIN_GROUP.ID = VR_CONN_DOMAIN.VR_CONN_DOMAIN_GROUP_ID left outer join VIRTUAL_SWITCH on VIRTUAL_SWITCH.WWN = VR_CONN_MODULE.WWN left outer join CORE_SWITCH on CORE_SWITCH.ID = VIRTUAL_SWITCH.
H Views left outer join VIRTUAL_SWITCH on VIRTUAL_SWITCH.WWN = VR_CONN_MODULE.WWN; VR_CONN_NPIV_INFO create or replace view VR_CONN_NPIV_INFO as select VR_CONN_WWN.ID, VR_CONN_WWN.VR_CONN_FC_CONNECTION_ID, VR_CONN_WWN.PORT_ADDRESS as PORT_WWN, VR_CONN_WWN.NODE_ADDRESS as NODE_WWN, VR_CONN_SERVER_PROFILE.NAME as SERVER_PROFILE_NAME, VR_CONN_SERVER_PROFILE.BAY_NAME, coalesce(VR_CONN_SERVER_PROFILE.BAY_NUMBER, VR_CONN_FC_CONNECTION.CONNECTION_BAY) as BAY_NUMBER, VR_CONN_SERVER_PROFILE.
Views H SWITCH_PORT.WWN = VR_CONN_MODULE_PORT.WWN left outer join DEVICE_PORT on DEVICE_PORT.WWN = VR_CONN_WWN.PORT_ADDRESS left outer join DEVICE_NODE on DEVICE_NODE.WWN = VR_CONN_WWN.NODE_ADDRESS left outer join USER_DEFINED_DEVICE_DETAIL on USER_DEFINED_DEVICE_DETAIL.WWN = VR_CONN_WWN.PORT_ADDRESS; VMM_DISCOVERED_MAC_INFO create or replace view VMM_DISCOVERED_MAC_INFO AS select VM_VIRTUAL_ETHERNET_ADAPTER.MAC_ADDRESS, VM_VIRTUAL_ETHERNET_ADAPTER.DISPLAY_LABEL, VM_VIRTUAL_ETHERNET_ADAPTER.
H Views where VM_PHYSICAL_NIC.VM_HOST_ID = VM_VCENTER_MEMBER.VM_HOST_ID AND VM_VCENTER_MEMBER.VM_VCENTER_ID = VM_VCENTER.ID; VM_VIRTUAL_ETHERNET_ADAPTER_INFO create or replace view VM_VIRTUAL_ETHERNET_ADAPTER_INFO as select VM_VIRTUAL_ETHERNET_ADAPTER.ID, VM_VIRTUAL_ETHERNET_ADAPTER.MAC_ADDRESS, VM_VIRTUAL_ETHERNET_ADAPTER.DISPLAY_LABEL, VM_VIRTUAL_ETHERNET_ADAPTER.PORT_GROUP_NAME, VM_VIRTUAL_MACHINE.NAME as VIRTUAL_MACHINE_NAME, VM_VCENTER_MEMBER.HOST_NAME, VM_VCENTER.
Views H ZONE_DB_REPORT_INFO CREATE OR REPLACE VIEW zone_db_report_info AS SELECT zone_db.id, zone_db.fabric_id, zone_db.offline, zone_db.name, zone_db.created, zone_db.created_by, zone_db.last_modified, zone_db.last_modified_by, zone_db.last_applied, zone_db.last_applied_by, zone_db.default_zone_status, zone_db.mcdata_default_zone, zone_db.mcdata_safe_zone, zone_db.zone_txn_supported, zone_db.zone_config_size, zone_db.txn_status, zone_db.zone_available_size, zone_db_config.id AS config_id, zone_db_config.
H Views SFLOW_MINUTE_VLAN_VIEW create or replace view SFLOW_MINUTE_VLAN_VIEW as select DEVICE_ID, TIME_IN_SECONDS, IN_VLAN, OUT_VLAN, FRAMES, BYTES from SFLOW_MINUTE_VLAN where SLNUM <= (select MAX_SLNUM from SFLOW_MINUTE_VLAN_SLNUM fetch first 1 rows only) union all select DEVICE_ID, TIME_IN_SECONDS, IN_VLAN, OUT_VLAN, FRAMES, BYTES from SFLOW_STAGING where SLNUM >= (select MIN_SLNUM from SFLOW_STAGING_SLNUM fetch first 1 rows only); PHYSICAL_DEVICE_INFO create or replace view PHYSICAL_DEVICE_INFO as se
Views H MANAGED_ELEMENT_INFO Common managed element data used by custom DTO methods to identify the managed element type, and provide a link to the details table for the managed element. Some common managed element fields are included in this view so Fault Management can use this view to identify the managed element ID for an event source. create or replace view MANAGED_ELEMENT_INFO as select MANAGED_ELEMENT.ID as MANAGED_ELEMENT_ID, DEVICE.DEVICE_ID as IP_DEVICE_ID, coalesce(CS_ME.ID, CS_VS.
H Views ( ( ( ( SELECT de.device_id, de.ip_address AS device_ip, se.target_type, de.device_id AS target_id, de.sys_name AS target_name, 1 AS collectible_type, se.expression_id AS collectible_id, se.collector_id, ( SELECT perf_collector.name AS collector_name FROM perf_collector WHERE perf_collector.collector_id = se.collector_id) AS collector_name, ( SELECT snmp_expression.name AS collectible_name FROM snmp_expression WHERE snmp_expression.expression_id = se.
Views H UNION ALL SELECT de.device_id, de.ip_address AS device_ip, se.target_type, ifs.interface_id AS target_id, ifs.if_name AS target_name, 1 AS collectible_type, se.expression_id AS collectible_id, se.collector_id, ( SELECT perf_collector.name AS collector_name FROM perf_collector WHERE perf_collector.collector_id = se.collector_id) AS collector_name, ( SELECT snmp_expression.name AS collectible_name FROM snmp_expression WHERE snmp_expression.expression_id = se.
H Views VM_VNETWORK_INFO This view provideds combine VM and device information to derive VM to the ingress switch port information. create or replace view VM_VNETWORK_INFO as select VM_HOST.HYPERVISOR_NAME as VHOST_NAME, VM_VIRTUAL_MACHINE.NAME as VM_NAME, VM_VIRTUAL_MACHINE.HYPERVISOR_VM_ID as VM_ID, VM_VIRTUAL_ETHERNET_ADAPTER.MAC_ADDRESS as VNIC_MAC, VM_DV_PORT_GROUP.NAME as PGRP_NAME, VM_DV_SWITCH.NAME as VSWITCH_NAME, VNIC_DV_PORT.NAME as DVPORT_NAME, VM_PHYSICAL_NIC.
Views H VM_PHYSICAL_NIC.DEVICE_NAME as PNIC_NAME, VM_PHYSICAL_NIC.MAC_ADDRESS as PNIC_MAC, DEVICE.SYS_NAME as SWITCH_NAME, DEVICE.IP_ADDRESS as SWITCH_IP, PHYSICAL_PORT.PORT_NUM as SWITCH_PORT, INTERFACE.PORT_STATUS as SWITCH_PORT_STATUS from VM_HOST left join VM_VIRTUAL_MACHINE on VM_HOST.DEVICE_ENCLOSURE_ID = VM_VIRTUAL_MACHINE.
H Views RESET_VCS_LICENSED CREATE OR REPLACE FUNCTION reset_vcs_licensed(no_of_licenses integer) RETURNS void AS $BODY$ begin UPDATE fabric set vcs_licensed = 0; UPDATE device set vcs_licensed = 0; UPDATE fabric set vcs_licensed = 1 WHERE fabric.id in (SELECT id FROM fabric ORDER BY creation_time LIMIT no_of_licenses); UPDATE device set vcs_licensed = 1 WHERE device.
Views H SELECT l2.device_id, l2.device_ip_address, l2.physical_device_id, l2.unit_number, l2.slot_id, l2.slot_num, l2.module_id, l2.physical_port_id, l2.port_num, l2.interface_id, l2.name, l2.if_name, l2.identifier, l2.speed_in_mb, l2.physical_address, l2.interface_id AS radioif_id, wireless.radio_type, wireless.is_enabled, wireless.is_auto_channel, wireless.tx_power, wireless.channel_number, wireless.max_data_rate, wireless.beacon_rate, wireless.dtim, wireless.rts_threshold, wireless.
H Views select L2.DEVICE_ID, L2.MANAGED_ELEMENT_ID, L2.DEVICE_IP_ADDRESS, L2.PHYSICAL_DEVICE_ID, L2.UNIT_NUMBER, L2.SLOT_ID, L2.SLOT_NUM, L2.MODULE_ID, L2.PHYSICAL_PORT_ID, L2.PORT_NUM, L2.INTERFACE_ID, L2.NAME, L2.IF_NAME, L2.IDENTIFIER, L2.TABLE_SUBTYPE, case when L2.TABLE_SUBTYPE like 'GBIT_ETHERNET_INTERFACE' then 'GIGABIT ETHERNET' when L2.TABLE_SUBTYPE like 'POS_INTERFACE' then 'POS' else L2.TABLE_SUBTYPE end as TABLE_SUBTYPE_TXT, L2.TAG_MODE, case when L2.TAG_MODE = 1 then 'TAGGED' when L2.
Views H INM_IP_INTERFACE.SUBNET_MASK from INM_IP_INTERFACE) L3 on L2.INTERFACE_ID = L3.IP_ID; CEE_PORT_INFO create or replace view CEE_PORT_INFO as CREATE VIEW cee_port_info AS select GIGE_PORT.ID, GIGE_PORT.SWITCH_PORT_ID, GIGE_PORT.PORT_NUMBER, CEE_PORT.ID AS CEE_PORT_ID, CEE_PORT.VIRTUAL_SWITCH_ID, CEE_PORT.IF_INDEX, CEE_PORT.IF_NAME, CEE_PORT.IF_MODE, CEE_PORT.L2_MODE, CEE_PORT.VLAN_ID, CEE_PORT.LAG_ID, CEE_PORT.IP_ADDRESS, CEE_PORT.MAC_ADDRESS, CEE_PORT.PORT_SPEED, CEE_PORT.ENABLED, CEE_PORT.
H 1868 Views Brocade Network Advisor SAN User Manual 53-1003154-01
Index A access levels defined, 1469 features, 1469–1470, 1471–?? roles, 1469 accessing FTP server folder, 126 ACK emulation, device level, 970 activating Allow/Prohibit Matrix configuration, 1031 LSAN zones, 915 zone configuration, 901 active session management, roles and access levels, 1469 active sessions, viewing, 10 adapter software using to manage driver files, 578 adapters types of, 570 types of fabric adapters, 571 Adaptive Rate Limiting (ARL), 942 add authentication card dialog box, 698 Add Flow De
enabling, 78 immediate, 80 management server, 75 reviewing events, 80 roles and access levels, 1470 starting, 80 status, determining, 362 switch configuration, 479 viewing status, 79 base switch, creating, 682 blade processor links, 707 blade processors configuring links, 708 boot image repository and host adapters, 580 backing up files, 583 deleting image, 583 downloading an image to a selected host, 582 importing, 581 boot LUN zones about, 921 creating, 921 deleting, 923 modifying, 922 bottleneck detectio
storage encryption privileges, 695 storage port mapping, 561 configuration file searching, 485 viewing, 484 configuration files, saving, 475, 477 configuration management roles and access levels, 1469 configuration repository backup, 479 configuration repository management, overview, 475 configuration status results understanding, 800 Configure menu, 1415 configuring allow/prohibit matrix, 1025 asset polling, 122 bottleneck alert parameters, 1102 call home, 390 cascaded FICON fabric, 1034 client export port
D dashboard customization, 169 set network scope, 169 data historical performance, 1078 real time performance, 1074 data backup, 75 data backup and restore, 599 data collection historical performance, 1079 historical performance graph, 1081 historical performance graph configuration, 1081 data restore, 81 database fields Sybase and Derby, 1519 database, restoring, 454 deactivating zone configuration, 902 decommissioned IDs deleting, 854 displaying, 854 default background color, changing, 385 default communi
Discover menu, 1414 discovering a fabric, 35 discovery, 35 configuring, 37 description of, 573 in-band, enabling, 37 out-of-band, enabling, 37 setting up, 37 SNMP version, 37 state, 45 troubleshooting, 46, 66, 72 discovery setup roles and access levels, 1471 disk devices decommissioning, 853 disk luns decommissioning, 854 rekeying manually, 856 setting rekey all, 857 viewing rekey details, 858 display end nodes, 88 display, FICON, 85 displaying bottleneck statistics, 1105 event details, 1319 FCIP performanc
encryption group adding a switch using the management application, 801 confirming configuration status, 793 creating using the encryption setup wizard, 764 switch connection requirements, 713, 739 encryption group properties editing, 868 using the restore master key, 851 viewing, 868 viewing encryption group properties, 868 encryption group properties dialog box authentication cards, 697 General tab, 873 HA Clusters tab, 809, 877 Link Keys tab, 879 Members tab, 873 encryption groups creating, 764 replacing
events Ethernet, 89 event types, 597 filtering, 598, 1322 monitoring methods, 1255 storage, 90 viewing, 1261 expanding groups, 387 explicit server IP address configuring, 118 export switch configuration, 487 exporting generated report, 237 log entries, 1318 master log, 1322 real time performance data, 1077, 1086 reports, 1404 storage port mapping, 558, 567 zone alias, 898 zone databases, 910 Extended Fabrics license, 1038 external FTP server configuring, 128 F fabric assigned WWN adding AG ports, 591 auto-
configuring, 958 deleting, 978 disabling, 977, 978 enabling, 977, 978 modifying, 961 VE/VEX port properties viewing, 974 FCIP configuration advanced settings, 967 IP interfaces, 958 IP routes, 958 FCIP configuration, guidelines, 957 FCIP Design Considerations 7800 switch and FX8-24 blade, 939 FCIP trunking, 936 FCoE management, roles and access levels, 1470 FCR configuration, launching, 414 feature active session management, 1469 add/delete properties, 1471 backup, 1470 call home, 390, 1469 CEE management,
G general tab encryption group properties general tab, 869 generating performance graph, 1074 performance reports, 1405 reports, 1398 zoning reports, 1407 graphing end-to-end monitor pairs, historical, 1093 end-to-end monitor pairs, real time, 1093 historical performance data collection, 1081 graphs FCIP performance for Ethernet ports, 979 FCIP performance for FC ports, 979 group background color, changing, 384 grouping overview, 387 groups collapsing, 387 expanding, 387 overview, 387 groups, changing color
configuring for encryption targets, 820 deleting permanently, 65, 71 http //www.gemalto.com/readers/index.html, 696 I IBM z/OS Global Mirror (z Gm), 949 icons device, 363, 364 products, 363, 364 IFL.
link keys tab, 879 link keys, creating, 879 link reset threshold, 998 link reset thresholds adding, 1003 listing un-zoned members, 929 zone members, 928 LKM creating link keys, 879 support for high availability (HA), 721, 729 Load leveling and failover, 938 log entries copying, 1318 copying parts, 1318 exporting, 1318 logging in remote client, 4 remote SMIA configuration tool, 459 server, 3 logical switch assigning ports, 685 changing to base switch, 690 creating, 682 deleting, 687 moving, 689 removing port
members tab encryption group properties members tab, 873 membership list, fabric binding adding detached devices, 989 adding switches, 989 removing switches, 990 memory allocation configuration, 120 configuring asset polling, 122 viewing status, 123 menu bar Configure, 1415 Discover, 1414 Edit, 1412 Help, 1411, 1421 Monitor, 1418 Server, 1411, 1412 Tools, 1421 View, 1411, 1413 M-EOS feature listing, 29 merging cascaded FICON fabrics, 1038 zone databases, 907 merging zones, 888 metaSAN, definition, 670 minim
roles and access levels, 1470 performance data real time, 1074 performance database, 1087 performance graph generating, 1074 saving historical configuration, 1081 performance monitoring overview, 1067 thresholds, 1107 performance reports generating, 1405 physical map customizing views, 377 default background color, changing, 385 displaying connections, 384 group background color, changing, 384 layout, changing, 383 layout, overview, 382 levels of detail, 369 port display, changing, 386 port label, changing,
creating, 1295 creating an event action on the flapping policy, 1304 creating an event action on the resolving policy, 1303 deleting, 1299 filtering traps, 1297 modifying an existing definition, 1299 setting policies, 1296 public key certificate importing from properties, 867 Q QoS implementation in FCIP, 946 QoS priorities per FCIP circuit, 942 R Radius server configuring, 432 RBAC user privileges, 1451 RDR application considerations, 955 real time performance, 1074 exporting data, 1077, 1086 filtering d
S SAN tab, 352 saving historical performance graph configuration, 1081 switch configuration files, 475, 477 zone databases to switch, 909 scheduling technical support information collection, 1385 search names, 101 WWN, 102 searching configuration file, 485 members in zones, 927 Potential Members list, 927 zones in zone configuration, 928 Zones list, 928 security configuring, 102 roles and access levels, 1470 security authentication configuring using the GUI, 595 security tab encryption group properties secu
status backup, 79 discovery, 45 host discovery, 65, 71 memory allocation, 123 status bar, 362 stop monitoring, 50 storage array adding storage ports to, 562 creating, 562 deleting, 564 reassigning storage ports to, 563 unassigning storage ports from, 563 storage array properties editing, 564 viewing, 565 storage arrays configuring, 827 storage encryption configuration privileges, 695 configuring, 813 confirming the configuration status, 818 selecting the encryption engine for configuration, 814 selecting th
zoning 1 database fields, 1663–?? tape lun read ahead, 834 write early, 834 tape lun statistics clearing container, 836 clearing for specific tape luns, 837 clearing for tape luns in a container, 838 viewing container, 836 viewing for specific tape luns, 837 viewing for tape luns in a container, 838 Tape Pipelining, 948 tape pipelining, 949 tape pools adding, 881 description of, 881 identifying using a name or a number, 882 modifying, 880 overview, 881 removing, 880 tape pools tab encryption group propertie
Tools menu, 1421 tooltips configuring, 91 topolgy viewing ports, 517 topology changing port display, 386 changing port label, 386 changing product label, 386 customizing views, 377 displaying connections, 384 group background color, changing, 384 showing connected ports, 518 viewing port types, 518 topology, changing layout, 383 topology, overview, 382 topology, See also physical map total user count, 363 traffic isolation zone adding members, 918 creating, 918 disabling, 920 disabling failover, 920 enablin
storage port properties, 564 storage properties, 1478 technical support information, 1390 thresholds, 1013 thresholds on a specific device, 1013 zooming in, 368 zooming out, 368 viewing ports connection properties, 518 views copying, 381 creating, 377 deleting, 380 editing, 379 Virtual Fabrics, 675 virtual fabrics FICON best practices, 679 VM Manager deleting, 575 discovery, 574 editing, 575 VM managers deleting from discovery, 70 VMware vSphere Update Manager, using to update drivers on ESXi hosts, 578 W
creating, 899 naming conventions, 888 zone set.