
User Manual v12.3.0 User Manual

180 Brocade Network Advisor SAN User Manual
53-1003154-01
Dashboard customization
6
Status widget
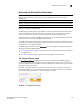
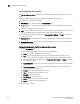
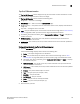
The Status widget (Figure 61) displays the number of products managed and the number of events
within the selected event time range
FIGURE 61 Status widget
The Status widget displays the following items for each product license:
• Time Scope — The time scope.
• Fibre Channel Fabrics — The number of managed fabrics.
• SAN Switches — The number of managed SAN switches.
• SAN Physical Switches — The number of discovered physical SAN switches.
• Hosts — The number of managed hosts.
VM Alarms widget
NOTE
Viewing the VM Alarms widget requires discovery of vCenters in the Java client.
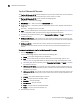
The VM Alarms widget displays the vCenter alarms for the specified fabric and time range in a
table.
The VM Alarms widget includes the following data:
• Widget title — The name of the widget.
• VM — Virtual Machine name.
• Host — Host name.
• Total — Number of alarms triggered by the following violations: VM disk aborts, VM disk resets,
VM disk usage (kbps), and VM total disk latency (ms).
- Latency — Number of latency violations.
- Usage — Number of usage violations.
- Aborts — Number of abort violations.
- Resets — Number of reset violations.
Customizing the VM Alarms widget
You can customize the VM Alarms widget to display data for a specific fabric and duration.
• To display data for a specific fabric or group, refer to “Setting the network scope” on page 169.
• To display data for a specific duration, refer to “Configuring the dashboard display” on
page 171.