
User Manual v12.3.0 User Manual

272 Brocade Network Advisor SAN User Manual
53-1003154-01
Dashboard overview
7
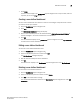
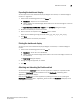
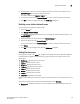
• Title — The name of the status widget. For more information, refer to “Status widgets” on
page 281.
• Description — A general description of the status widget.
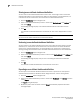
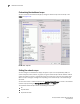
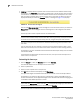
4. Click the Performance tab (Figure 114).
The preconfigured performance monitors display. You can create up to 100 performance
monitors; however, you can only display up to 30 performance monitors. For more information
about performance monitors, refer to “Performance monitors” on page 297.
FIGURE 114 Customize Dashboard dialog box, Performance tab
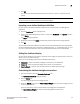
5. Select the Display check box in the Performance Monitors list for each performance monitor
you want to add to the dashboard.
Clear the check box to remove the associated performance monitor from the dashboard.
The Performance Monitors list contains the following additional information:
• Title — The name of the performance monitor. For more information, refer to “Performance
monitors” on page 297
• Type — The type of monitor.
• Measure — The performance measures included in the monitor.
• Data Collectors — The data collectors that provide data for the monitor.
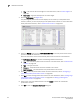
6. Click Add to add a new performance monitor. For more information, refer to “Configuring a
user-defined product performance monitor” on page 333.
7. Cl ick Edit to edit an existing performance monitor. For more information, refer to “Configuring a
user-defined product performance monitor” on page 333 or “Editing a preconfigured
performance monitor” on page 323.
8. Select one or more user-defined monitors and click Delete to delete the user-defined
performance monitors.
9. Click OK to close the Customize Dashboard dialog box.