
User Manual v12.3.0 User Manual
280 Brocade Network Advisor SAN User Manual
53-1003154-01
Default dashboards
7
Default dashboards
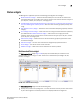
The Management application provides preconfigured dashboards which provide high-level overview
of the network, the current states of managed devices, and performance of devices, ports, and
traffic on the network.
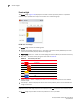
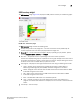
Product Status and Traffic dashboard
The Product Status and Traffic dashboard provides the following preconfigured status widgets and
performance monitors:
• SAN Inventory widget
• Status widget
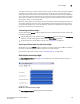
The Bottleneck Graph dialog box displays event information for a specific duration by selecting one
of the following from the time period:
• Out of Range Violations widget
• Top Product Memory Utilization monitor
• Top Product CPU Utilization monitor
• Top Products with Unused Ports monitor
• Top Port Utilization Percentage monitor (includes details for all ports, Initiator ports, ISL ports,
and Target ports)
• Bottom Port Utilization Percentage monitor (includes details for all ports, Initiator ports, ISL
ports, and Target ports)
SAN Ports Health
The SAN Ports Health dashboard provides the following preconfigured status widgets and
performance monitors for the ISL, Host, and Target ports:
• Port Health Violations widget
• Bottlenecked Ports widget
• Top Port CRC Errors monitor
• Top Port Sync Losses monitor
• Top Port Link Failures monitor
• Top Port C3 Discards RX TO monitor
• Top Port Link Resets monitor
• Top Port Encode Error Out monitor