
User Manual v12.3.0 User Manual

294 Brocade Network Advisor SAN User Manual
53-1003154-01
Monitoring and Alerting Policy Suite widgets
7
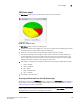
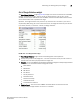
• Network Object Count — The number and network object type (such as switch, virtual machine,
port, trunk, and so on) with a MAPS and Fabric Watch violation for each category. Always
displays whether or not there is a violation.
NOTE
For FCIP Health, the Network Object Count is based on the number of VE_port and circuit
combinations with a MAPS violation. For example, if switch A and switch B are connected
through one circuit, and both switch A and switch B report a violation, the Network Object
Count is 2, because the circuit on switch A is considered to be on a different network object
than the circuit on switch B.
• Refreshed — The time of the last update for the widget.
Customizing the Out of Range Violations widget
You can customize the widget to display violations for a specific fabric or group and time frame.
• To display data for a specific fabric or group, refer to “Creating a customized network scope” on
page 275.
• To display data for a specific duration, refer to “Customizing the time scope” on page 278.
• Sort the contents by clicking the column header. Click the same column header again to
reverse the sort order.
Accessing additional data from the widget
• Right-click any row and select Violations to navigate to the Violations dialog box.
• Double-click the Port Health category row (or right-click and select Port Health Violations) to
navigate to the Port Health Violations widget. For more information, refer to “Port Health
Violations widget” on page 295.
• Double-click the Virtual Machine Violations category row to navigate to the VM Alarms widget.
For more information, refer to the “VM Alarms widget” on page 291.
• Double-click any category row, other than Port Health and Virtual Machine Violations, to
navigate to the Violations dialog box.